



TL;DR: Shooting star and hanging man patterns are one-candle warnings after a rise, and neither is a sell signal until the next bar confirms. Each has a small body and one shadow at least twice the body, upper for the star and lower for the hanging man. Confirmation is a close below the body within one to three bars, and the stop sits above the pattern high. On ten years of ES daily bars, unconfirmed hanging men preceded lower prices less often than an average uptrend day.
You are long, or thinking about getting short, and the chart prints a candle with a tiny body and one long wick right after a run higher. The question is not what the candle is called. The question is whether it changes your decision, and what it costs to act on it.
Shooting star and hanging man patterns are two of the most searched single candles because they sit at exactly that moment. They are also two of the easiest to misread, because the same shapes mean the opposite thing after a decline. This guide measures both candles on worked bars, prices the trade on E-mini S&P 500 futures, walks through two dated 2026 examples, and reports what a ten-year count on ES daily bars and the published studies found.
What Shooting Star and Hanging Man Patterns Are
Shooting star and hanging man patterns are both single candles with a small real body, one long shadow and little or nothing on the other side. Both are read as bearish reversal candidates, and both only count when they print after an advance.
The difference is which shadow is long.
- Shooting star. A small body near the low of the bar and a long upper shadow. StockCharts ChartSchool describes it as one candle, white or black, with a small body, a long upper shadow and a small or nonexistent lower shadow, with the upper shadow at least twice the length of the body.
- Hanging man. A small body near the high of the bar and a long lower shadow. TradingView's Help Center describes it as a single-candle bearish reversal pattern after an uptrend, with a small body in the upper part of the range, a lower shadow usually at least two times the body, and an upper shadow that is absent or very short.
Each shadow is a record of a failed attempt. On a shooting star, buyers pushed price well above the open and could not hold it, so the bar closed back near where it started. On a hanging man, sellers drove price well below the open inside an uptrend, and buyers brought it back before the close.
That is why the hanging man is the quieter of the two. Its close still looks like a win for buyers. The warning is that sellers were able to push that far at all after a stretch where buyers had been in control.
How to Identify a Shooting Star or Hanging Man Candle
Pattern descriptions use words like small and long, so two traders can look at the same shooting star or hanging man candle and disagree. A handful of measurements settles most of that argument.
- Body as a share of the range. A common convention is a body of roughly one third of the bar's high to low range or less.
- Long shadow divided by the body. Two times is the conventional minimum in both the StockCharts and TradingView definitions.
- The opposite shadow. Small or missing. A working limit some traders use is 10% of the range.
- Close position in the range, measured from the low. A shooting star closes in the bottom part of its range. A hanging man closes in the top part.
- Range versus recent bars. StockCharts adds that a shooting star's high to low range should be relatively large, compared with the range over the last 10-20 days. A long wick on a quiet bar is not the same evidence as a long wick on an unusually wide bar.
- A prior advance you can define. TradingView's built-in pattern detector offers a 50-period simple moving average test (price above the SMA50 counts as an uptrend) or a stricter test that also needs the SMA50 above the SMA200. Pick one rule and write it down before you look for candles.
A five-minute ES sequence with both candles
Definitions are easy to nod along with, so here is one illustrative sequence of five-minute bars on E-mini S&P 500 futures (ES), with round prices chosen to show both candles. Bars 1 to 3 climb 9.75 index points from 6,998.00 to 7,007.75. Bar 4 is a hanging man and bar 5 is a shooting star.
| Bar | What it is | Open | High | Low | Close | Range in points | Body as share of range | Long shadow vs body | Close position from the low |
|---|---|---|---|---|---|---|---|---|---|
| 1 | Up bar in the advance | 6,998.00 | 7,002.75 | 6,997.25 | 7,001.50 | 5.50 | 63.6% | No long shadow | 77.3% |
| 2 | Up bar in the advance | 7,001.50 | 7,006.00 | 7,000.25 | 7,005.25 | 5.75 | 65.2% | No long shadow | 87.0% |
| 3 | Last up bar | 7,005.25 | 7,008.50 | 7,004.00 | 7,007.75 | 4.50 | 55.6% | No long shadow | 83.3% |
| 4 | Hanging man | 7,007.50 | 7,008.00 | 6,999.50 | 7,007.00 | 8.50 | 5.9% | 15.0 times, lower | 88.2% |
| 5 | Shooting star | 7,007.00 | 7,017.25 | 7,006.25 | 7,006.50 | 11.00 | 4.5% | 20.5 times, upper | 2.3% |
Bar 4 opens at 7,007.50, trades down to 6,999.50 and closes at 7,007.00. Its body is 0.50 points, 5.9% of the range, and its lower shadow of 7.50 points is 15.0 times the body. The upper shadow is 0.50 points, 5.9% of the range, so it passes the small-opposite-shadow test.
Bar 5 opens at 7,007.00, runs up to 7,017.25 and closes at 7,006.50. The range is 11.00 points, or 44 ticks, and the upper shadow alone is 10.25 points, 20.5 times the 0.50-point body. On one ES contract at $50 per index point, the upper shadow is worth $512.50 of a $550.00 range. Almost the whole bar, in dollar terms, sits above where it closed.
Both candles also clear the range test against bars 1 to 3, which ran 4.50 to 5.75 points. An 11.00-point shooting star after a run of five-point bars is a real expansion, not an ordinary wick.
Is a Hanging Man or Shooting Star Bullish or Bearish
A hanging man and a shooting star are both bearish, in the sense that both warn that an advance may be losing control. Neither one is bearish in the sense of predicting the next move on its own.
The hanging man is the weaker warning. TradingView's Help Center calls it a weaker signal than its bullish twin, the hammer, because the candle closes near its high, and says most traders treat it as a warning rather than a signal to act on by itself. The same page notes that many hanging man candles appear during strong uptrends and are followed by further gains.
The shooting star carries more information in the candle itself. Buyers reached a new high for the bar and gave almost all of it back before the close, so the close already sits near the low. StockCharts says it can mark a potential trend reversal or a resistance level.
The honest answer, then, depends on what comes next. StockCharts puts it plainly for bearish reversal candles in general: without confirmation, many of these patterns would be considered neutral and merely indicate a potential resistance level at best. A trader who treats either candle as a short entry by itself is acting on a shape, not on evidence.
Hanging Man vs Shooting Star Side by Side

The hanging man vs shooting star comparison comes down to which side of the bar got rejected, and that changes how loud each warning is.
| Feature | Hanging man | Shooting star |
|---|---|---|
| Long shadow | Lower, at least twice the body | Upper, at least twice the body |
| Where the body sits | Top of the range | Bottom of the range |
| What the session showed | Sellers pushed well below the open, buyers recovered the close | Buyers pushed well above the open, sellers took it back |
| Close location | Near the high | Near the low |
| Strength on its own | Weak warning | Stronger warning, still needs follow-through |
| Typical confirmation | Next bar closes below the hanging man body | Next bar closes below the shooting star body |
| Common invalidation | Price trades above the hanging man high | Price trades above the shooting star high |
| Typical stop location | Above the hanging man high | Above the shooting star high |
Two things stand out. First, a hanging man's close is bullish-looking, so it needs more help from the next bar than a shooting star does. Second, the shooting star's stop sits on the far side of the long shadow, which often makes it the more expensive candle to trade. Both points come back when the stops get priced.
The two can also appear on the same chart, even back to back, as in the five-minute sequence. That does not double the signal. It means the advance was rejected on both sides within two bars, and the next bar still has to decide it.
Shooting Star vs Inverted Hammer and Hanging Man vs Hammer
The shooting star vs inverted hammer question confuses more traders than any other part of this topic, because the shapes are identical. StockCharts says the hammer and hanging man are identical candlesticks, and the shooting star and inverted hammer are identical candlesticks. Only preceding price action and further confirmation determine whether each is bullish or bearish.
| Candle | Prior move | Long shadow | Read |
|---|---|---|---|
| Hammer | After a decline | Lower | Possible bullish reversal |
| Hanging man | After an advance | Lower | Possible bearish reversal |
| Inverted hammer | After a decline | Upper | Possible bullish reversal |
| Shooting star | After an advance | Upper | Possible bearish reversal |
So the first step is never the candle. It is the move before it. If you cannot describe the prior move in one sentence, you cannot name the candle, and naming it anyway is how a trader talks themselves into a trade the chart never offered.
What counts as an advance is a judgement call, which is exactly why it should be decided in advance. Price above the 50-period SMA is one rule. Three or more higher closes, or a break above the prior swing high, is another rule some short-term traders use. Any of them works better than deciding after the candle prints.
Related lesson: Hammer and inverted hammer patterns
Does Candle Color Matter for a Shooting Star or Hanging Man
Candle color matters less than the shape and location of a shooting star or hanging man, but it is not meaningless. StockCharts allows either candle to be white or black. TradingView says a hanging man body can be green or red, though a bearish body is often seen as slightly stronger.
The logic is simple. A red hanging man closed below its open, so buyers did not quite finish the recovery. A red shooting star closed below its open after the rejection, so sellers held a little more of the bar. A green body on either candle means the close sat slightly above the open, which softens the message without cancelling it.
An illustrative count of Yahoo Finance daily bars for ES futures from January 4, 2016 to October 30, 2026, using close above the 50-day SMA as the uptrend test, split this way. Of 65 hanging man candles in uptrends, 36 were red and 29 were green. Five sessions later, price was lower after 14 of the red ones (38.9%) and 7 of the green ones (24.1%). That leans the way the references suggest, on a small sample, and it is not a reason to skip a green candle at a strong level or take a red one in the middle of nowhere.
Support and Resistance Context for a Shooting Star
Location separates a shooting star worth watching from one that is just noise. A shooting star in the middle of a range and a shooting star at a level price has already failed at twice are different pieces of information, even if they measure the same.
The context that adds weight is the same for a hanging man:
- A prior high or known resistance. A rejection at a level where sellers showed up before says the level is still doing its job.
- The top of a range. In a sideways market, a long upper wick at the range high is a rejection of the breakout attempt.
- An overbought reading. TradingView lists a pattern near resistance or in overbought conditions, for example on the RSI, as carrying more weight.
- Volume. TradingView notes higher volume on the hanging man suggests the selling was broad. On a thin market, one order can paint a long shadow.
- A wider-than-usual range. The 10-20 bar range test from StockCharts belongs here too, because a wide bar at a level is a bigger event than a normal bar at a level.
What location cannot do is replace the stop. If a shooting star prints just under resistance and price pushes through that resistance on the next bar, the level has failed and so has the candle. Mark the level before the candle forms, and decide in advance what a break of it means.
Related lesson: Support and resistance
Confirmation Rules for Shooting Star and Hanging Man Patterns
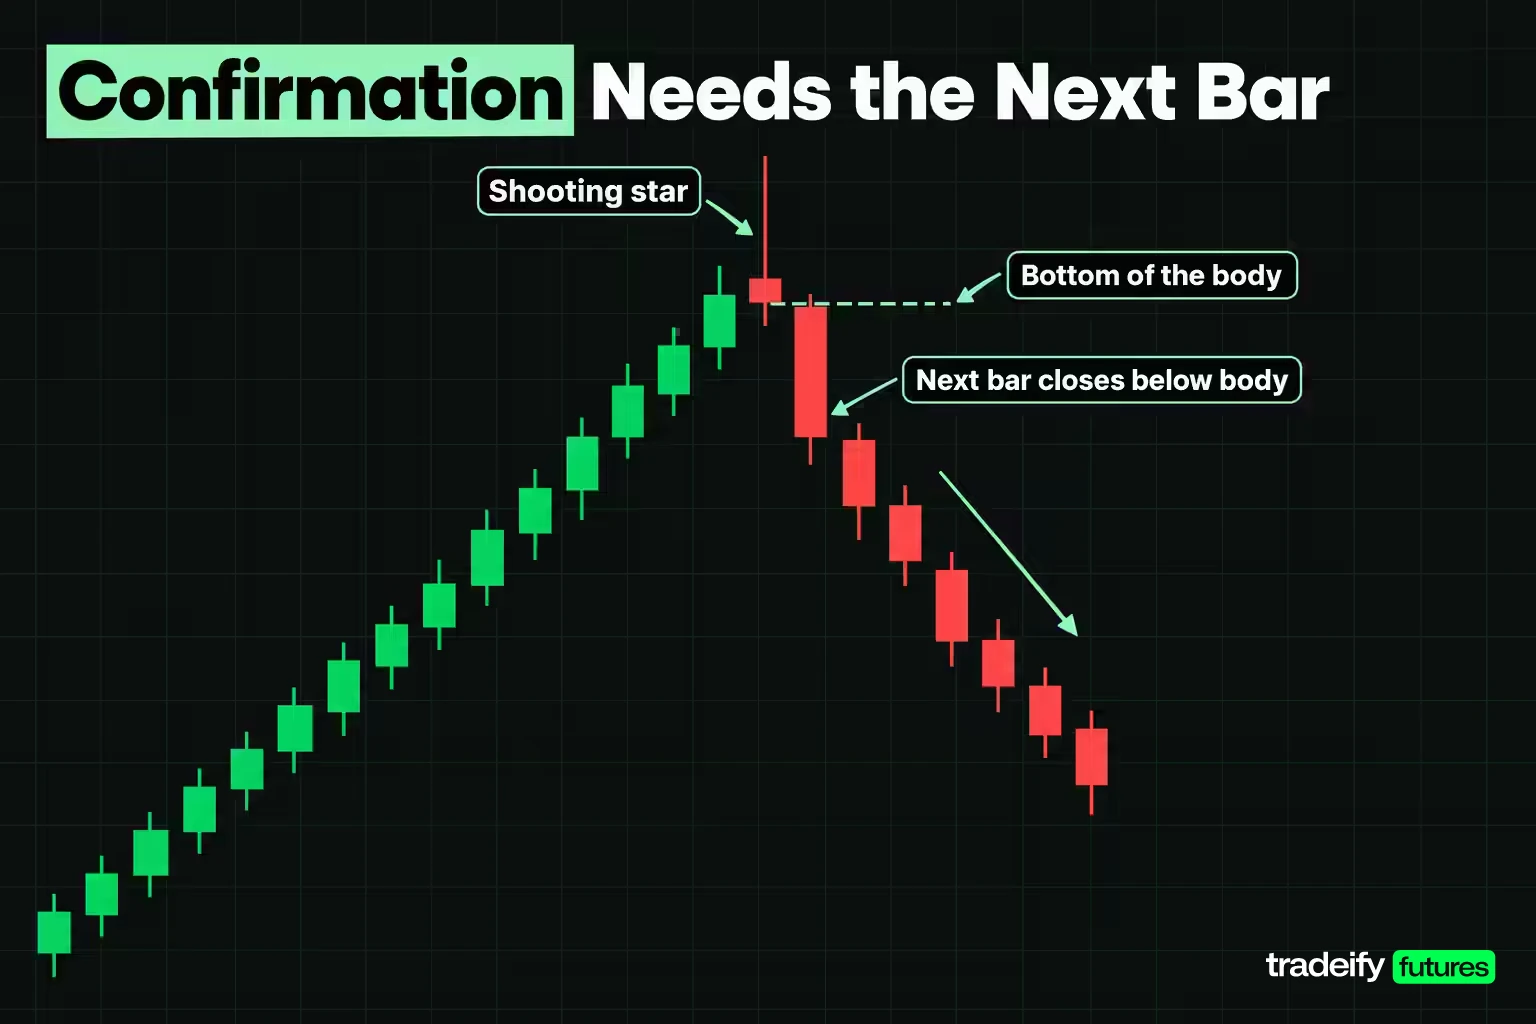
Confirmation for shooting star and hanging man patterns means the market follows through lower after the candle. StockCharts describes bearish confirmation as further downside follow-through, such as a gap down, a long black candlestick or a high-volume decline. TradingView describes it for the hanging man as a bearish candle that closes below the hanging man's body on the next session.
Timing matters too. StockCharts notes that candlestick patterns are short term and usually effective for 1-2 weeks, so bearish confirmation should come within 1-3 days on a daily chart. On an intraday chart, the same idea becomes the next one to three bars. A confirmation that arrives eight bars later is a new move, not confirmation.
In the five-minute ES sequence, bar 6 is the confirmation. It opens at 7,006.50, trades down to 7,000.00 and closes at 7,000.75, below the bodies of both the hanging man and the shooting star, with a 5.75-point body that is 82.1% of its own range.
Notice what confirmation does not require. The close does not have to break the hanging man's low at 6,999.50. A trader waiting for every wick to break would still be waiting while price sat right on the obvious first target.
There is a cost to waiting, and it is worth naming. Every point of confirmation you collect moves your entry further from the stop above the pattern high. Confirmation lowers the chance you are acting on a shape alone, and it raises the price of being wrong. That trade-off is most of the decision with these candles, so settle it before the bar closes rather than in the moment.
Entry, Stop and Target Rules on a Shooting Star Trade
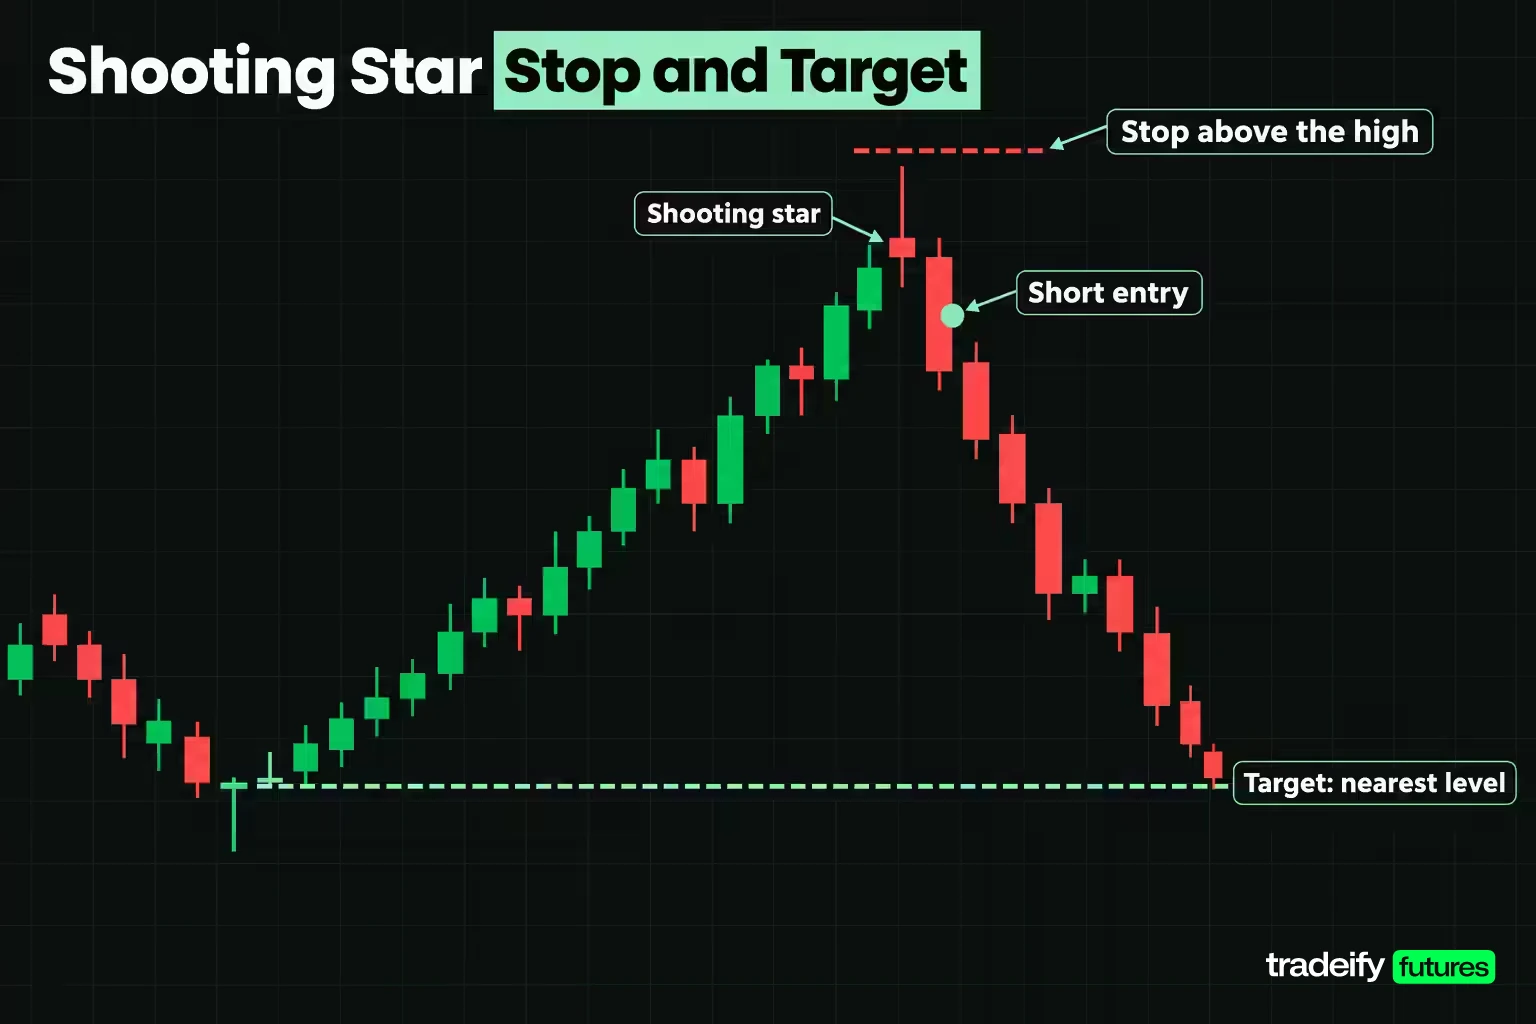
Here is where a shooting star stops being a shape and becomes a cost. ES moves in ticks of 0.25 index points, worth $12.50 each at $50 per point. Micro E-mini S&P 500 futures (MES) are $5 per point, one tenth the size, so the same tick is $1.25.
Take the bearish read after bar 5, sell at bar 6's open of 7,006.50, and target the hanging man's low at 6,999.50, the nearest level the advance would have to break. The reward to the target is 7.00 points, 28 ticks, or $350.00 per ES contract and $35.00 per MES. Now vary only the stop.
| Stop rule with entry 7,006.50 and target 6,999.50 | Stop | Risk in points | Risk in ticks | Risk per ES | Risk per MES | Reward to risk | Break-even win rate | Break-even with $30.00 costs |
|---|---|---|---|---|---|---|---|---|
| One tick above the shooting star high | 7,017.50 | 11.00 | 44 | $550.00 | $55.00 | 0.64 | 61.11% | 64.44% |
| One tick above the hanging man high | 7,008.25 | 1.75 | 7 | $87.50 | $8.75 | 4.00 | 20.00% | 26.86% |
| One tick above the shooting star body | 7,007.25 | 0.75 | 3 | $37.50 | $3.75 | 9.33 | 9.68% | 17.42% |
Why a tighter stop on a shooting star is not automatically better
The stop above the shooting star high is the textbook invalidation, and TradingView suggests the same idea for the hanging man, a stop above its high. Here it risks $550.00 to make $350.00, so the trade needs to win 61.11% of the time just to break even before costs.
The two tighter stops look far better on paper. That is the trap. Both sit inside the shooting star's own upper shadow, a zone price traded through five minutes earlier. A break-even win rate is not the chance of winning. A stop at 7,007.25 risks only $37.50, but it can be hit by ordinary noise without the pattern being wrong, and the realistic win rate for that stop is likely far lower than for one above the high.
The $30.00 cost line is an illustrative assumption for one ES round turn, made up of a $5.00 commission plus two ticks of slippage. Costs move the tight-stop trades the most, because a fixed dollar cost is a large share of a small risk.
Three rules come out of this table:
- Decide the stop rule before the candle completes, because the version picked after the wick forms will be the one that flatters the setup.
- Prefer a stop at a level that actually invalidates the idea, then decide whether the trade is worth taking at that price, rather than shrinking the stop until the numbers look good.
- Size from the stop. A $550.00 risk per ES may be too large for your loss limit, while 2 MES at $110.00 may fit. If nothing fits, the right size is zero.
Related lesson: Position sizing
Trading Strategies That Use Hanging Man and Shooting Star Candles
Most trading strategies built on hanging man and shooting star candles fall into one of four uses. Each starts from a defined prior advance and a written stop.
- Sell a confirmed rejection at resistance. Wait for the candle at a marked level, wait for a close below its body, then sell with the stop above the pattern high. This is the slowest version and usually the most expensive in risk, but it acts on the most evidence.
- Sell the retest. After confirmation, some traders wait for price to bounce back toward the pattern's body or the broken level and sell there. The entry is closer to the stop, so risk is smaller. The cost is that many moves never come back, so some valid signals get missed.
- Use a higher timeframe signal with a lower timeframe entry. A daily shooting star at resistance sets the bias for the next session, and the entry comes from a smaller pattern or a break on a five-minute chart. This keeps the stop sized to the intraday structure instead of the full daily wick.
- Treat the candle as an exit signal on an existing long. For many traders the most useful job of a hanging man is not opening a short. It is tightening the stop on a long, taking partial profit, or declining to add after a run.
There is also the failed-pattern read. A break above the shooting star's high means the rejection was rejected. That is information, but it is not automatically a buy signal, because the stop on any long sits back below a bar that just showed heavy selling. Treat a failed pattern as a reason to stand aside from the short, and look for a separate long setup with its own rules.
Doing nothing is a valid outcome for every one of these. If the candle prints mid-range, without a defined advance, or with a stop you cannot afford, there is no trade, however clean the wick looks.
Related lesson: Multiple timeframe analysis
Real Shooting Star and Hanging Man Examples on ES Futures
Real shooting star and hanging man examples are messier than textbook drawings, which is the point of looking at them. The two candles here come from Yahoo Finance's daily bars for the continuous front-month E-mini S&P 500 contract (symbol ES=F). They are historical illustrations, not trade recommendations, and one example of anything is not evidence.
A confirmed hanging man on January 29, 2026
ES had been rising, closing above its 50-day SMA, and printed a high of 7,043.00 on January 28, 2026. On January 29 it opened at 7,021.50, traded up to 7,029.50, fell to 6,898.25 and closed at 6,992.75.
- The range was 131.25 points, about 1.97 times the average of the prior 20 sessions (66.58 points).
- The red body was 28.75 points, 21.9% of the range.
- The lower shadow was 94.50 points, about 3.3 times the body, and the upper shadow was 8.00 points, 6.1% of the range.
The next session, January 30, closed at 6,965.75, below the hanging man's body. That is confirmation. A stop one tick above the pattern high, at 7,029.75, would have sat 64.00 points (256 ticks) above that close, $3,200.00 per ES or $320.00 per MES. On February 3 the high reached 7,027.25, just 2.50 points short of that stop, before price continued lower. On February 5, five sessions after the hanging man, ES closed at 6,820.75, 2.46% below the hanging man's close.
This one did what the textbook says, and it was still uncomfortable to hold. The daily-chart stop was large, and price came within ten ticks of it before the move went anywhere. A trader who had moved the stop tighter to feel better would have been taken out at the worst moment.
A confirmed shooting star that failed on August 5, 2026
On August 4, 2026, ES ran to a high of 7,786.00. On August 5 it opened at 7,772.00, traded up to 7,820.25, fell to 7,745.75 and closed at 7,749.50.
- The body was 22.50 points, 30.2% of the range, close to the one-third limit.
- The upper shadow was 48.25 points, about 2.1 times the body, and the lower shadow was 3.75 points, 5.0% of the range.
- The range was 74.50 points, about 0.77 times the average of the prior 20 sessions (97.25 points).
August 6 closed at 7,734.75, below the body, so the candle confirmed. A stop one tick above the high, at 7,820.50, would have sat 85.75 points away (343 ticks), $4,287.50 per ES or $428.75 per MES. Price drifted sideways for five sessions, then traded through the shooting star's high on August 13 and closed at 7,822.50.
The shape passed, confirmation arrived, and the short still failed. This shooting star's own measurements explain why it was weak: the body was near the one-third limit, the shadow barely cleared two times, and the range was smaller than usual, the exact condition StockCharts flags when it asks for a range that is large relative to the last 10-20 days. A candle that only just qualifies on every test is a weak candle.
How Reliable Shooting Star and Hanging Man Candles Are
How reliable shooting star and hanging man candles are has two answers: what a simple count on a market you might trade shows, and what academic tests on larger samples found. Neither is flattering for the shape alone.
Ten years of ES daily bars
This illustrative count used 2,724 daily bars of ES=F from Yahoo Finance, January 4, 2016 to October 30, 2026. The rules were fixed before counting:
- Uptrend. Close above the 50-day SMA, TradingView's simpler trend test. That left 1,956 uptrend days with five sessions of data after them.
- Shape. Body no more than one third of the range, long shadow at least twice the body, opposite shadow no more than 10% of the range, and a body larger than zero.
- Confirmation. The next session closes below the pattern's body.
- Outcome. Whether the close five sessions later was lower than the starting close.
| Measure | Hanging man | Shooting star | All uptrend days |
|---|---|---|---|
| Candles found | 65 | 24 | 1,956 days |
| Per 100 uptrend days | 3.32 | 1.23 | Not applicable |
| Lower five sessions later | 32.3% | 29.2% | 39.0% |
| Share that confirmed | 35.4% | 29.2% | Not applicable |
| Confirmed, lower five sessions after the confirmation close | 47.8% (11 of 23) | 14.3% (1 of 7) | Not applicable |
| Not confirmed, lower five sessions later | 14.3% (6 of 42) | 35.3% (6 of 17) | Not applicable |
Three things stand out in this Yahoo Finance ES count. Both candles are uncommon on ES daily bars under strict rules, roughly one hanging man every 30 uptrend days and fewer shooting stars. Unconfirmed, the hanging man was followed by a lower close far less often than an average uptrend day, so on this sample the shape alone pointed the wrong way. Confirmed hanging men did better than the 39.0% base rate, at 47.8%, but 23 cases is a small sample and the difference was not tested for significance.
The shooting star sample, 24 candles and 7 confirmations, is too small to say anything useful. The period was also a strong rising market for ES, which works against any bearish signal. A different market, timeframe or rule set can give different numbers, which is the reason to run your own count.
What published studies found
The research on single candles is mostly negative. Marshall, Young and Rose, in the Journal of Banking and Finance in 2006, extended the bootstrap method to generate random open, high, low and close prices and found that candlestick trading strategies did not have value for Dow Jones Industrial Average stocks over 1992 to 2002. A later study by Marshall and colleagues found candlestick strategies were not profitable in the Japanese equity market over 1975 to 2004.
On intraday futures, Fock, Klein and Zwergel, in the Journal of Derivatives in 2005, found candlestick analysis was not profitable on intraday German futures data. Duvinage, Mazza and Petitjean, in Quantitative Finance in 2013, tested five-minute candlestick rules on 30 Dow Jones Industrial Average stocks and found that after costs and a correction for data snooping, no single rule beat buy-and-hold.
The white shooting star results from Tharavanij, Siraprapasiri and Rajchamaha (SAGE Open, 2017) are a useful warning. On SET50 stocks in Thailand from July 3, 2006 to June 30, 2016, they counted 2,812 white shooting star signals. A short sale after the signal was profitable only about 43% of the time at the one-day horizon, and the average return over ten days was positive, 0.94%, meaning prices on average kept rising.
None of this proves the candles are useless once context, location and a risk rule surround them. It does say the shape alone has not carried a measurable edge in the samples tested, and that anyone selling a high win rate for either candle should be asked for the sample.
Related lesson: How to keep a trading journal
Pros and Cons of Trading a Hanging Man or Shooting Star
The case for and against trading a hanging man or shooting star is mostly about what the candle can and cannot tell you.
Advantages
- Easy to see and measure. One bar, four prices, and a few ratios decide whether it qualifies.
- A built-in invalidation point. The pattern high gives a clear place where the idea is wrong.
- Works on any timeframe and market with open, high, low and close data. The same rules apply to five-minute ES bars or daily crude oil bars.
- Useful for managing longs. A confirmed rejection at a level is a reasonable trigger to tighten a stop or take partial profit.
- Encourages patience. A rule that needs confirmation forces a trader to wait one more bar instead of guessing the top.
Disadvantages
- Weak on its own. Published tests and the ES count both show the shape alone has not been reliable.
- Expensive stops. The stop above a shooting star high often sits far from the entry, which can push the break-even win rate above 60%.
- Late entries. Waiting for confirmation moves the entry further from the stop.
- Easy to see after the fact. Once the outcome is known, every small body with a long wick looks like the pattern.
- No measured target. The candle gives a place to be wrong, not a place to take profit, so targets come from nearby levels.
- Rare under strict rules. Loose rules find many more candles, mostly noise.
A Pre-Trade Routine for Trading a Shooting Star or Hanging Man
Before trading a shooting star or hanging man, use the same six steps in the same order every time, so the candle cannot talk you into skipping one.
- Describe the prior advance in one sentence using your written trend rule. If it does not qualify, stop.
- Measure the body share, the long shadow against the body, the opposite shadow and the close position, and write the figures down.
- Compare the bar's range with the average of the last 10 to 20 bars.
- Mark the location: the prior high, resistance level or range top behind the candle.
- Write the confirmation and invalidation conditions before the next bar opens.
- Convert the stop distance into ticks and dollars, then decide whether any size fits your loss limit.
Of those six steps, only one is about the candle itself. The other five are what keep a nice-looking wick from turning into an expensive guess.
On our accounts, all positions are closed by 4:45 PM ET on regular trading days and there are no overnight or swing holds, so a daily shooting star or hanging man is context for the next session's intraday decisions rather than a multi-day short. WealthCharts, one of our supported platforms, has Chart Replay for practicing these reads on historical data, and our funded accounts are simulated.
Shooting Star and Hanging Man FAQ
Is the hanging man pattern bullish or bearish?
It is bearish, but it is a weak warning. The candle closes near its high, so buyers still won the session, yet sellers pushed well lower inside an uptrend. Most references treat it as a warning that needs a lower close on the next bar.
What does a shooting star candlestick pattern indicate?
It indicates that buyers pushed price to a new high for the bar and sellers took nearly all of it back before the close. After an advance, that is a possible bearish reversal or a resistance marker. It needs follow-through on the next bar before it means much.
What does a hanging man candlestick pattern mean?
It means the bar opened, traded well below the open and closed back near the high, after a rise. That shows selling pressure appearing in an uptrend, not winning yet. It means more at a level price has already struggled with.
What is the difference between a hanging man and a shooting star?
The long shadow is on opposite sides. A shooting star has a long upper shadow and closes near its low, while a hanging man has a long lower shadow and closes near its high. Both need an advance before them and confirmation after them.
Can a shooting star close green?
Yes. Both StockCharts and TradingView allow either body color. A red body is often read as slightly stronger, because the close sits below the open.
What is the most powerful bullish candlestick pattern?
No single bullish pattern has proven reliable across markets. A 2022 study by Deng and colleagues on Chinese SSE50 stocks found Long White and Bullish Gap patterns produced significant positive average returns over some holding periods. Results like that depend on the market, the period and the rules, so test any pattern on your own data.
Shooting Star and Hanging Man Trading Risk
This article is education, not advice, and nothing in it recommends buying or selling any instrument. Futures are leveraged, and losses can exceed what you expect or the amount you planned to risk. The five-minute bars and cost figures are illustrative, the 2026 examples are historical and not trading results, and the ES count is a small study that says nothing about future results. Funded and evaluation accounts are simulated, and simulated results do not predict live trading outcomes.


