



TL;DR: Value at risk is the loss a position should beat on a stated share of days, such as 99 sessions in 100. It sets a line but says nothing about how far past it the bad day goes. On 20 years of eight futures markets, a rolling 99% VaR was breached 1.57% of the time, not 1%. Pair it with expected shortfall and a hard account limit before using it to size trades.
Value at risk (VaR) puts a dollar figure on a question every trader carries into the open: how bad can a normal bad day get? It answers with one number tied to a confidence level and a time horizon, and that is both its strength and its trap: a single clean figure tempts you to treat it as a ceiling and size right up to it. This guide explains how VaR is calculated, then tests it on 20 years of daily data from eight liquid futures markets, so you can see where the number holds and where it quietly fails.
Related lesson: Risk management for traders
What Value at Risk Measures
Value at risk is a loss threshold. Pick a confidence level and a horizon, and VaR returns the loss that the position should not exceed on that share of periods. A one-day 99% VaR of $6,858 on one E-mini S&P 500 (ES) contract means that on 99 days out of 100 the loss should be smaller than $6,858, and on roughly one day in 100 it should be larger.
That $6,858 is a real measurement, not a made-up example. The ES settled at 7,720.50 on November 4, 2026. At $50 per index point, one contract controlled $386,025 of index exposure. Over the 250 sessions ending that day, the 99th-percentile daily loss was 1.78%, and 1.78% of $386,025 is about $6,858.
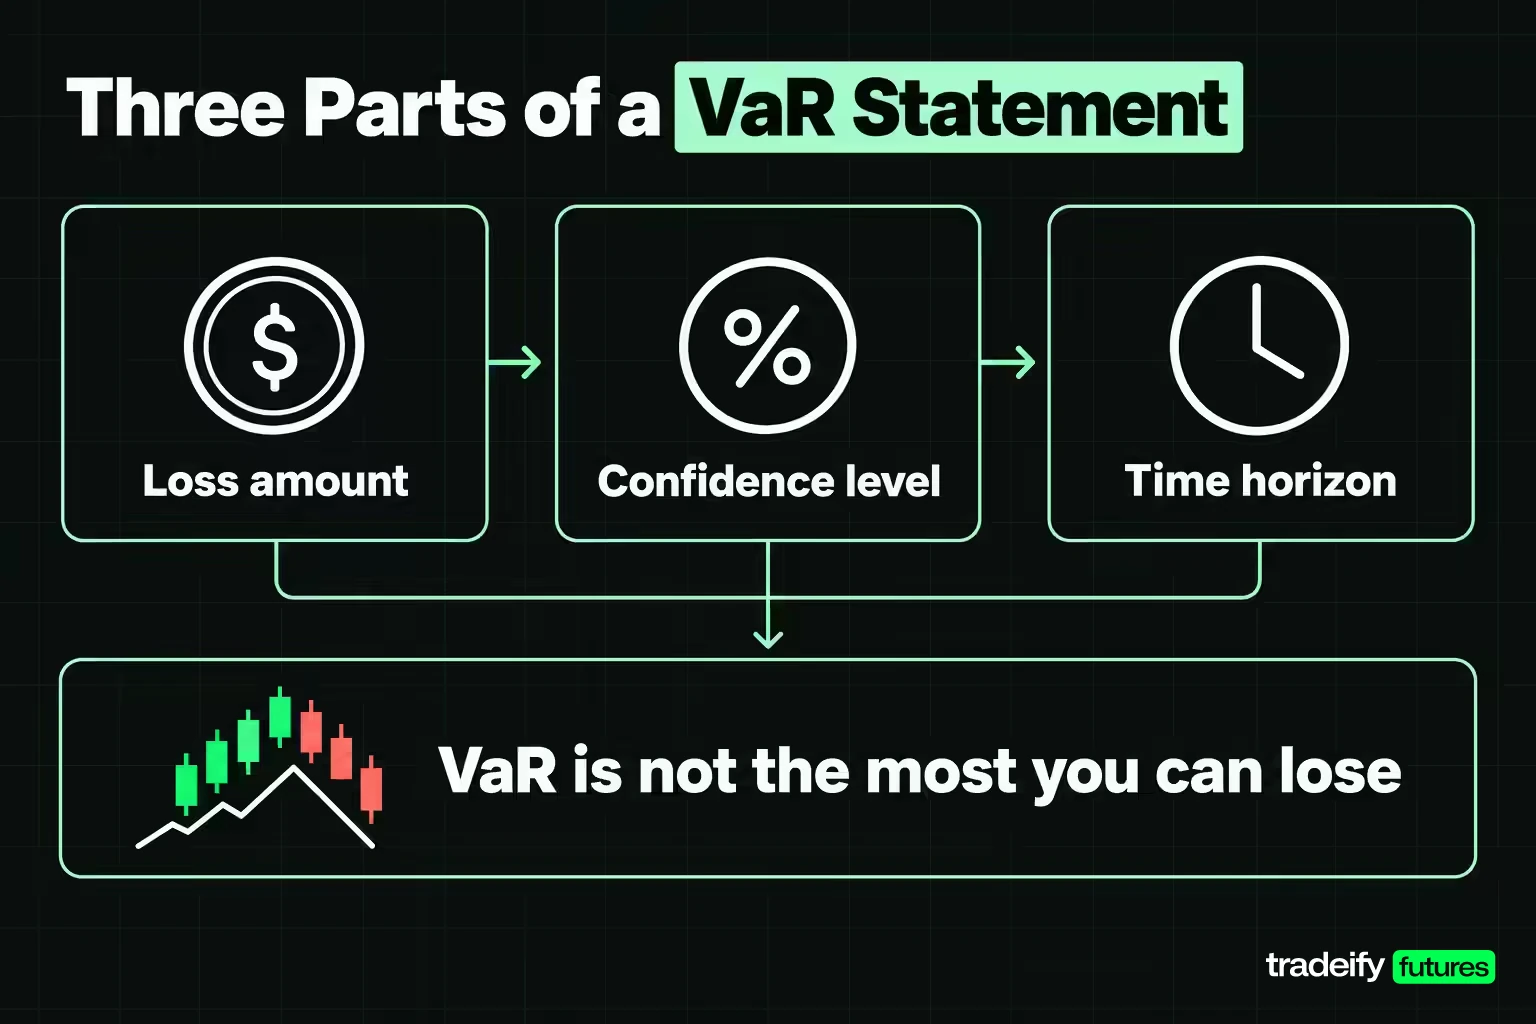
Three parts make up every VaR statement, and a number missing any of them is not a measurement:
- The loss amount, in dollars or percent of the position.
- The confidence level, usually 95% or 99%.
- The horizon, usually one day for traders and ten days in bank regulation.
What VaR does not tell you matters just as much. It is not the most you can lose. It is the edge of the normal range, and the one day in 100 that crosses it can cross it by a little or by a lot. A trader who reads "99% VaR of $6,858" as "I can lose at most $6,858" has misread the number in the most expensive possible way.
Confidence Level and Time Horizon in VaR
The confidence level sets how far into the tail the VaR line sits. A 95% VaR is the loss you expect to exceed on 1 day in 20. A 99% VaR is the loss you expect to exceed on 1 day in 100, which works out to about 2.5 breach days in a 250-session trading year. The higher the confidence, the larger the number and the rarer the breach.
Under a normal distribution the jump from 95% to 99% is fixed. The 95% cutoff sits 1.645 standard deviations below the mean and the 99% cutoff sits 2.326 standard deviations below it, so a normal 99% figure is about 41% larger than the 95% figure on the same data. Real futures returns have fatter tails, so the measured gap is usually wider than that.
Neither level is "correct". A 95% VaR is easier to backtest because breaches come often enough to count in a few months. A 99% VaR describes the tail better but needs years of data before the breach count means anything. Many desks track both.
Choosing the VaR time horizon
The horizon is the holding period the loss is measured over. A day trader who is flat every night cares about one day. A fund that cannot exit a position for two weeks cares about ten days. The 1996 Basel market risk amendment set ten trading days at the 99th percentile for bank capital, which is why "10-day 99% VaR" shows up so often in bank reports.
The usual shortcut converts a one-day VaR into a longer one by multiplying by the square root of the number of days. Ten days becomes one-day VaR times 3.16. The shortcut assumes each day's return is independent of the last and drawn from the same distribution.
Testing the square root of time rule on futures
The square root of time rule can be tested against real futures data. Using 20 years of Yahoo Finance daily closes for eight futures markets (November 2006 to November 2026), the 99% loss over overlapping 10-session windows was compared with the one-day 99% VaR scaled by the square root of 10.
| Market | 10-day measured vs scaled ratio |
|---|---|
| E-mini S&P 500 | 0.92 |
| E-mini Nasdaq-100 | 0.83 |
| 10-Year T-Note | 0.90 |
| Euro FX | 1.02 |
| WTI Crude Oil | 0.87 |
| Gold | 0.91 |
| Silver | 0.84 |
| Copper | 1.00 |
A ratio under 1 means the shortcut overstated the 10-day loss. It did so on 6 of the 8 markets, with a median ratio of 0.90. For ES, the scaled 10-day figure was 11.50% against a measured 10.62%. Big down days in stock index futures are often followed by partial rebounds, so losses do not stack the way the formula assumes.
Overstating risk sounds harmless, but it cuts both ways. Euro FX and copper came in at or above 1.00, so the shortcut was not conservative there. Use the scaled figure as a sanity check and measure the longer horizon directly when it drives a real limit.
Three Ways to Calculate VaR
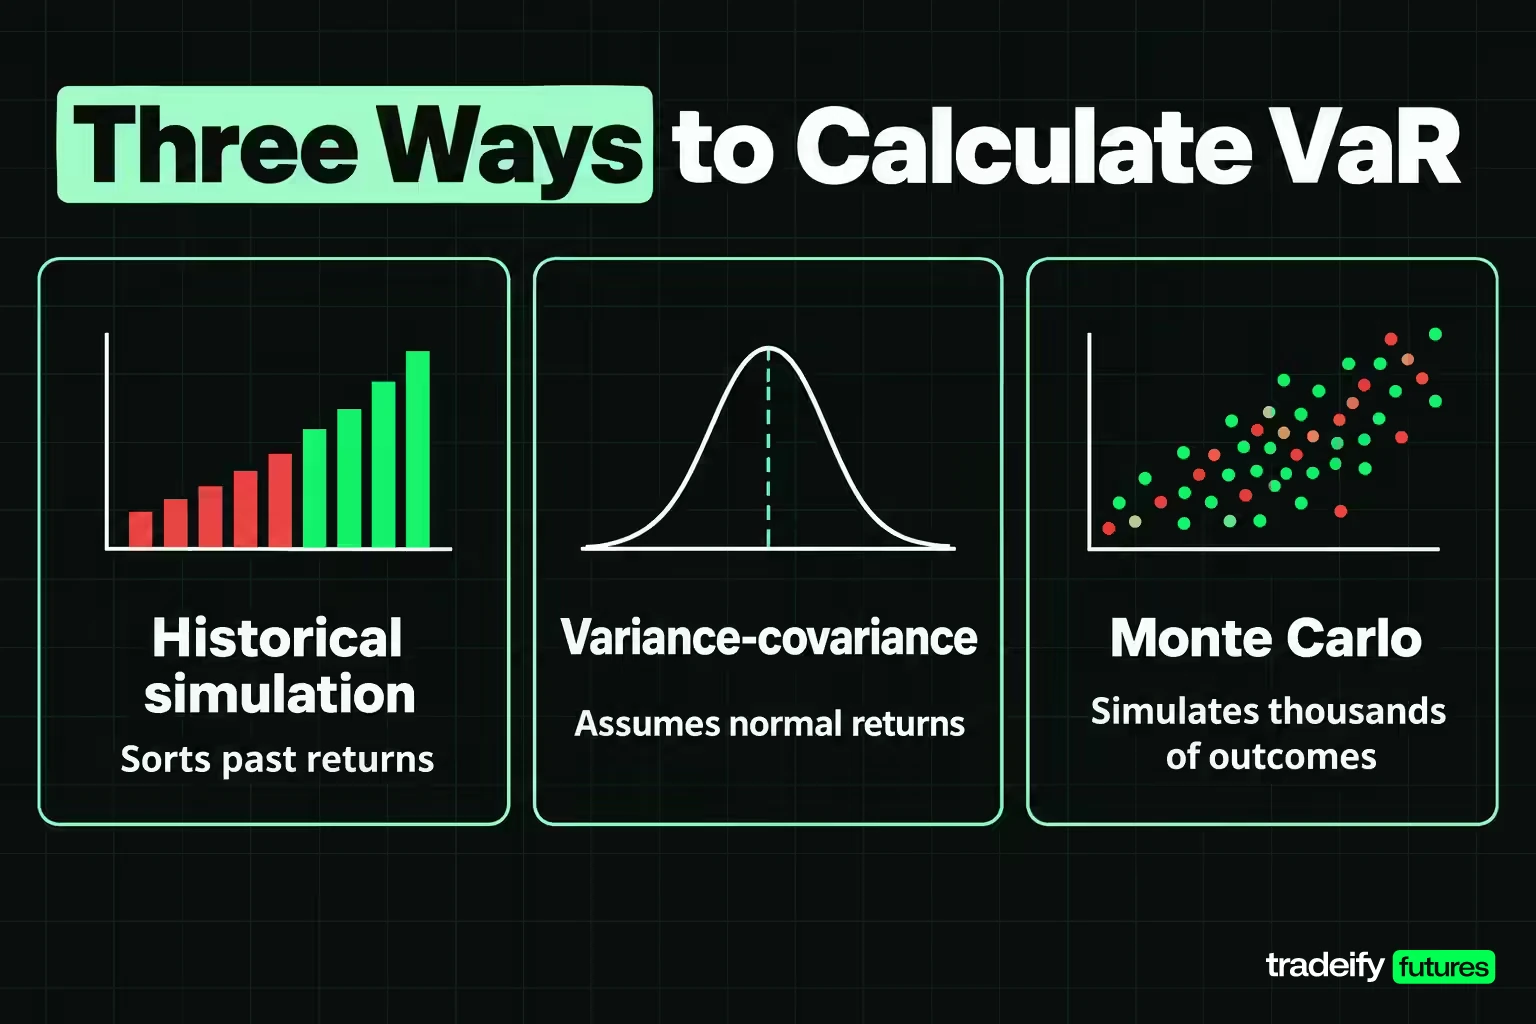
Every VaR figure comes from one of three methods. They answer the same question with different assumptions, and on the same data they give different answers.
Historical simulation VaR sorts a window of past returns from worst to best and reads off the loss at the chosen percentile. With 250 sessions, the 99% VaR sits between the third and fourth worst day. It makes no assumption about the shape of the distribution, which is its main appeal. Its weakness is that it can only see losses that already happened inside the window.
Variance-covariance VaR (also called parametric or delta-normal VaR) multiplies the standard deviation of returns by 1.645 for 95% or 2.326 for 99%. It is fast, needs only a mean, a volatility and correlations, and adds up neatly across a portfolio. It assumes returns are normally distributed, and futures returns are not.
Monte Carlo VaR generates thousands of possible outcomes from an assumed model, then reads the percentile from the simulated results. It can handle options, non-linear positions and fat-tailed distributions, but the answer is only as good as the model you feed it.
How Monte Carlo VaR works
Monte Carlo VaR replaces the historical window with a model of how returns behave, then lets a computer play out that model thousands of times. The steps are the same whatever the position:
- Choose a return model. A normal distribution is the simplest choice. A Student t distribution adds fat tails, and models such as GARCH let volatility change over time.
- Estimate its parameters. Fit volatility, correlations and tail thickness from recent data.
- Simulate outcomes. Draw tens of thousands of possible next-day returns, or full price paths for longer horizons.
- Revalue the position. Apply each simulated move to the actual position, which is where Monte Carlo VaR handles options and other non-linear payoffs that the parametric method cannot.
- Read the percentile. Sort the simulated losses and take the 95th or 99th percentile, just as historical simulation does with real days.
The model is the whole answer. Run on the same 250 ES sessions with 100,000 normal draws, Monte Carlo VaR gave a 99% figure of 1.89%, which is essentially the parametric result. Switching to a fat-tailed Student t raised it to 2.01%. Same data, same simulation count, and the only change was the assumed shape of the tail. More simulations shrink the random noise in the estimate, but no number of draws fixes a wrong model.
The three VaR methods on the same 250 ES sessions
Here are all three run on the 250 E-mini S&P 500 sessions from November 6, 2025 to November 4, 2026, priced on one contract at $386,025 of notional. The Monte Carlo run drew 100,000 outcomes from a Student t distribution with 10.6 degrees of freedom, matched to the window's volatility and fat tails.
| VaR method | 95% one day | 99% one day | 99% dollars on one ES |
|---|---|---|---|
| Historical simulation | 1.36% | 1.78% | $6,858 |
| Variance-covariance | 1.34% | 1.89% | $7,299 |
| Monte Carlo, Student t | 1.32% | 2.01% | $7,743 |
At 95% the three methods sit within a few hundredths of a percent of each other. At 99% they spread out by close to $900 on a single contract. That pattern repeats across markets: the middle of the tail is easy to agree on, and the edge is where model choice starts to matter.
| VaR method | Main assumption | Best use | Main weakness |
|---|---|---|---|
| Historical simulation | The window repeats | Simple positions with long clean data | Blind to anything the window missed |
| Variance-covariance | Normal returns | Fast portfolio aggregation | Understates fat tails |
| Monte Carlo | Your model is right | Options and non-linear books | Model risk and computing time |
A Worked VaR Example on 20 E-mini Sessions
A small example shows how a VaR figure is built, and why a short window gives a shaky one. Take the 20 ES sessions from October 8 to November 4, 2026. Ten were down days. The four worst were:
- October 30, 2026, down 1.81%
- October 22, 2026, down 1.23%
- October 16, 2026, down 1.11%
- October 14, 2026, down 1.09%
Historical route. Sort the 20 losses. A spreadsheet percentile function interpolates the 95% VaR between the worst and second-worst day, giving 1.26%, or $4,851 on $386,025 of notional. The 99% figure lands at 1.70%, or $6,556, almost on top of the single worst day.
Parametric route. The standard deviation of the 20 returns was 0.82%. Multiply by 1.645 for a 95% VaR of 1.34% ($5,181), or by 2.326 for a 99% VaR of 1.90% ($7,328).
Now the problem. With 20 observations, each session is 5% of the window, so the 95% line depends on just two days and the 99% line is really the worst day in disguise. One quiet or violent session entering or leaving the window can move the figure by hundreds of dollars. The parametric 99% VaR of $7,328 sits above the worst loss in the sample, which looks prudent but is only the normal curve projecting past data it never saw.
The practical rule from this example is a floor on the VaR window. Use at least 250 sessions for a 99% figure, and say which confidence levels your sample can honestly support.
VaR Assumptions, Data and Volatility Estimation
Each VaR method rests on assumptions that are easy to forget once the number is on a screen. The main ones are below.
- The past window represents tomorrow. Historical VaR assumes the next day is drawn from the same pool as the last 250. When volatility shifts, the figure lags.
- Returns are roughly normal. Variance-covariance VaR depends on this. Over 20 years, ES daily returns had an excess kurtosis of 14.5 (a normal distribution scores 0), so extreme days were far more common than the bell curve allows.
- Prices are clean. Bad ticks, roll gaps between contract months and missing sessions all distort the result.
- Positions are static over the horizon. VaR assumes you hold through the period. A day trader who cuts a loss intraday faces a different loss profile than the closing price suggests.
- The position can be exited at the marked price. VaR on settlement prices ignores slippage in a fast market.
The fat-tail point shows up directly in the numbers. Over the full 20 years, the historical 99% VaR was larger than the parametric 99% VaR on 7 of the 8 markets. For ES it was 3.64% against 2.89%, so the normal assumption understated the one-in-100 day by about a fifth.
Negative prices and the crude oil case
On April 20, 2020, the front-month WTI crude oil contract settled at negative $37.63 after closing at $18.27 the session before. The next day it closed at $10.01. No return-based model was built for a price below zero.
Those two sessions show how differently the methods absorb a shock. Including them, crude oil's daily standard deviation over 20 years was 5.42% and its parametric 99% VaR was 12.60%. Excluding just those two days, the standard deviation fell 49.5% to 2.73% and the parametric VaR fell to 6.36%. The historical 99% VaR barely moved, from 7.414% to 7.407%. One session was carrying half of the parametric estimate, while the historical method treated it as one data point among 5,015.
Volatility estimation for VaR
The parametric method needs a volatility estimate, and how you weight the past changes the answer. An equal-weighted standard deviation gives a session from 11 months ago the same weight as yesterday. An exponentially weighted moving average (EWMA) gives recent days more weight. The RiskMetrics technical document from J.P. Morgan and Reuters used a decay factor of 0.94 for daily data, which puts about 99% of the weight on the last 74 sessions.
In a rolling 250-session backtest on the eight futures markets in this guide (38,120 test days), a normal VaR on EWMA volatility was breached on 2.04% of days at the 99% level, against 2.09% for equal-weighted volatility. Faster volatility helped slightly, but neither version fixed the fat tails, because the problem was the normal curve and not just the volatility input.
Related lesson: What is volatility
One-Day Value at Risk on Eight Futures Markets
The same calculation across eight markets shows that the instrument changes VaR far more than the method does. The first three columns use all 5,015 daily returns from November 2006 to November 2026. The last two use the 250 sessions ending November 4, 2026, priced on one contract at that day's close.
| Market | 20-year 95% VaR | 20-year 99% VaR | Parametric 99% VaR | Last-250 99% VaR | One contract 99% VaR |
|---|---|---|---|---|---|
| E-mini S&P 500 | 1.81% | 3.64% | 2.89% | 1.78% | $6,858 |
| E-mini Nasdaq-100 | 2.21% | 4.04% | 3.28% | 3.06% | $17,457 |
| 10-Year T-Note | 0.62% | 1.02% | 0.88% | 0.65% | $697 |
| Euro FX | 0.89% | 1.50% | 1.30% | 0.82% | $1,155 |
| WTI Crude Oil | 3.90% | 7.41% | 12.60% | 10.92% | $9,620 |
| Gold | 1.81% | 3.14% | 2.70% | 4.24% | $17,256 |
| Silver | 3.36% | 6.47% | 5.09% | 9.24% | $24,092 |
| Copper | 2.63% | 4.73% | 4.02% | 4.65% | $7,445 |
Three things stand out in this VaR table.
First, the spread between markets is enormous. One silver contract carried a one-day 99% VaR of $24,092, about 35 times the $697 on one 10-Year T-Note. Comparing "one contract" across markets without VaR or a similar measure is comparing very different bets.
Second, the recent window and the long window disagree. ES ran a last-250 99% VaR of 1.78%, about half its 20-year figure of 3.64%, because the past year was calmer than the 20-year average that includes 2008 and 2020. Gold and silver went the other way: their recent figures are well above their long-run averages. Neither window is "true". The short one reacts, the long one remembers.
Third, crude oil is the only market where the parametric figure sits above the historical one, and that comes from the two April 2020 sessions around the negative settlement, which inflate the standard deviation. Everywhere else the normal curve came in under the historical tail.
Backtesting VaR Against 38,120 Market Days
A VaR model is only as good as its breach count. This guide ran that test on Yahoo Finance daily closes for eight futures markets from November 2006 to November 2026. The honest test is to roll the model forward: on each day, compute VaR from the previous 250 sessions only, then check whether the next day's loss went past the line. Over 20 years that gives 4,765 test days per market and 38,120 across all eight.
| VaR model | Nominal breach rate | Actual breach rate |
|---|---|---|
| Historical 95% | 5% | 5.48% |
| Historical 99% | 1% | 1.57% |
| Normal 95% | 5% | 5.24% |
| Normal 99% | 1% | 2.09% |
| EWMA normal 99% | 1% | 2.04% |
The 95% models were close to their label. The 99% models were not. The historical 99% VaR was breached 1.57% of the time, roughly one day in 64 instead of one in 100. The normal 99% VaR was breached 2.09% of the time, about one day in 48, more than twice the advertised rate.
The miss was consistent across markets. The historical 99% breach rate ranged from 1.34% on the 10-Year T-Note to 1.72% on the E-mini S&P 500, and no market came in at or under 1%. The normal version ranged from 1.72% on copper to 2.60% on ES.
None of this makes VaR useless. It means the confidence label describes the model, not the market. A "99% VaR" that breaches 1.57% of days behaves more like a 98.4% VaR, and you should size as if that is what you have. If a single month has ever handed you three days your model called one-in-100 events, the backtest explains why that is not as rare as the label suggests.
Tail Losses Beyond the VaR Line
The question VaR leaves out is how bad the bad day gets once the line breaks. In this guide's 20-year rolling backtest on Yahoo Finance daily data, the historical 99% model produced 597 breaches across eight futures markets, and they tell a two-part story.
Most breaches were modest. The median breach loss was 1.21 times the VaR line, and the average was 1.40 times. That is exactly why a trader can run VaR for months and come to trust it.
The tail of the breaches is where accounts get hurt. About 6.9% of breaches, roughly 1 in 15, were more than twice the VaR line. The largest breaches were:
- WTI crude oil, April 20, 2020: a loss 28.7 times the 99% VaR line, on the negative settlement.
- Copper, July 31, 2025: a 22.3% one-day loss, 4.4 times the line.
- WTI crude oil, March 9, 2020: 4.3 times the line.
- Silver, January 30, 2026: a 31.3% one-day loss, 3.7 times the line.
- Gold, April 15, 2013: 3.6 times the line.
VaR breaches cluster
VaR assumes each day is a fresh draw, so a 1% breach rate implies breaches spread out evenly. They do not. In this guide's own 20-year backtest on Yahoo Finance daily futures data, the share of 99% breaches that landed within five sessions of another breach in the same market ranged from 23.4% on the 10-Year T-Note to 51.4% on silver, with ES at 51.2%. When one tail day arrives, the next is often close behind. A risk plan that sizes the second loss in a cluster as if it were another one-in-100 event is undersizing the danger.
Expected shortfall as the tail average
Expected shortfall (also called conditional VaR) answers the question VaR skips: when the loss goes past the line, what is the average loss? Over 20 years, the 99% expected shortfall ran from 1.22 times the VaR on Euro FX to 1.47 times on the E-mini S&P 500, and 2.16 times on crude oil because of April 2020. For ES that meant a 99% VaR of 3.64% but an average tail day of 5.36%.
A workable rule from this data is that the average loss past the VaR line is at least 20% larger than the VaR figure, and in a fat-tailed market it can be far larger.
Related lesson: Tail risk and black swan events
Limitations of Value at Risk
Value at risk is widely criticized, and most of the criticism holds up when VaR is tested on 20 years of futures data. The main limitations are these.
- It is silent about tail size. VaR marks where the bad days start, not how bad they get. Two positions with the same VaR can have very different worst days.
- The model choice moves the answer. On the same 38,120 test days, switching from historical to normal 99% VaR raised the breach rate from 1.57% to 2.09%. The market did not change; the method did.
- It depends on the window. ES historical 95% VaR was 1.81% over 20 years and 1.36% over the last 250 sessions. A calm year produces a small number right before volatility returns.
- It is not always subadditive. In some portfolios, the VaR of two positions combined can exceed the sum of their separate VaRs, which breaks the basic logic that diversification should not add risk. Expected shortfall does not have this flaw, which is one reason regulators moved toward it.
- It can create false comfort. A single clean number invites a trader to size up to it. The breach data shows the line is crossed more often, and by more, than the label implies.
- It ignores liquidity and exit. VaR on closing prices assumes you can get out at the mark. In a gap or a limit move you may not.
None of these is a reason to drop VaR. They are reasons to treat it as the first risk number you look at, never the last.
Portfolio VaR and Diversification
Portfolio VaR measures the loss threshold for a whole book of positions rather than one. The same idea scales up to firm-wide VaR at a bank, where every desk's VaR is combined into one figure for the institution. The combined number is usually smaller than the sum of the parts, because positions do not all lose on the same day.
How much smaller depends on correlation. The table below uses the dollar change on one contract of each market over the 250 sessions ending November 4, 2026, and compares the sum of the standalone 99% VaRs with the 99% VaR of the combined position.
| Portfolio | Sum of standalone 99% VaR | Combined 99% VaR | Combined as share of sum |
|---|---|---|---|
| ES plus NQ | $24,962 | $23,541 | 94% |
| ES plus 10-Year T-Note | $7,123 | $6,533 | 92% |
| ES plus Gold | $26,283 | $23,697 | 90% |
| ES, T-Note, Gold and Euro FX | $28,189 | $25,102 | 89% |
ES and NQ had a 0.91 correlation over that window, and holding both saved only 6% of the standalone VaR. At the 95% level the saving all but disappeared: $15,953 standalone against $15,933 combined. Two stock index contracts are close to one larger position.
Spreading across markets with lower correlation did more. ES with gold (correlation 0.32) cut the combined figure to 90% of the sum, and a four-market book reached 89%. Even then the saving was modest, because in a stress day correlations tend to rise and the tail moves together.
The lesson for portfolio VaR is to calculate it on the combined position, not by adding standalone numbers, and to stress the correlations rather than trust a calm-year estimate.
Related lesson: Correlation risk
How Regulators Use Value at Risk
Value at risk moved from trading desks into regulation in the 1990s. The Basel Committee's 1996 amendment to the capital accord let banks use internal models for market risk capital, provided VaR was computed daily at the 99th percentile, one-tailed, over a ten-day holding period with at least a year of historical data.
The same framework tests those models with a traffic-light system. A bank counts how many days in the last 250 its actual loss exceeded the one-day 99% VaR. Zero to 4 exceptions puts the model in the green zone, 5 to 9 in the amber zone, and 10 or more in the red zone, where supervisors raise the capital multiplier or may stop the bank using the model.
Applying the traffic-light test to this guide's 20-year backtest of eight futures markets (Yahoo Finance daily closes, historical 99% VaR on a rolling 250-session window) makes the zones concrete. Every rolling 250-day window was scored:
- Crude oil spent 9.9% of windows in the red zone, ES 8.8% and Euro FX 8.8%.
- Gold spent only 0.3% of windows in the red zone and the 10-Year T-Note 2.5%.
- ES stayed green in 57.5% of windows, the T-Note in 78.4%.
- The worst single window for crude oil held 17 exceptions, against a red-zone threshold of 10.
The current Basel market risk framework has moved the capital calculation itself from VaR to expected shortfall at the 97.5th percentile, because expected shortfall captures the size of tail losses. Banks still backtest one-day VaR at the 99th percentile, so VaR remains the checking tool even where it is no longer the capital number.
Using VaR to Size a Futures Position
The main benefit of VaR for a trader is that it puts different markets on one scale. A contract count tells you nothing about risk across instruments. A dollar VaR does. That makes VaR useful for three jobs: comparing markets, setting a daily risk budget, and checking whether a position is too large before the session starts.
Here is a sizing example with illustrative numbers. Take a $100,000 account and cap the one-day 99% VaR of any single position at 2% of the account, or $2,000. Using the last-250 historical 99% VaR:
| Contract | One-day 99% VaR | Contracts within $2,000 |
|---|---|---|
| ES full size | $6,858 | 0 |
| MES micro | $686 | 2 |
| NQ full size | $17,457 | 0 |
| MNQ micro | $1,746 | 1 |
| 10-Year T-Note | $697 | 2 |
| Euro FX full size | $1,155 | 1 |
| M6E micro | $116 | 17 |
| WTI Crude Oil full size | $9,620 | 0 |
| MCL micro | $962 | 2 |
| Gold full size | $17,256 | 0 |
| MGC micro | $1,726 | 1 |
On a $100,000 account, a single full-size ES contract carries a one-day 99% VaR of 6.9% of the account, NQ 17.5% and silver 24.1%. At a 2% budget, only the T-Note and Euro FX fit as full contracts, and the rest need micros or nothing at all. For many trading accounts, the VaR budget rules out full-size contracts before the entry signal is even considered.
VaR, stops and the calm-market trap
Watch for the calm-market trap when sizing with VaR. After a quiet stretch, the recent VaR shrinks and the same budget appears to allow more contracts, right before volatility tends to return. If a lower VaR is the only reason you are adding size, wait for the window to prove the calm is lasting.
Use VaR alongside your stop rather than instead of it. A stop limits the loss you plan to take. VaR estimates the loss the market can hand you on a bad day, which includes gaps through the stop and slippage. When the VaR figure is far larger than your stop distance, the position is relying heavily on the stop filling cleanly.
On our accounts, risk is set by contract limits, a daily loss limit and a trailing drawdown rather than a VaR model. At the time of writing, a 50K account allows up to 4 minis or 40 micros, and a 50K Growth evaluation has a $1,250 daily loss limit. By our arithmetic, one ES contract's one-day 99% VaR of $6,858 as of November 4, 2026 is about 5.5 times that limit, while one MES at $686 uses about 55% of it, which is why VaR is a useful cross-check on contract choice.
Related lesson: Position sizing futures contracts
A Weekly Value at Risk Routine
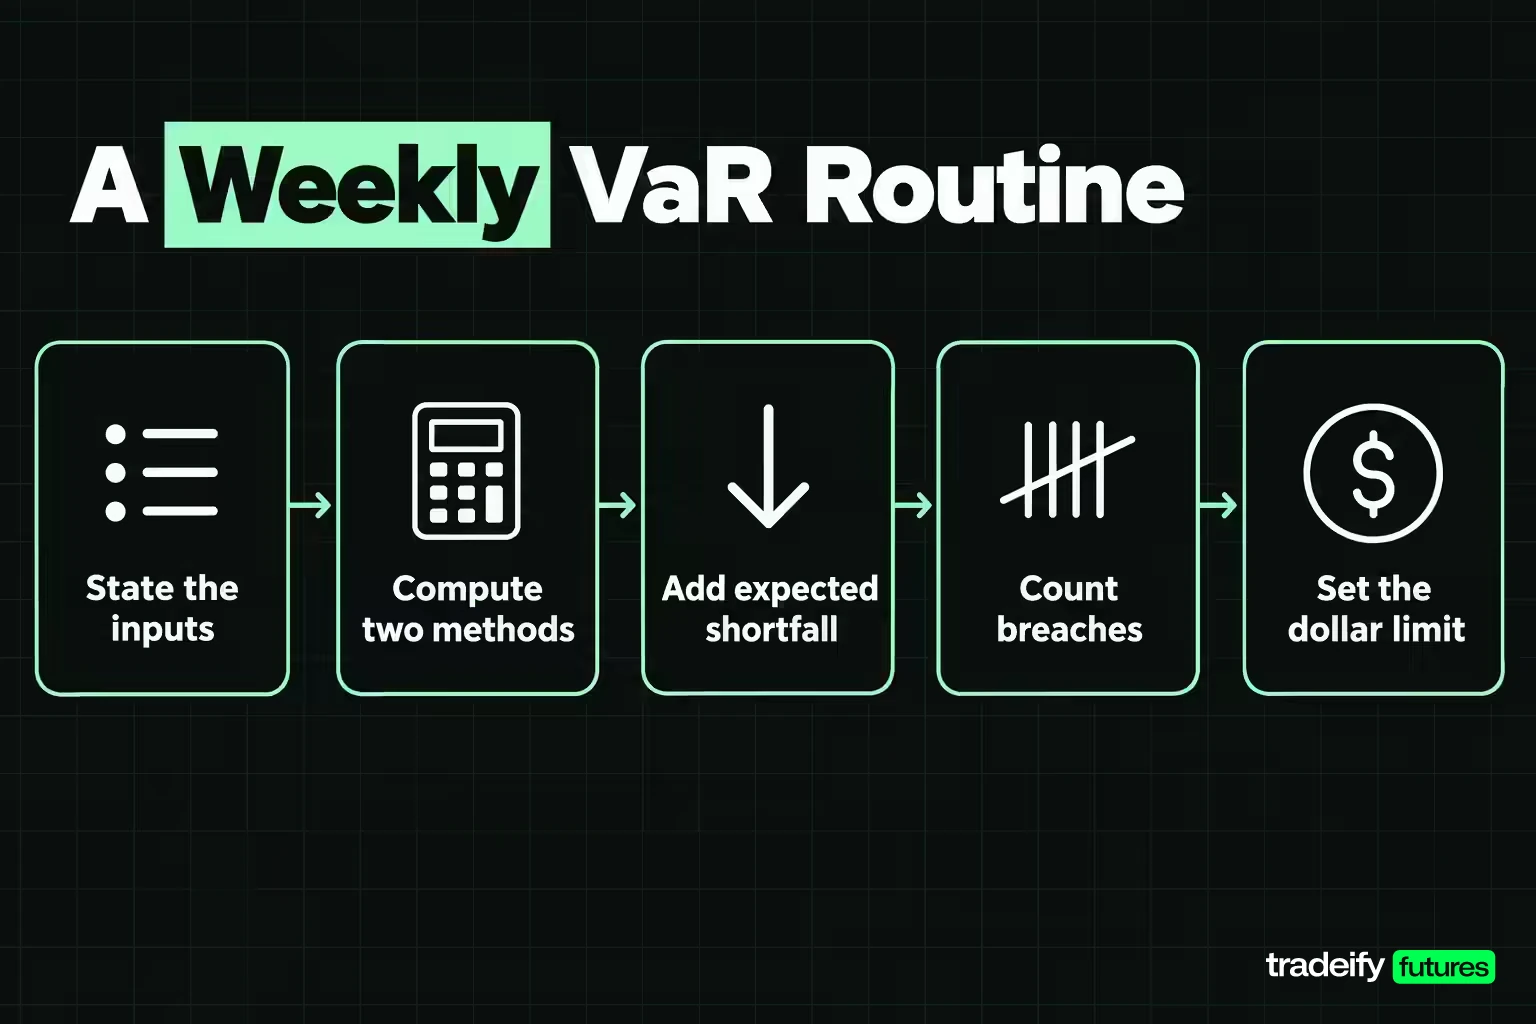
VaR earns its place when it is part of a written routine rather than a number you glance at. A workable weekly process looks like this.
- State the inputs. Write down the confidence level, horizon and window, for example one day, 99%, 250 sessions. Reject any VaR figure that leaves one out.
- Compute two methods. Use historical VaR as the main figure and parametric VaR as a cross-check. If they disagree by more than a few percent, find the sessions causing the gap.
- Add expected shortfall. Budget the account on the average tail loss, not just the VaR line, because the line is where losses start.
- Count breaches. Log every day your loss beat the VaR figure. If a 99% VaR breaks more than about four times in 250 sessions, treat the model as understated.
- Set the dollar limit. Write the daily limit as a hard dollar number in your plan and compare it each week with your worst actual loss, not with the model output.
The point of writing it down is timing. The sizing decision gets made once, before a position exists, instead of in the middle of a losing session.
Related lesson: Maximum drawdown
Frequently Asked Questions About VaR
What does 95% VaR mean?
A 95% VaR is the loss a position should not exceed on 95% of days. On the other 5%, about 1 day in 20, the loss should be larger. In this guide's rolling 20-year backtest of Yahoo Finance daily data on eight futures markets, a historical 95% VaR was exceeded on 5.48% of days, close to its label.
Is value at risk the most I can lose?
No. VaR is the edge of the normal range, not a ceiling. In this guide's 20-year backtest of eight futures markets on Yahoo Finance daily data, losses past the 99% line averaged 1.40 times the VaR figure, and about 1 breach in 15 was more than twice it.
Should I use VaR or expected shortfall?
Use VaR to describe and compare risk, and expected shortfall to size it. Expected shortfall averages the losses past the VaR line, which is what an account actually absorbs on its worst days. Bank regulators now use expected shortfall at the 97.5th percentile for market risk capital.
Why does my VaR change every week?
The window rolls forward and volatility changes. Each day a new session enters a 250-session window and an old one drops out. A jump in VaR means the recent distribution differs from the one the window held before.
What are the three types of risk in banking?
The three main types of risk in banking are credit risk (borrowers not repaying), market risk (losses from price moves) and operational risk (failed processes, people or systems). The Basel capital framework sets separate capital standards for each. VaR and expected shortfall belong to market risk.
What does portfolio at risk mean?
Portfolio at risk (PAR) is a microfinance lending measure, such as PAR30, the share of a loan portfolio with payments more than 30 days overdue. It is unrelated to value at risk despite the similar name.
Value at risk and every figure in this guide are educational measurements of past market data, not forecasts or trading advice. Futures are leveraged, so losses can move faster and run larger than a VaR estimate suggests, and gaps can carry a position through a stop. Prop firm evaluation and funded accounts are simulated trading, and past breach rates do not predict future results.


