.svg)

.svg)
.svg)




TL;DR: The ABCD pattern maps three alternating price swings called AB, BC, and CD. In the classic harmonic version, AB and CD are similar in price distance, point C retraces part of AB, and point D marks a possible reversal zone rather than a guaranteed turn. A bullish ABCD ends with a downswing into D and looks for an upside reaction; a bearish ABCD ends with an upswing into D and looks for a downside reaction. Decide whether you are trading the reversal at D or a continuation before D, wait for your chosen confirmation, place invalidation beyond the structure, and size the position from stop distance and tick value. For a prop-firm trader, a clean pattern is still a no-trade when the required risk does not fit the account’s remaining loss limits.
The hard part is not finding an ABCD shape after the move is over. Almost any chart contains a zigzag that can be labeled A, B, C, and D with enough hindsight.
The real work is deciding which swings count, which version of the pattern you are trading, what would confirm the setup, and how much you can risk if price does not react at D. That distinction matters even more in a simulated evaluation or funded account, where one oversized loss or one emotional re-entry can do more damage than a missed setup.
What the ABCD pattern means
An ABCD pattern is a four-point price structure made from three alternating legs:
- AB is the first directional move.
- BC is a retracement against AB.
- CD moves in the same direction as AB and completes the structure.
The four letters mark swing highs and lows. They do not describe four candles, and each leg can contain many bars.
The classic ABCD reversal pattern
In the classic harmonic interpretation, traders project the CD leg from point C and watch for a possible reversal when price reaches the D completion zone. The basic relationship is AB=CD, meaning the two directional legs are similar in price distance. Some traders also compare the time each leg takes.
The word “possible” matters. D is an area to watch, not an order to enter automatically. Price can pause, reverse, overshoot, or continue through the zone.
The ABCD continuation pattern
Some day-trading education uses “bullish ABCD” for an up move from A to B, a pullback from B to C, and a continuation from C toward D. Under that model, a trader may enter during the CD leg or on a break of B rather than fade the move at D.
That is a different trade from the classic harmonic reversal.
Write the model in your plan before you trade:
- Reversal model: Wait for CD to complete near D, then look for a move against CD.
- Continuation model: Use the BC pullback to plan an entry in the direction of AB and CD.
Both models can use the same four labels. Mixing their entry, stop, and target rules creates a trade with no coherent invalidation.
How ABCD pattern ratios define the D zone
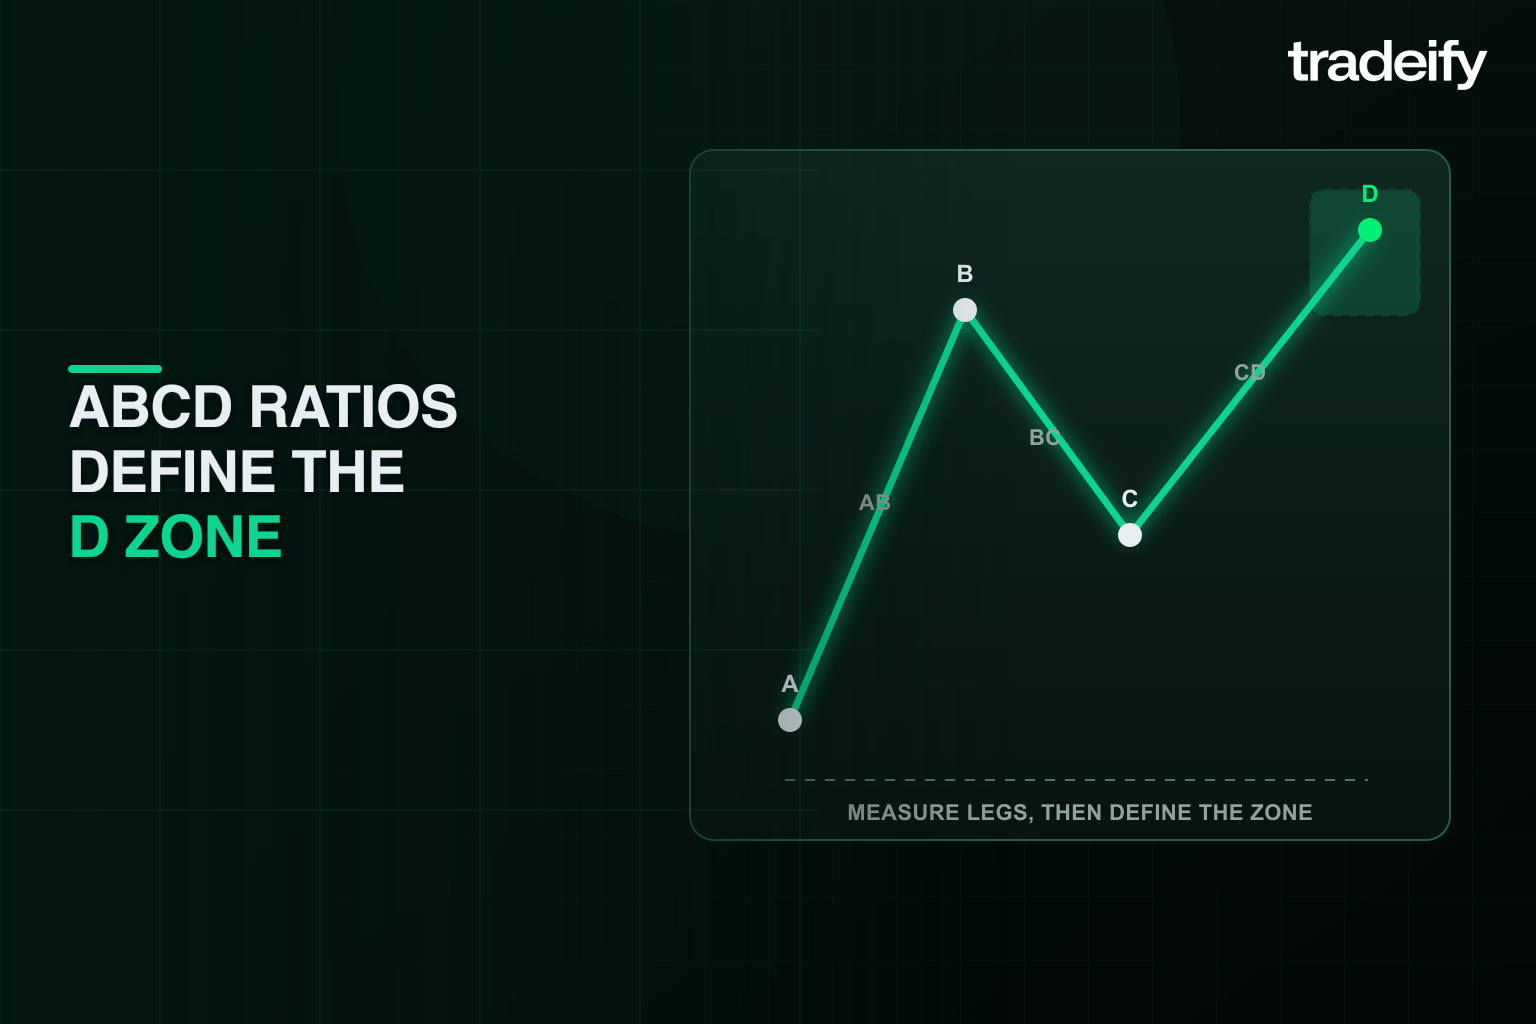
The ratios turn a vague zigzag into a measurable setup. They help answer two questions: Did BC retrace a reasonable part of AB, and where might CD complete?
The HarmonicTrader AB=CD framework allows C to retrace from 38.2% to 88.6% of AB. Many classic teaching examples focus more narrowly on 61.8% or 78.6%. A shallow retracement can occur in a strong trend, while a deeper retracement leaves less distance before C approaches A.
Common projection relationships include:
ABCD measurement | Common relationship | What it helps estimate |
|---|---|---|
BC compared with AB | 38.2% to 88.6% retracement | Whether point C fits the broad structure |
CD compared with AB | Approximately 100% | The basic AB=CD completion |
CD compared with BC | Often 127.2% or 161.8% | A second projection for the D zone |
CD compared with AB in an extension | 127.2% or 161.8% | A longer CD leg when simple equality does not hold |
These numbers are not independent promises. They are measurements that can cluster near one price.
For example, a 61.8% BC retracement often pairs with a CD projection near 161.8% of BC. A 78.6% retracement often pairs with a projection near 127.2% of BC. If that BC projection lands close to the price where CD equals AB, the overlap defines a more specific D zone.
Why the ABCD point D is a zone
Exact equality is uncommon. The TradingView ABCD drawing-tool documentation separates AB=CD, classic ABCD, and ABCD extension forms and notes that line lengths and ratios rarely match perfectly.
Treating D as a zone gives you room to account for:
- The contract’s minimum price increment
- Spread and slippage
- Slight differences in swing selection
- Fast price movement around scheduled news
- An extension beyond the first projection
A zone still needs a boundary. If you keep expanding it every time price moves against you, it is no longer analysis. It is a moving excuse.
How bullish and bearish ABCD patterns work
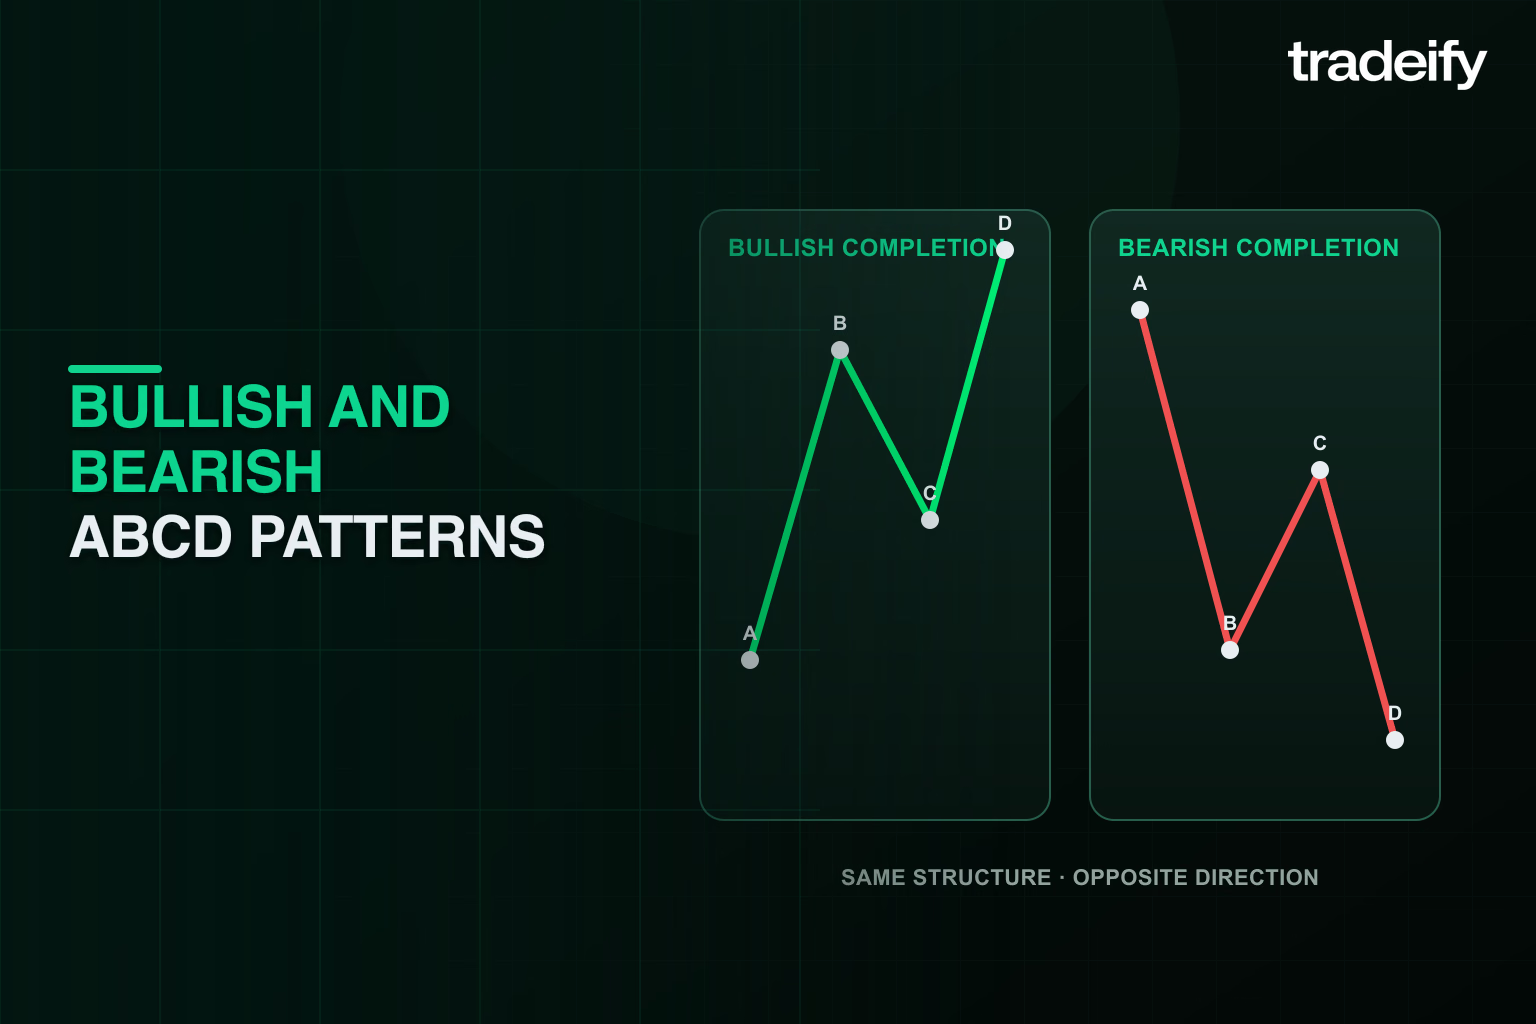
The cleanest naming convention describes the move you expect after D.
Bullish ABCD pattern
A bullish reversal pattern starts at a swing high and finishes at a lower low:
- A to B moves down.
- B to C retraces upward but stays below A.
- C to D moves down, usually below B.
- At D, the trader looks for evidence of an upside reversal.
The pattern is called bullish because the planned trade after completion is long, not because AB and CD point up.
Bearish ABCD pattern
A bearish reversal pattern mirrors the bullish form:
- A to B moves up.
- B to C retraces downward but stays above A.
- C to D moves up, usually above B.
- At D, the trader looks for evidence of a downside reversal.
The planned trade after completion is short.
This naming convention prevents a common error. An upward-pointing pattern is often a bearish reversal setup at D, while a downward-pointing pattern is often a bullish reversal setup at D.
Track the ABCD pattern as five separate states
A finished ABCD drawing makes the setup look obvious. Live price does not give you the finished drawing. It gives you one state at a time, and each state supports a different decision.
Pattern state | What the chart has shown | What is still unknown | Practical response |
|---|---|---|---|
1. Measuring | A, B, and C qualify under the swing rules, so D can be projected | Whether CD will reach the projected area | Mark the zone and invalidation. Do not count a trade yet. |
2. Approaching D | CD is moving toward the completion zone | Whether price will stop, overshoot, or accelerate through it | Check context, scheduled events, liquidity, and the entry model in the plan. |
3. Testing D | Price has entered the projected zone | Whether the area will produce a tradeable reaction | A limit-entry model may act here. A confirmation model must still wait. |
4. Reacting or confirmed | Price has produced the required rejection, close, or structure break | Whether the reaction will continue far enough to reach the target | Recalculate the stop, remaining reward, and size from the actual entry. |
5. Failed | Price has broken the level that invalidates the selected ABCD model | Whether a different setup will form later | End this trade idea. Do not keep relabeling pivots to preserve it. |
The state label fixes a subtle problem: traders often use “the pattern completed” to mean both that price reached D and that a reversal entry was confirmed. Those are not the same event. Reaching D completes the measurement. The entry still depends on the execution model you tested.
Write the current state on the chart before placing an order. If the state changes, rebuild the decision from the current price. A stop and position size calculated while price was approaching D may no longer fit after a wide rejection bar or a deep test of the zone.
During review, record the farthest state reached. A pattern that touched D but never confirmed is not a losing trade under a confirmation model. It is a no-trade observation. Keeping those outcomes separate prevents the journal from assigning wins and losses to rules you did not actually trade.
How to identify an ABCD pattern
Use the same process every time. Consistency makes the setup testable.
Choose meaningful ABCD pivots
Start with a visible impulse from A to B. Use swings that were obvious in real time, not tiny turns selected only because they make the ratios work.
The market and timeframe should have enough activity for practical execution. Thin periods can produce erratic bars, wider effective spreads, and poor fills around the projected zone.
Measure the ABCD retracement
Apply a Fibonacci retracement from A to B and locate C. Record the exact BC-to-AB ratio instead of writing “close enough.”
Reject the reversal structure if C crosses A. That move erases the alternating geometry the setup requires.
Project the ABCD completion
From C, project:
- A CD leg equal to AB
- The chosen BC extension
- Any extension version your written plan permits
Mark the overlap as the potential D zone. Do this before price arrives. Drawing the projection after the turn creates a clean chart but teaches you nothing about live execution.
Check the ABCD market context
Ask what could make the pattern less useful:
- Is D running directly into a higher-timeframe support or resistance area?
- Is a major scheduled release due before the trade can develop?
- Is the CD leg accelerating with wide bars instead of slowing near completion?
- Is liquidity normal for the contract and session?
- Does the stop required by the structure fit your risk budget?
CME Group describes technical analysis as an art rather than a science because the price data are objective but chart-pattern interpretation remains subjective. A precise ratio does not remove that judgment.
Wait for the ABCD trigger
Define confirmation before D trades. Examples include:
- A rejection candle that closes back inside the D zone
- A break of a minor swing created after price reaches D
- A shift in short-term market structure
- A volume or momentum condition already defined in the plan
Confirmation usually gives up some entry price in exchange for evidence that the projected zone is attracting a response. Entering without confirmation may improve the price, but it also accepts more risk that CD is still extending.
How to trade an ABCD pattern
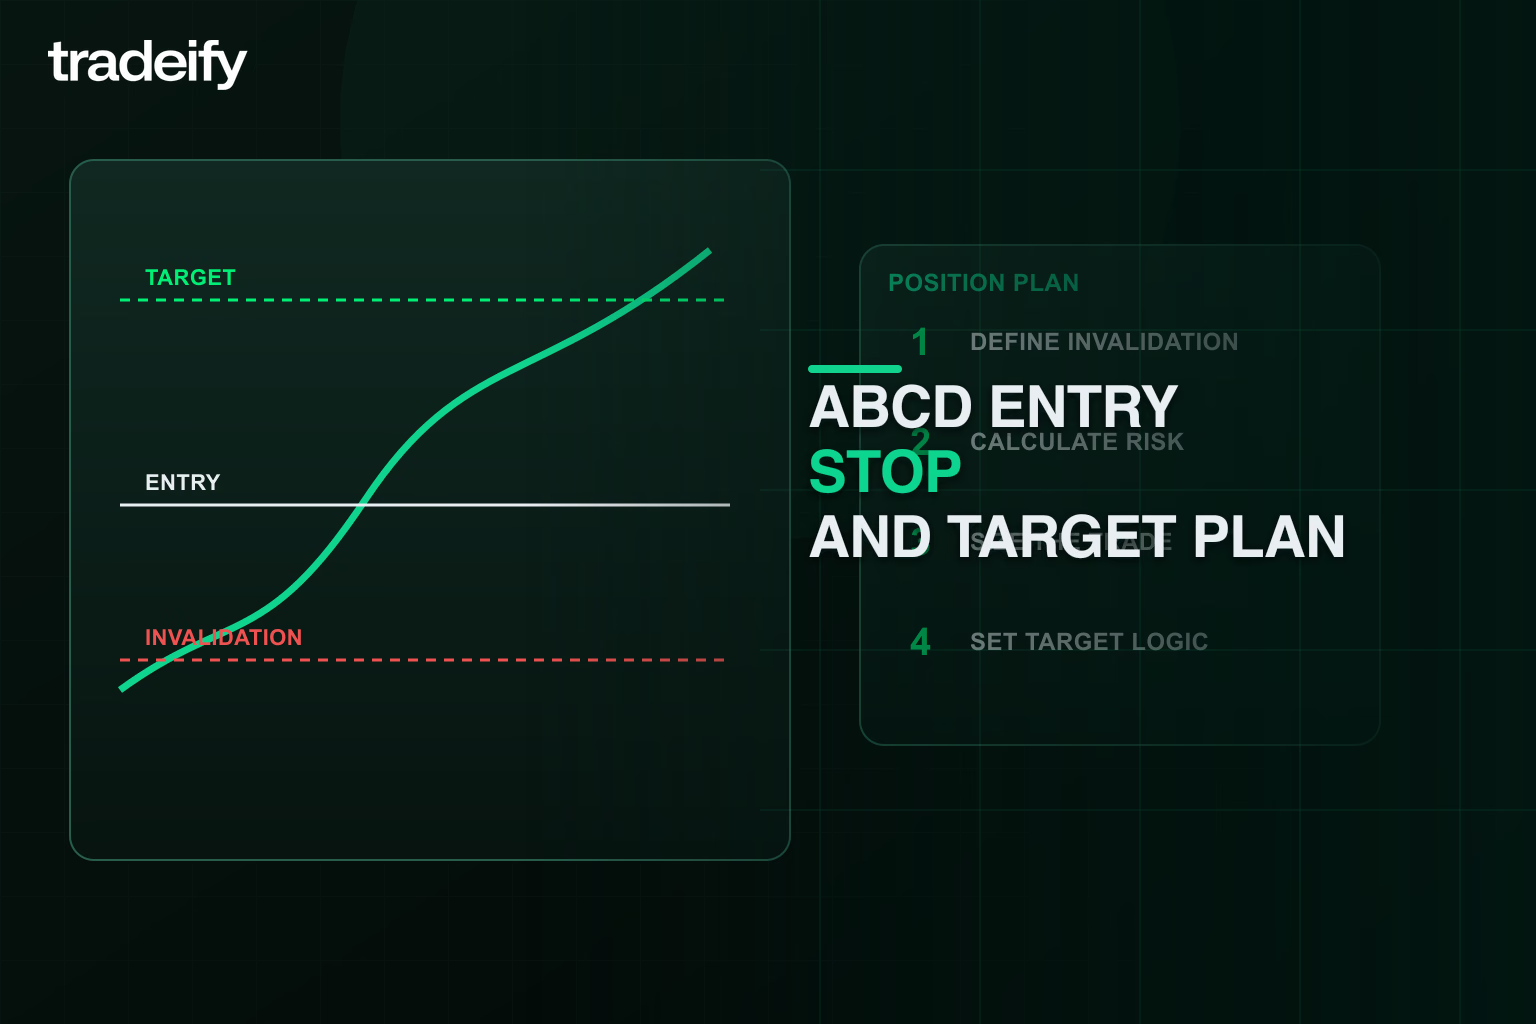
A complete plan needs an entry, invalidation, position size, target, and no-trade condition.
Choose the ABCD entry model
For the classic reversal, three broad choices exist:
- Limit entry in the D zone: Earliest entry and least confirmation. It is also the most exposed to a continuing CD leg.
- Reaction entry: Wait for price to reject the zone or close back through a trigger level.
- Structure entry: Wait for a small countertrend swing to break after D. This confirms more but can widen the stop or reduce the remaining reward.
There is no universally best choice. The important point is to test one definition rather than changing the trigger after seeing the outcome.
Put ABCD invalidation beyond the idea
For a bullish reversal, invalidation normally sits below the D zone or below the low created during confirmation. For a bearish reversal, it normally sits above the zone or confirmation high.
Do not place the stop at the exact projected D price. Normal testing of the zone can touch or pass that level before a response. Do not move the stop farther away simply because the trade is losing.
Size the ABCD trade from the stop
For futures, convert the chart stop into dollars before choosing contract size:
Dollar risk per contract = stop distance in ticks × tick value
Then calculate:
Maximum contracts = floor(maximum trade risk ÷ dollar risk per contract)
Include commissions, fees, and a slippage allowance in the final decision. If the result is zero, the trade does not fit the account.
Set ABCD targets before entry
Possible reference points include:
- The first minor swing created after D
- Point B
- A measured retracement of the CD leg
- A fixed multiple of initial risk
- A higher-timeframe level that sits before the theoretical target
Choose the target logic during testing. Do not switch from a quick target to a distant target because the trade moved slightly in your favor.
A futures ABCD pattern example
Assume a hypothetical futures price moves from A at 5200.00 down to B at 5160.00. The AB leg is 40.00 points.
Price then retraces 61.8% of AB:
40.00 × 0.618 = 24.72 points
After rounding to a tradable price increment, C forms near 5184.75.
An equal CD projection subtracts 40.00 points from C:
5184.75 - 40.00 = 5144.75
The rounded BC leg is 24.75 points. A 161.8% BC extension is about 40.05 points:
24.75 × 1.618 = 40.05 points
Both methods point to roughly 5144.75, so the trader marks that area as a potential bullish D zone.
Price reaches the zone, then produces the trader’s prewritten confirmation. The planned entry is 5147.00 and invalidation is 5142.00, a 5.00-point stop.
Assume this contract moves in 0.25-point ticks and each tick is worth $1.25:
- Stop distance: 20 ticks
- Risk per contract: 20 × $1.25 = $25
- Maximum planned trade risk: $100
- Mathematical size before costs: floor($100 ÷ $25) = 4 contracts
The trader still needs to subtract a fee and slippage allowance and check remaining account limits. If those checks reduce the safe size to three, two, or zero contracts, the chart pattern does not override the risk calculation.
Point B at 5160.00 could serve as one target reference. From a 5147.00 entry, that is 13.00 points of potential movement against 5.00 points of initial chart risk. That ratio may look attractive, but price is not obligated to reach B.
ABCD pattern risk in a prop-firm account
A pattern can be technically valid and still be wrong for the account.
Before entering, check:
- The account’s remaining daily loss room
- The distance to any trailing or end-of-day drawdown threshold
- The risk already open in other positions
- The number of attempts already taken on the same idea
- The effect of slippage during the current session
- Whether holding through a scheduled event is permitted by the applicable rules
The exact rule set varies by firm and account type. Use the current terms and dashboard values that govern your account.
Protect the ABCD risk budget
The D zone can tempt traders to add as price moves deeper into the projection. That can turn one planned loss into several entries with one shared invalidation.
Decide in advance:
- Whether scaling is allowed
- The maximum total risk across every entry
- How many failed attempts end the idea
- What market action invalidates the pattern
If one stop would force you to trade smaller or more emotionally for the rest of the session, the position is too large.
Keep simulated and funded ABCD rules consistent
Changing the setup after an evaluation or payout milestone makes your prior data less useful. The pattern name may stay the same while the actual strategy changes.
Use the same pivot rules, ratio tolerance, trigger, stop logic, and journal fields in simulation and in any account where the rules permit the strategy. That gives you a better chance of recognizing whether execution pressure, not the pattern, is causing the difference.
The CFTC advises futures traders to understand their obligations, review risk disclosures, and use capital they can afford to lose. No chart pattern turns a leveraged product into a guaranteed trade.
Common ABCD pattern mistakes
Switching ABCD models mid-trade
A trader enters during CD as a continuation trade, then calls D a reversal entry after the first position loses. The labels are the same, but the second trade has a different thesis.
Write “continuation” or “reversal at D” in the plan before entry.
Forcing ABCD pivots
If several nearby highs or lows could be B or C, the projected D zone can change materially. Define how a swing qualifies and apply that rule without hindsight.
Entering the ABCD zone too early
Price approaching D is not the same as price completing and reacting at D. Anticipating the turn can work, but it must be a tested entry model with its own risk allowance.
Treating ABCD ratios as exact prices
Ratios help define an area. They do not account for every order, news release, liquidity shift, or competing timeframe.
Ignoring ABCD contract risk
A five-point stop does not have the same dollar impact across contracts. Convert the distance using the correct tick value before choosing size.
Moving ABCD invalidation
The clean geometry can make a trader believe the setup “has to” turn. It does not. If price reaches the prewritten invalidation, the next action is the one in the risk plan.
Retaking every ABCD signal
After a stopped trade, a nearby swing can create another apparent A, B, C, and D. Set an attempt limit so pattern recognition does not become revenge trading.
How the ABCD pattern compares with other formations
IG describes the ABCD as one of the easiest harmonic patterns to recognise on a price chart, and that simplicity is exactly why it gets confused with its neighbors. A flag continuation trade, a triangle breakout trade, and an ABCD reversal trade each define completion differently, define failure differently, and therefore want different stops. A structure that gets mislabeled changes your risk without announcing it.
ABCD versus XABCD harmonic patterns
The ABCD is the four-point member of the harmonic family. Three legs, one retracement, one completion zone, and ratio rules that qualify both. HarmonicTrader's own patterns index lists AB=CD alongside the Bat, Butterfly, Crab, Gartley, and Shark as distinct harmonic patterns, and the four-point structure is where the larger five-point patterns start.
The XABCD family adds a point X ahead of A, which turns three legs into four: XA, AB, BC, and CD. TradingView's XABCD drawing-tool documentation names the Gartley, Butterfly, Crab, and Bat as the four major XABCD patterns and notes that within a butterfly, a valid ABCD pattern must be observed inside the swing from A to D. The pattern you trade on its own is also a component of the bigger structures.
The Gartley shows how the extra point anchors the ratios. In the bullish form, AB retraces 61.8% of the XA leg, BC retraces between 61.8% and 78.6% of AB, and CD extends between about 127% and 161.8% of BC. The plain ABCD has no X leg to anchor to, so its rules measure symmetry between AB and CD instead. More anchoring ratios mean a more specific completion zone, and also more ways for the setup to be rejected before it finishes.
The practical difference is what invalidates the trade. A plain ABCD fails when its own structure fails: C crosses A, the ratios land outside your tolerance, or the D zone produces no reaction. An XABCD pattern can fail on the ratios alone, because each leg must fit its band. Choose the structure your plan actually tests, because a four-point shape does not become a five-point claim just because the chart also printed an X.
ABCD versus bull and bear flags
A flag pairs a steep impulse with a shallow pause. Warrior Trading's bull flag guide describes the initial move as the flag pole and the sideways consolidation near the highs as the flag itself, with a bear flag as the inverse in a downtrend. The trade is a continuation that starts when price clears the consolidation.
The ABCD reversal is built differently. BC is a retracement with a measurable depth, and CD is a second impulse toward a projected zone, so the pattern comes with a completion price before entry. A flag has a boundary instead of a projection. If what you labeled BC is drifting sideways inside a tight range rather than swinging back through a real retracement, you are looking at a flag, and the CD projection arithmetic no longer applies.
The distinction matters most in the journal. A flag breakout entry and an ABCD reversal entry can appear on the same chart and even produce the same result, but they carry different stop locations, different targets, and different failure modes. If your record pools them under one name, neither entry can be evaluated on its own.
ABCD versus triangles and wedges
Triangles and wedges are boundary patterns. Two lines, price bouncing between them, and a trade that begins when price escapes. TradingView's triangle pattern drawing-tool documentation separates the symmetrical triangle (two converging lines, generally treated as a continuation), the ascending triangle (flat resistance above rising support, generally bullish), and the descending triangle (flat support below falling resistance, generally bearish), and recommends waiting for breakout confirmation because the breakout can come in the unexpected direction.
The ABCD has no boundary lines. It is a sequence of measured swings with a projected finish, so the trade is the reaction at D, not the escape from a box. Invalidation differs too: a triangle fails when its boundary breaks the wrong way, while an ABCD fails when the structure is violated or the D zone produces no tradeable reaction under your entry model.
One naming trap is worth knowing. TradingView's triangle tool also labels its four points A, B, C, and D, placed on alternating highs and lows. Same letters, different structure. The letters carry no meaning until your plan gives them rules, and a triangle ABCD is not a harmonic ABCD.
If you trade both families, keep the distinction in your records. The descending triangle and the rising wedge have their own guides on this site, and their failure modes are not the ABCD's failure modes.
How to test an ABCD pattern
There is no useful universal success rate for “the ABCD pattern.” Results depend on which variant you trade, how pivots are selected, ratio tolerance, confirmation, market, timeframe, session, costs, and exits.
Build a test that another trader could repeat.
Record:
- Contract and session
- Chart timeframe
- Reversal or continuation model
- A, B, C, and D prices and times
- BC retracement percentage
- CD-to-AB and CD-to-BC relationships
- Entry trigger
- Stop distance in ticks and dollars
- Planned and actual exit
- Maximum favorable and adverse movement
- Fees and estimated slippage
- Result in units of initial risk
- Any account-rule or execution mistake
Test the rules on historical data, then use live simulation to observe fills and decision pressure. Do not change a definition halfway through the sample. If you revise the rules, start a new version and track it separately.
Review more than win rate. A setup can win often but still lose money if average losses are much larger than average wins. A lower win rate can still be viable when losses are controlled and winners are larger, but only your recorded distribution can show that.
Frequently asked questions about the ABCD pattern
How do you draw an ABCD pattern?
Mark point A and point B on a visible impulse leg, then apply a Fibonacci retracement from A to B and label the first swing that reacts inside that range as point C. From C, project a CD leg that is approximately equal to AB in price distance and mark the overlap of your projections as the D zone before price arrives. Most charting platforms, including TradingView, ship a dedicated ABCD drawing tool that keeps the four points draggable while you refine the swing selection.
What is the harmonic pattern ABCD?
The harmonic ABCD is the four-point version of the pattern in which the BC retracement and the CD completion are qualified with Fibonacci ratios instead of eyeballed symmetry. It is commonly treated as the simplest member of the harmonic family, and the larger XABCD structures such as the Gartley, Butterfly, Crab, and Bat add a fifth point ahead of A; the butterfly explicitly requires a valid ABCD inside its A-to-D swing. The comparison section above breaks down the differences.
What is ABCD pattern software or an indicator?
An ABCD indicator is usually a configurable script that searches for alternating pivots and tests their price relationships. A manual drawing tool lets you choose the four points yourself. Neither approach removes judgment.
Check how the tool defines a pivot, which ratios it permits, whether it uses closed bars, and which pattern variant it labels. Two tools can mark different ABCD structures on the same chart because their settings differ.
What timeframe is best for the ABCD pattern?
There is no universal best timeframe. Short charts produce more signals and more noise. Longer charts produce fewer patterns, wider stops, and longer holding periods.
Choose a timeframe whose normal stop distance, session liquidity, and trade duration fit your account rules. Use a higher timeframe for context if that is part of the tested plan.
Does an ABCD pattern need Fibonacci ratios?
The simple AB=CD idea can be drawn from price symmetry alone. The harmonic version uses Fibonacci retracements and projections to validate C and define a more specific D zone.
State which definition you are testing. A loose visual zigzag and a ratio-qualified harmonic setup should not share one performance record.
Is the ABCD pattern bullish or bearish?
It can be either. In reversal terminology, a bullish ABCD falls into D and looks for an upside reaction. A bearish ABCD rises into D and looks for a downside reaction.
If someone calls an upward A-to-B move a “bullish ABCD,” check whether they mean a continuation trade during CD rather than a reversal after D.
How reliable is the ABCD pattern?
No accepted evidence supports one success rate across markets and rule sets. The pattern is a way to organize price, projection, confirmation, and invalidation. Its usefulness depends on a precise definition, realistic costs, disciplined execution, and testing on the contract and session you trade.
What is the most successful trading pattern?
None has a verified universal ranking, and any list that claims one is marketing rather than measurement. Results depend on the definition you test, the market and session you trade, your costs, and your exits. A pattern with a written rule set you have tested on the contract you actually trade will beat a famous label you have never measured, which is why this guide stresses one tested definition over pattern shopping.
Use the ABCD pattern as a planning tool
The ABCD pattern earns its place on a futures chart when it makes your decisions clearer.
Label meaningful swings. Measure the retracement. Project the D zone before price arrives. Decide whether you are trading continuation or reversal. Wait for the trigger your data supports. Put invalidation where the idea fails, then size the position from tick value and the account’s actual risk room.
If those pieces do not line up, do not force it. A skipped pattern costs nothing. A trade with no coherent model, no fixed invalidation, and too much size can consume the room you needed for the next clean setup.
.svg)
.svg)
.svg)
.svg)









.webp)