.svg)

.svg)
.svg)




TL;DR: Backtest at least 100 trades before treating a strategy as more than an early hypothesis, then aim for 200 to 500 trades before making a serious risk decision. At 95% confidence, roughly 96 independent trades estimate a 50% win rate within about ±10 percentage points, 196 trades narrow that range to about ±7 points, and 384 trades narrow it to about ±5 points. Trade count alone is not enough. The sample should span trending, range-bound, quiet, and volatile periods, include realistic fees and slippage, preserve unseen out-of-sample data, guard against look-ahead and survivorship bias, and be followed by forward testing.
If you test a strategy for 20 trades and win 13 of them, the 65% win rate may look convincing. It is not. A small run can be driven by luck, one favorable market phase, or a few unusually large winners.
That does not mean every strategy needs exactly the same number of backtest trades. A fast intraday system that generates several signals per day should usually produce a much larger sample than a slow trend strategy that trades a few times per year.
The useful question is not only how many trades you tested. It is whether the test gives you enough independent evidence to estimate the strategy’s edge and risk.
The best number of trades for a strategy backtest
For most retail trading strategies, these ranges are a practical starting point:
Number of trades | What the backtest can tell you | How to treat the result |
|---|---|---|
Fewer than 30 | Very little about the strategy’s true performance | Idea generation only |
30 to 99 | Whether the rules are testable and show early promise | Preliminary screen |
100 to 199 | A rough estimate of win rate, expectancy, and drawdown | Useful, but still uncertain |
200 to 500 | A more stable view across varied conditions | Practical validation range |
More than 500 | Better estimates for frequent strategies and tail risk | Stronger evidence if the trades are varied |
The clean answer is to use 100 trades as a first checkpoint and 200 to 500 trades as the target range for validation.
More trades are helpful when they add genuinely new information. Five hundred nearly identical signals from one market phase are less useful than a smaller set spread across several distinct conditions.
Why 100 backtest trades are only a starting point
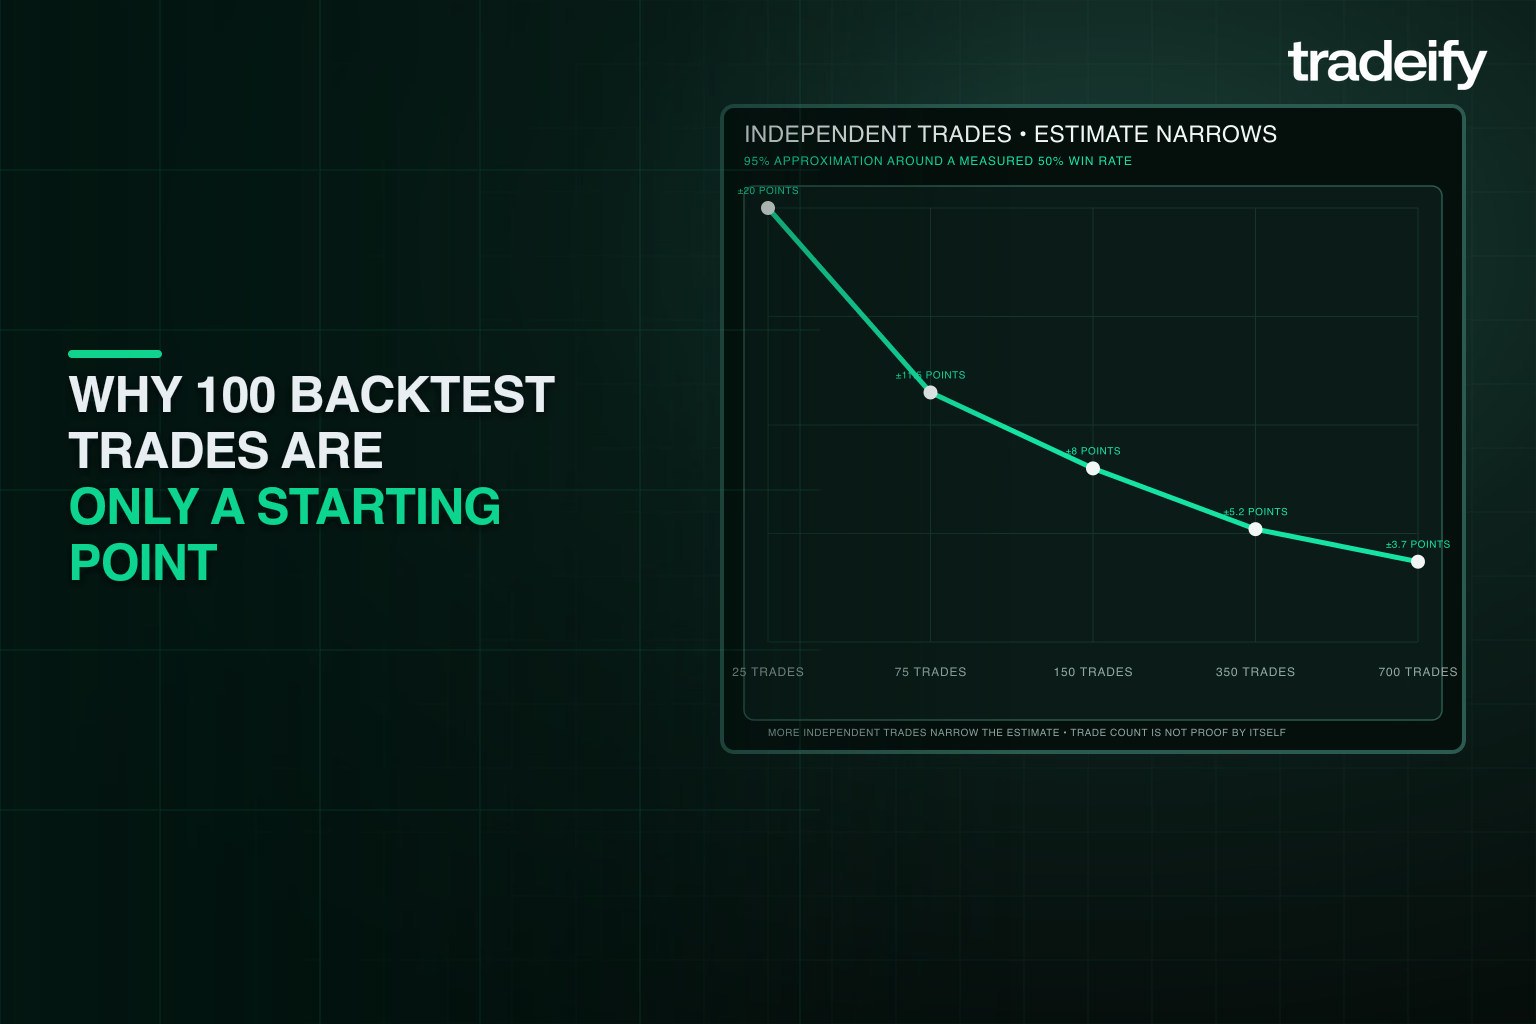
The popular 100-trade rule is useful because it is easy to remember and large enough to expose obvious flaws. It is not a universal proof threshold.
Suppose a strategy wins 50% of its trades. A simple 95% confidence interval gives an approximate sense of how precisely the backtest estimates that win rate:
Independent trades | Approximate margin around a 50% win rate |
|---|---|
30 | ±18 percentage points |
50 | ±14 percentage points |
100 | ±10 percentage points |
200 | ±7 percentage points |
400 | ±5 percentage points |
With 100 independent trades and a measured 50% win rate, the true rate could plausibly be close to 40% or 60%. That is a wide range.
The same strategy can have very different expectancy at those two endpoints, especially when its average win and average loss are close.
These figures are approximations, not guarantees. They assume independent observations and focus only on win rate. Trading results also depend on payoff size, loss size, costs, skew, and changing volatility.
Still, the table explains why 100 trades can support an initial judgment while 200 to 500 trades give a more useful estimate.
Independent trades make a backtest sample stronger
Raw trade count can overstate how much evidence you have.
Ten positions opened on correlated index products during the same broad rally may behave more like one market bet than ten separate observations.
Your effective sample size falls when trades share the same signal, market direction, volatility shock, time window, or closely related instruments. This is common when a strategy opens several positions at once or repeatedly enters during a single trend.
To make a backtest sample more informative:
- Test more than one market phase.
- Separate results by volatility level and trend condition.
- Review simultaneous or highly correlated positions as a group.
- Avoid counting repeated entries from the same move as fully independent proof.
- Check whether one asset, month, or setup subtype produces most of the profit.
A strategy should not pass because one cluster of similar trades happened to work. It should show a repeatable edge across enough distinct opportunities.
Market conditions matter as much as backtest trades
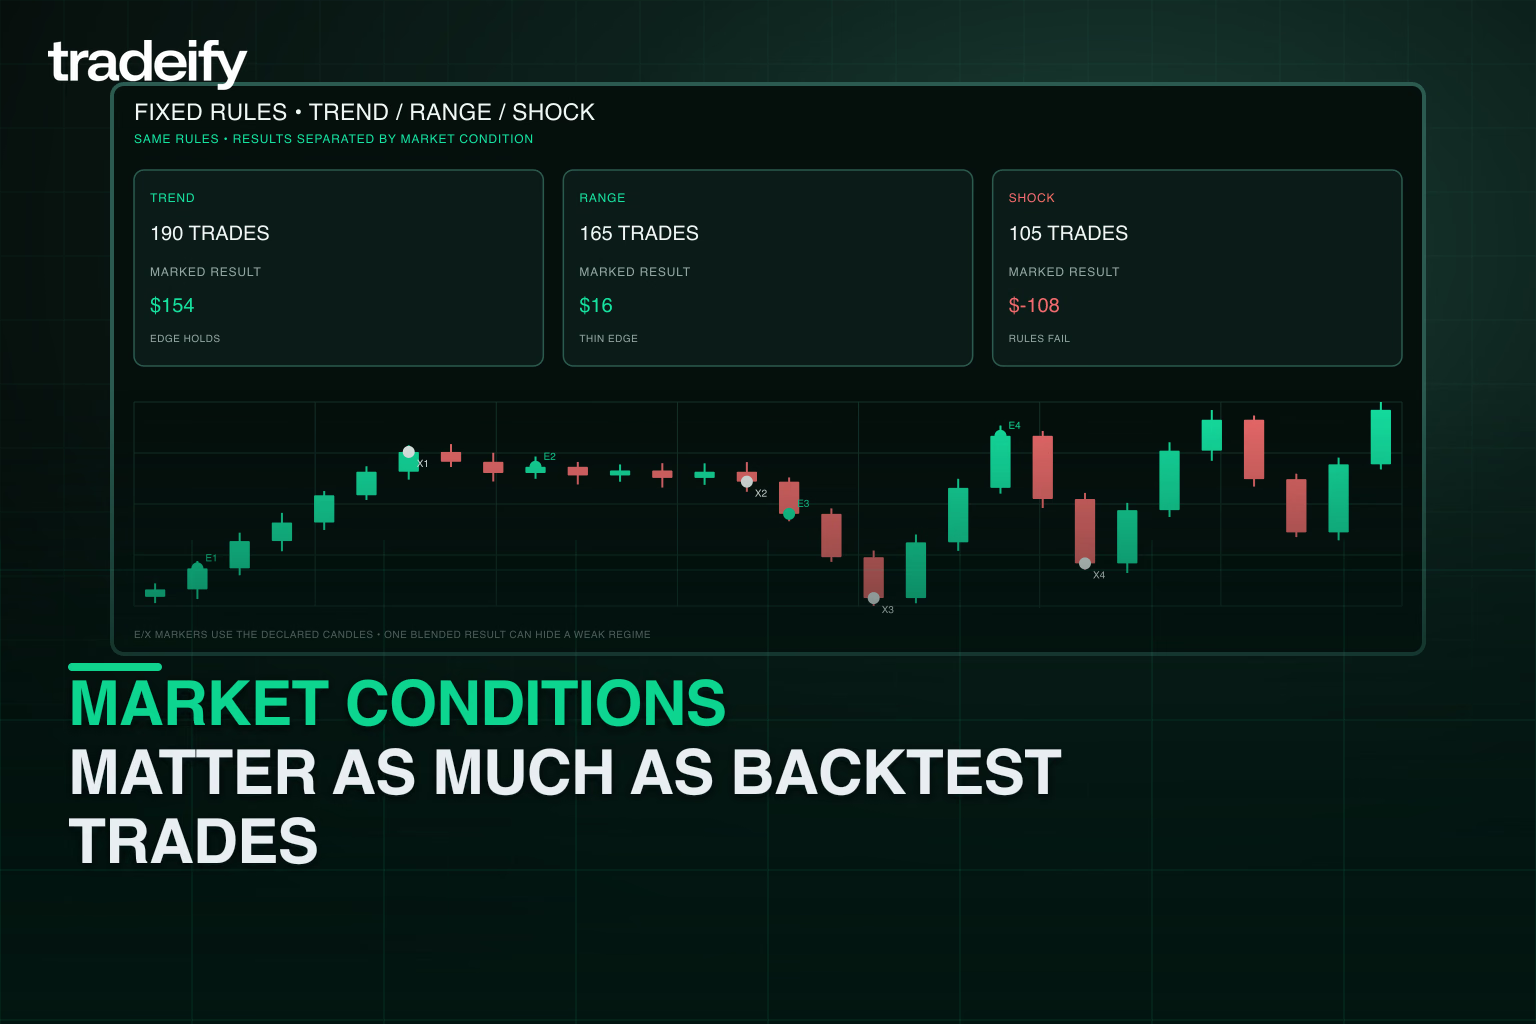
A backtest needs both trade count and time coverage.
A day trading strategy can produce 200 trades in a few months, but that window may contain only one volatility regime. A swing strategy may need several years to reach the same count.
Include periods that reflect how the strategy is supposed to behave:
- Strong directional markets
- Sideways or range-bound markets
- High-volatility periods
- Quiet, compressed periods
- Major scheduled event periods
- Both favorable and unfavorable seasons for the setup
Do not force every strategy to work in every condition. A trend strategy may reasonably struggle in a tight range.
The test should reveal that weakness clearly so the rules can define when the strategy is active, when risk should fall, and what drawdown is normal.
Calendar coverage also needs to match trade frequency. One hundred trades from a five-minute strategy may cover a short interval. One hundred trades from a daily trend strategy may span a decade.
Report both the number of trades and the years or market phases tested.
Backtest trades needed by strategy type
Different trading styles call for different targets because they create opportunities at different rates.
Strategy type | Practical trade target | Additional requirement |
|---|---|---|
Scalping or high-frequency intraday | 300 to 1,000+ | Test several volatility and liquidity conditions |
Day trading | 200 to 500 | Include trending, range-bound, quiet, and volatile sessions |
Swing trading | 100 to 300 | Cover several years and more than one market cycle |
Position or slow trend trading | 50 to 200 | Use long history, multiple instruments, and wider uncertainty ranges |
These are working ranges, not statistical laws.
If a strategy trades rarely, do not lower the evidence standard and pretend a small sample is precise. State the uncertainty, extend the historical window, test the same rules on suitable additional instruments, and use stress testing to study possible outcome paths.
How to run a reliable strategy backtest

A large sample cannot repair a weak testing process. Use a fixed procedure so each trade is counted under the same rules.
How to start backtesting if you are new
You do not need to code a full strategy on day one. Start with one market, one timeframe, and rules you can describe without interpretation: the entry, stop, target, trading window, and conditions that cancel the setup.
Use your platform's replay or historical-chart tools to move through past sessions without looking ahead. Log every valid signal in a spreadsheet, including the time, entry, exit, result, maximum adverse excursion, and notes. After 20 to 30 trades, review whether the rules were clear enough to follow. Do not judge the strategy from that small sample. Clarify the rules, restart the count if a change materially affects which trades qualify, and build toward the larger sample targets above.
Define the strategy before counting trades
Write exact entry, exit, stop, target, sizing, session, and filter rules before reviewing results.
If the rules change halfway through, the early and late trades no longer test the same strategy.
Track rule changes as new versions. Restart or clearly separate the sample when a change materially affects which trades qualify.
Include trading costs in every backtest
Add commissions, fees, bid-ask spread, slippage, and realistic fill assumptions.
Small costs can erase a thin edge in strategies with frequent trades or tight targets.
Stress the costs above your base estimate. If a modest increase turns expectancy negative, the strategy may be too fragile for live execution.
Reserve out-of-sample trades for the final test
Keep part of the historical data unseen while developing the rules. A common split is 70% for development and 30% for out-of-sample validation.
Once the rules are fixed, run them on the reserved segment without tuning.
Similar behavior in both segments is stronger evidence than excellent in-sample results followed by a sharp collapse. If you adjust the strategy after seeing the reserved data, that period is no longer out of sample.
Measure more than the strategy win rate
Record at least these backtest metrics:
- Expectancy per trade
- Average win and average loss
- Profit factor
- Maximum drawdown
- Longest losing streak
- Return in R-multiples
- Results by setup, session, direction, and market condition
A high win rate can still lose money when average losses are much larger than average wins. A lower win rate can work when winners are sufficiently larger than losses.
Expectancy and drawdown usually matter more than win rate alone.
Stress test the order of backtest trades
The historical sequence is only one possible order of wins and losses.
A Monte Carlo test can reshuffle trades or sample from the observed distribution many times to estimate a range of drawdowns, losing streaks, and ending results.
Stress testing does not create more evidence. It helps show how varied the path could be if the estimated edge is real.
Use it to choose risk per trade that can survive worse sequences than the single backtest produced.
Avoid Backtest Bias
A backtest can produce a beautiful equity curve and still be worthless if the test quietly uses information you would not have had at the time. The two most common forms are look-ahead bias and survivorship bias, and both inflate results in ways that are hard to spot by eye.
Look-ahead bias happens when the backtest relies on data that was not yet available on the historical date it simulates. The classic source is a fundamental figure dated to the period it describes rather than to the day it was actually published. If your strategy buys on January 1 using full-year earnings that were not reported until February, the test is reading tomorrow's newspaper. The equity curve looks skillful, but the skill is an illusion that vanishes the moment the strategy meets live markets where it has to wait for the filing like everyone else.
Survivorship bias happens when the data set only includes instruments that still exist. Testing a stock-screening strategy on the current S&P 500 members ignores every company that was removed for poor performance, bankruptcy, or acquisition. The survivors tend to have stronger-than-average resilience, so the backtest inherits a systematic head start that a real trader never had. The same trap applies to futures contracts that were delisted or to funds that were liquidated.
The practical guard is to align every input with the moment it became knowable. Use point-in-time data where available, lag fundamental or scheduled releases by a realistic reporting delay, and include delisted or failed instruments in the historical universe. If a strategy's edge disappears once those corrections are applied, the edge was the bias, not the idea. For a broader review of common testing errors, see the backtesting mistakes guide.
When to stop adding trades to a backtest
More data still helps, but the value of each extra trade falls as the sample grows.
Stop treating trade count as the main task when all of these are true:
- The strategy has at least 200 to 500 relevant trades, or the largest practical sample for a slow system.
- Key metrics have stabilized as new trades are added.
- The sample covers varied market conditions.
- Results are not dependent on one short period or one instrument.
- Out-of-sample performance is reasonably consistent with development results.
- Costs and adverse fill assumptions do not erase expectancy.
You can test metric stability by checking results after each additional block of 25 or 50 trades.
If expectancy, profit factor, and drawdown estimates still swing sharply, the sample is not stable enough for a confident decision.
Do not stop because the equity curve looks good. Stop when added evidence no longer changes the basic conclusion and the strategy has passed independent checks.
Move from backtest trades to forward testing
A backtest estimates what the rules would have done in historical data. It cannot fully reproduce real-time fills, missed signals, platform behavior, or execution errors.
After the backtest passes, forward test the unchanged rules in real time.
Thirty to 50 properly logged paper trades can expose practical problems, although a higher-frequency strategy may need more. Compare signal frequency, slippage, win rate, expectancy, and drawdown with the backtest.
If the forward test differs sharply, find the cause before risking more capital.
If it behaves within a reasonable range, begin at small size and increase risk only after live results provide more evidence.
Frequently asked questions about strategy backtests
Are 30 trades enough to backtest a strategy?
Thirty trades can show whether an idea is testable, but the uncertainty is too wide for a strong conclusion.
Treat the result as a hypothesis and continue toward at least 100 trades, then preferably 200 or more.
Are 100 trades enough for a strategy?
One hundred trades are enough for a useful first review.
They are rarely enough to prove a strategy is reliable, especially when the trades come from one short market phase. Use 100 as a checkpoint, not the finish line.
Is 1,000 backtest trades too many?
No, if the strategy naturally produces that many relevant trades and the data quality is sound.
A large sample is especially helpful for fast systems and rare loss events. It becomes less useful when extra trades are duplicates from highly correlated signals or poor historical data.
How many years should a strategy backtest cover?
There is no fixed number of years. Test long enough to include the conditions the strategy is likely to face.
For a frequent strategy, that may still require several distinct periods. For a slow strategy, it may require a decade or more.
What if a strategy cannot produce 200 trades?
Use the largest honest sample available, extend the time range, and consider applying the unchanged rules to other suitable instruments.
Report wider uncertainty, use scenario or Monte Carlo stress tests, and demand stronger forward-test evidence before increasing risk.
A practical backtest decision rule
Start with 100 trades to decide whether a strategy deserves more work.
Continue to 200 to 500 trades for a serious validation sample, with the higher end favored for frequent strategies. Then verify that the evidence spans distinct market conditions, survives realistic costs, and holds up on data that was not used to build the rules.
The number is only one part of the decision. A backtest becomes useful when its trades are consistent, sufficiently independent, and representative of the risks the strategy will face.
.svg)
.svg)
.svg)
.svg)








.webp)