
Sentiment analysis helps day traders decide whether the market is leaning toward momentum, reversal, or indecision before they risk capital. It is not a trade trigger by itself. It works best as context that helps you choose when to press, when to fade, and when to stay flat.
Used correctly, sentiment analysis gives structure to the session. You start with the broader risk backdrop, confirm it with intraday participation, then let price action decide whether the setup is valid.
Quick Sentiment Checklist Before the Open
- Risk backdrop: Is volatility expanding or contracting?
- Positioning: Are traders leaning heavily one way already?
- Internals: Are breadth and participation confirming the move?
- Structure: Is price accepting above or below key levels such as VWAP?
- Plan: What invalidates the idea, and where do you exit?
How Sentiment Analysis Fits with Technical and Fundamental Trading
Technical analysis helps with timing. Fundamental analysis helps with macro context. Sentiment analysis helps you read whether traders are pressing risk, reducing risk, or getting trapped in a crowded move. Day traders tend to get the most value from sentiment when they use it to filter setups rather than force them.
For example, a trader watching liquid futures contracts such as ES or NQ can use sentiment to decide whether a breakout has enough participation behind it or whether a move is more likely to fail back into balance.
Macro Sentiment Indicators and Global Risk Assessment
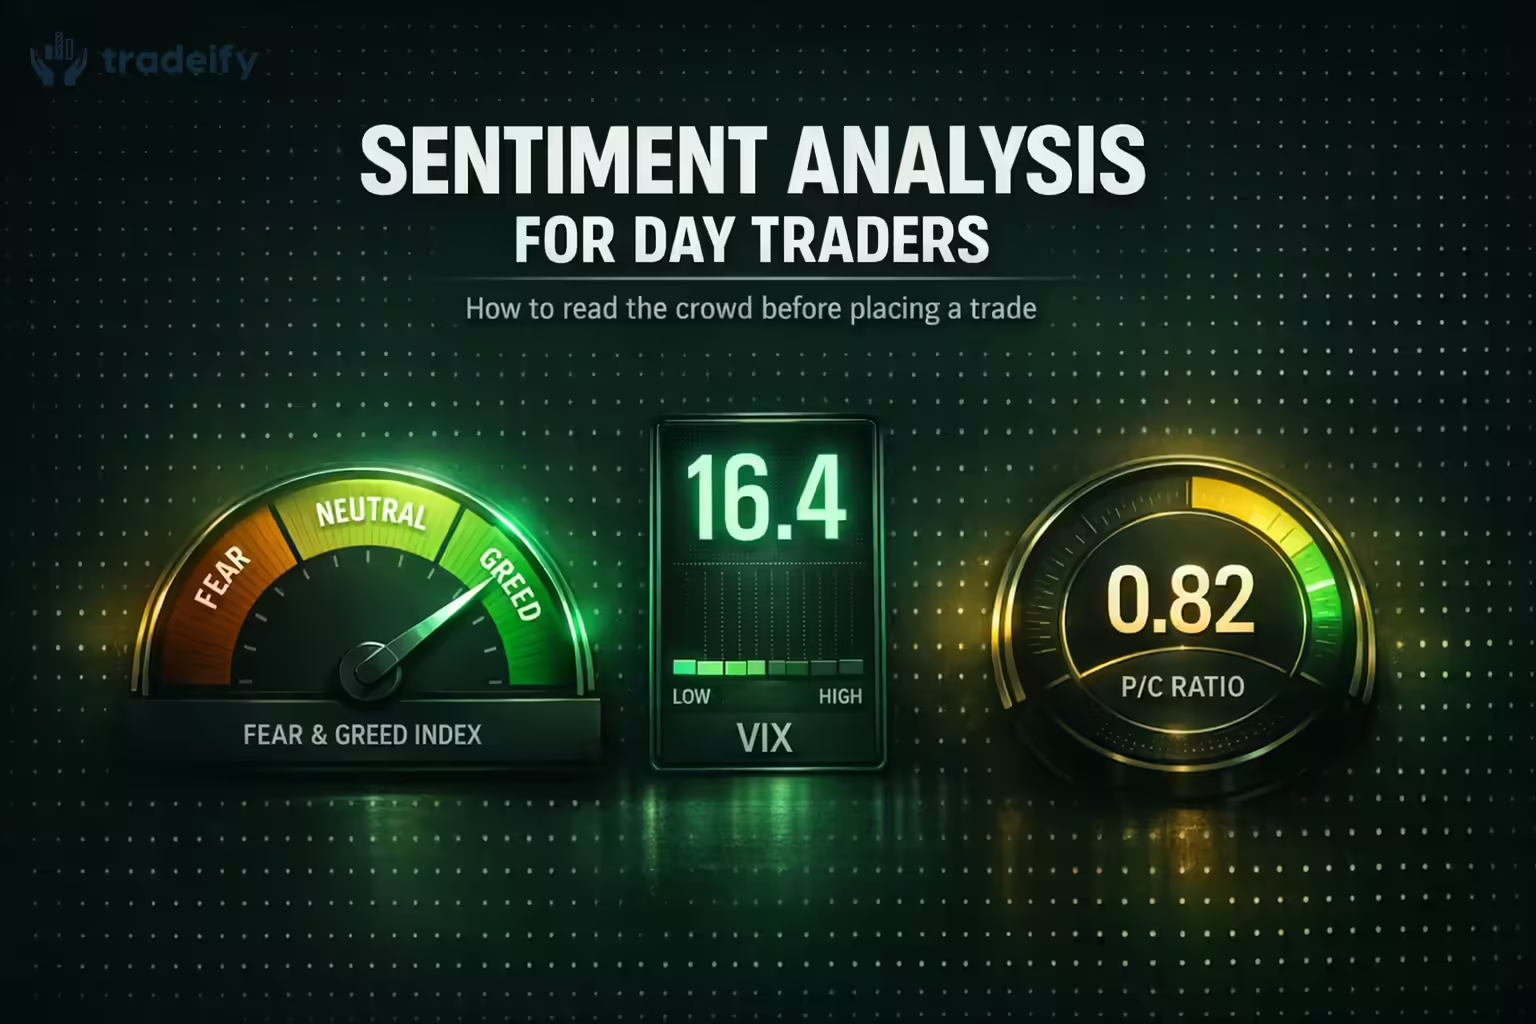
Start with broad measures of risk appetite. The Cboe VIX is commonly used as a volatility gauge, while the CFTC Commitment of Traders report gives slower but useful positioning context. These tools are best used to frame the session, not to time a single tick.
The VIX as a Fear Gauge
When volatility expectations rise quickly, traders should expect faster moves, wider swings, and a higher chance of failed entries. When volatility compresses, continuation can stall and mean reversion often becomes more important.
The Put/Call Ratio and Positioning Extremes
The put/call ratio can help identify whether traders are leaning too hard in one direction. Extremes often matter more than ordinary readings because crowded positioning can create sharp reversals when the market fails to follow through.
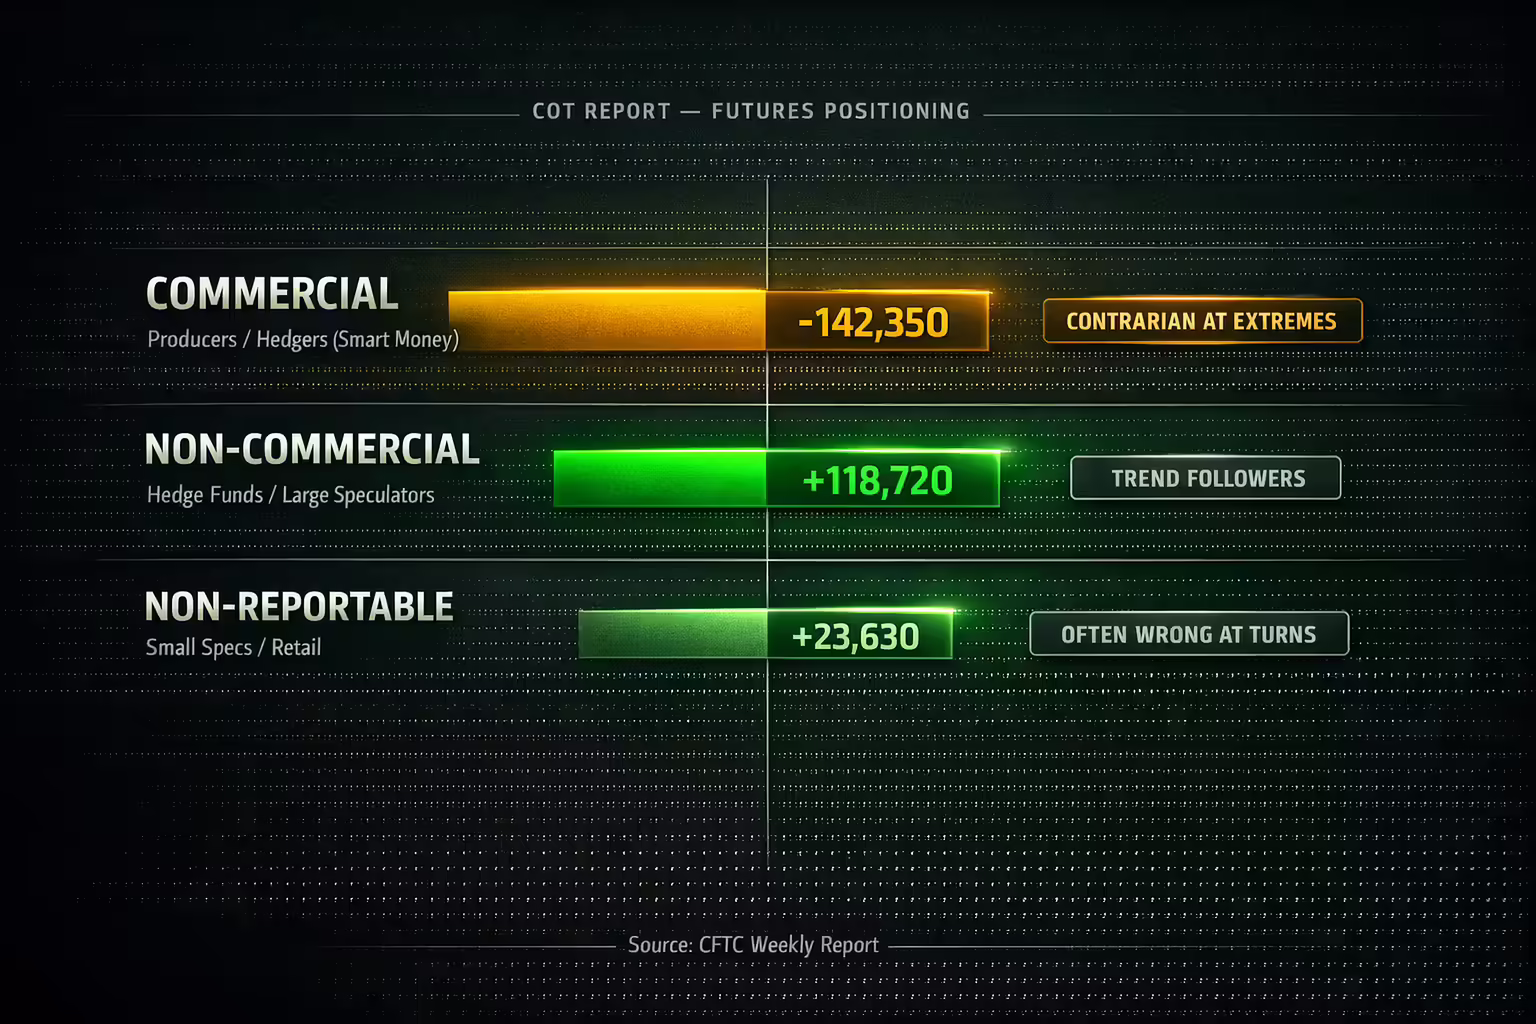
Institutional Sentiment via the Commitment of Traders Report
The COT report is not an intraday timing tool. It is a context tool. It can help a trader see whether large speculators are heavily extended or whether commercial hedgers are leaning the other way.
You can combine that context with price structure and familiar indicators such as the RSI or MACD to ask a better question: is price confirming the positioning backdrop, or starting to diverge from it?
Intraday Market Internals and Real-Time Sentiment
Once the session opens, sentiment needs confirmation. Internals such as $TICK, TRIN, breadth, VWAP behavior, and order flow tell you whether buyers or sellers are actually following through.
$TICK and TRIN
If index futures push higher but internals fail to confirm, the move may be running out of support. If the market keeps holding strong readings after pullbacks, sentiment is supporting continuation.
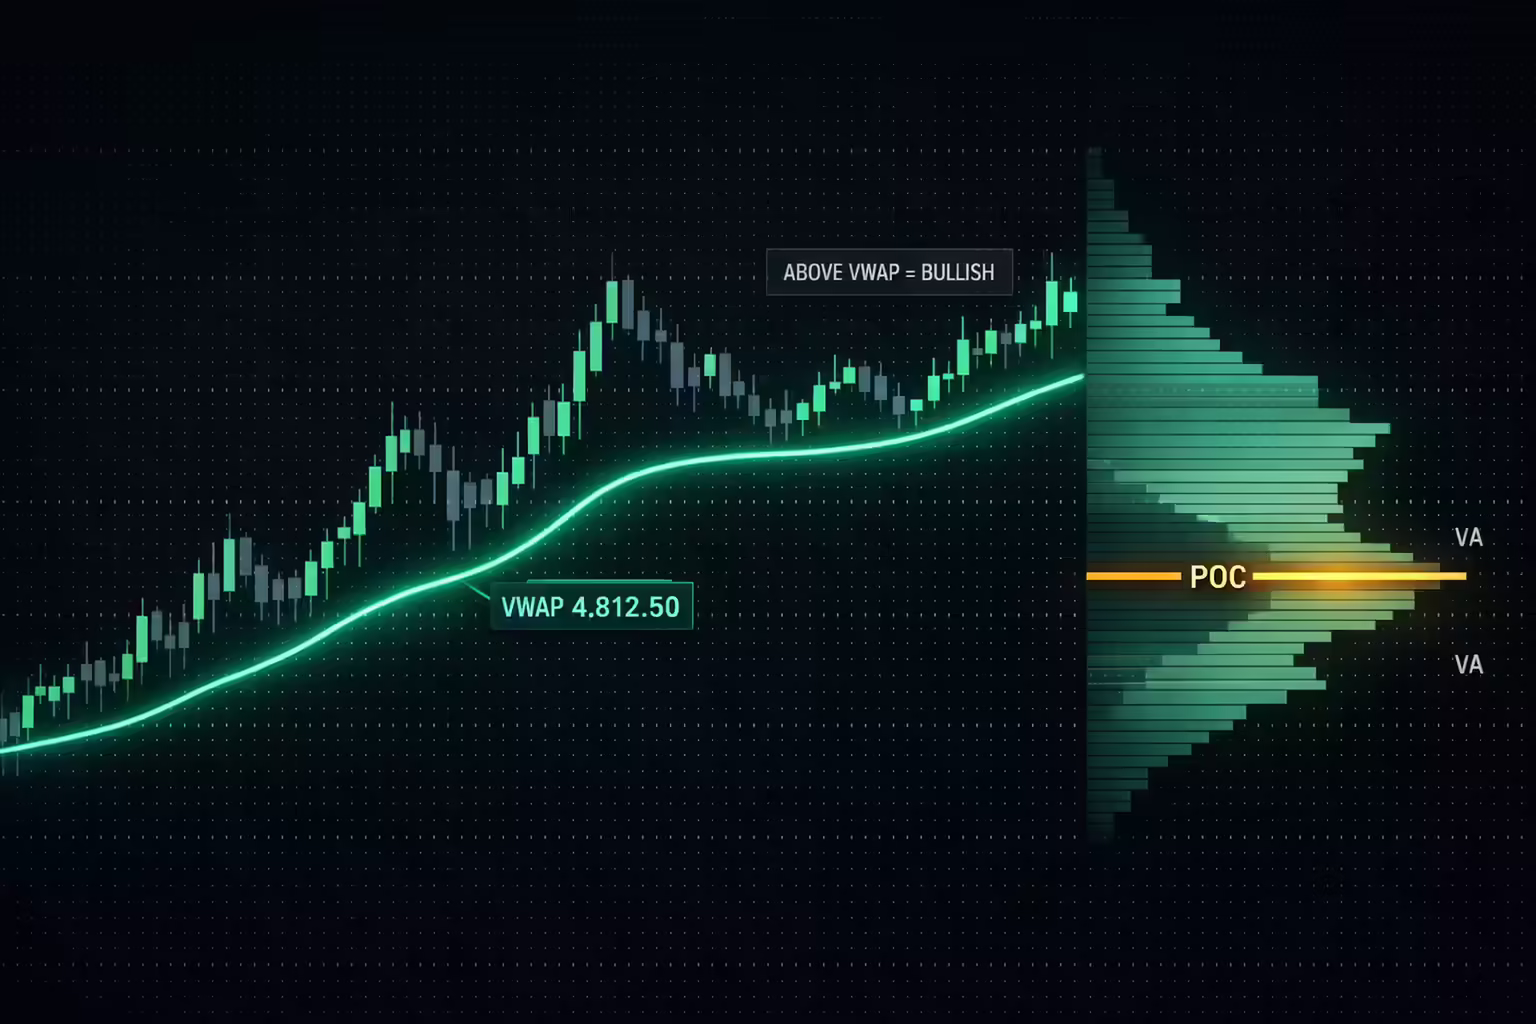
Structural Sentiment via VWAP, Market Profile, and Order Flow
VWAP helps traders judge whether price is being accepted above or below value. Market Profile helps frame where the market is building acceptance or rejection. Order flow helps identify whether aggressive buyers or sellers are truly in control.
That makes these tools especially useful for scalpers and active intraday traders who need fast confirmation before taking risk.
Sentiment Analysis Workflow for Day Traders
- Start with the regime. Decide whether the session is opening in a calm, fearful, or mixed environment.
- Wait for confirmation. Use internals such as $TICK, TRIN, VWAP behavior, and order flow to confirm the read.
- Define the trigger. Enter only when price confirms with a pullback, breakout, reclaim, or failed auction.
- Set invalidation. Place the stop where the sentiment story clearly breaks.
- Pre-plan the exit. Know before entry whether the trade is a continuation play or a fade.
Two Practical Sentiment Trade Examples
Trend Day Example
If futures open strong, hold above VWAP, and internals stay firm, sentiment is supporting continuation.
- Trigger: Buy the first clean pullback that reclaims the opening drive.
- Stop: Exit if price loses VWAP and internals stop confirming.
- Sizing: Start with routine size and add only if structure keeps holding.
Mean-Reversion Day Example
If the open stretches into an emotional extreme but breadth stops improving, sentiment may be exhausted rather than strengthening.
- Trigger: Fade the failed extension after the extreme is rejected.
- Stop: Exit if price quickly retakes the extreme and internals re-accelerate.
- Sizing: Keep targets modest and size smaller than a clean trend setup.
Social Media Sentiment and Behavioral Risk
Social chatter can matter at extremes, but it is usually secondary to price, breadth, and order flow. The bigger risk is psychological: traders often use sentiment to justify a trade they already want to take.
That is why process matters more than opinion. If sentiment, structure, and confirmation do not line up, staying flat is often the best decision.
How to Apply Sentiment Inside a Prop Firm Rule Set
Sentiment should fit the actual rules of the account you are trading. Because firm-specific details can change, confirm the current requirements directly in the official Tradeify materials before using this section operationally.
- [TRADEIFY_DRAWDOWN_RULE]: Match your stop placement to the account loss framework before taking a sentiment-based trade.
- [TRADEIFY_CONSISTENCY_RULE]: Avoid using one high-volatility session to carry a full evaluation or payout cycle.
- [TRADEIFY_HOLD_TIME_RULE]: Make sure your execution style still qualifies under the current holding-time requirements.
- [TRADEIFY_ACCOUNT_TIER_RULES]: Verify any plan-specific limits, thresholds, or payout conditions before sizing up.
Related reading: intraday futures volatility analysis, consistency rule guide, and funded trader psychology.
Conclusion
Sentiment analysis is most useful when it improves execution quality. Start broad, confirm with internals, let price trigger the trade, and respect invalidation. That keeps sentiment practical instead of theoretical.
Disclaimer: This article is for educational purposes only and is not trading or investment advice.
.svg)
.svg)
.svg)


.webp)

