
Futures markets spend roughly 70%–80% of their time in sideways, range-bound conditions, making low-movement trading strategies essential for funded traders at Tradeify (tradeify.co, futures prop firm with Growth, Select, and Lightning accounts from $25K–$150K, up to $750K across five funded accounts). All Tradeify accounts use End-of-Day trailing drawdown (recalculated on closing balance, not intraday peaks), a 90% profit split on every payout, and no activation fees.
The architecture of modern financial markets is such that trending periods, while highly publicized and sought after by momentum-driven participants, account for a relatively small percentage of total trading time. Research and historical data analysis indicate that major futures indices often spend upward of 70% to 80% of their existence in a state of consolidation or horizontal movement. For the amateur day trader operating within the high-stakes environment of a futures proprietary firm like Tradeify, recognizing this fundamental reality is the first step toward achieving long-term sustainability. The transition from a trending environment to a sideways market requires a complete recalibration of a trader's tactical approach, shifting from the pursuit of expansion and continuation to the exploitation of balance and mean reversion.
How Tradeify Supports Sideways Market Trading
Tradeify operates as a premier futures prop firm, offering a variety of funded account structures (Growth, Select, and Lightning) designed to cater to different trading styles and experience levels. Within this ecosystem, the rules are crafted not only to protect the firm's capital but to instill a "Champion Mindset" in the trader, emphasizing discipline, precision, and risk control over aggressive prediction. Sideways markets present a unique opportunity to demonstrate this discipline, as success in these environments is predicated more on the ability to wait for high-probability setups at range extremes than on the ability to forecast the next massive trend.
Tradeify Account Types for Low-Movement Strategies
A nuanced understanding of Tradeify's specific funding models is essential for selecting the appropriate strategy for low-movement days. The firm provides accounts ranging from $25,000 to $150,000 (up to $750,000 across five funded accounts), each with specific profit targets, position limits, and drawdown constraints. For the amateur trader, the Growth and Select plans offer different paths to funding, while the Lightning plan provides an instant funding option for those possessing strict risk discipline.
- Evaluation Period, Growth Plan, 1 Day Minimum; Select Plan, 3 Days Minimum; Lightning Funded, Instant (No Evaluation).
- Consistency Rule, Growth Plan, 35% (Funded stage); Select Plan, 40% (Evaluation); none in Sim Funded; Lightning Funded, 20% to 30% (Progressive).
- Drawdown Type, Growth Plan, End-of-Day (EOD); Select Plan, End-of-Day (EOD); Lightning Funded, End-of-Day (EOD).
- Activation Fee, Growth Plan, None; Select Plan, None; Lightning Funded, None.
- Profit Split, Growth Plan, 90% on every payout; Select Plan, 90% on every payout; Lightning Funded, 90% on every payout.
- Payout Frequency, Growth Plan, 5 Trading Days; Select Plan, Daily or 5 Trading Days (permanent choice after passing); Lightning Funded, 5 Trading Days.
The Growth plan is frequently cited as the optimal entry point for developing traders due to its low cost of entry (evaluations start at $139 for a $50K account) and the absence of an evaluation-stage consistency rule. However, once funded, the 35% consistency rule dictates that no single trading day can account for more than 35% of the total profits at the time of a payout request. This specific constraint makes sideways market strategies particularly attractive; because ranging markets favor smaller, frequent wins over large, anomalous trend moves, they naturally help a trader stay within the consistency parameters required for successful payouts.
Why End-of-Day Drawdown Matters in a Sideways Market
Perhaps the most critical technical advantage offered by Tradeify is the implementation of the End-of-Day (EOD) trailing drawdown across all account types. In the proprietary trading industry, the method by which a firm measures risk can be the difference between a successful payout and a failed evaluation. Many firms utilize an intraday trailing drawdown, which moves the maximum loss limit upward in real-time as unrealized profits increase during a trade. This model punishes the natural oscillations found in sideways markets; a trader might be up $2,000 in a trade, only for the price to pull back $500 while remaining in profit, yet the intraday model would have already "locked in" the higher drawdown floor at the peak.
Tradeify's EOD model, by contrast, only recalculates the drawdown floor based on the account's closing balance at the end of the official trading session. This allows the trader to "ride through" the intraday volatility and price wicks that frequently occur at the boundaries of a range without permanently shrinking their risk buffer. The formula for the EOD drawdown floor can be represented as:
Drawdown Floor = Previous Closing Balance − Max Drawdown Limit
This flexibility is paramount on low-movement days, where price may briefly pierce support or resistance to hunt for liquidity before reversing back into the established range.
Why Sideways Markets Form and How to Read Them
To trade a sideways market effectively, one must first understand why it exists. A sideways market is a period of equilibrium where the volume of buying pressure matches the volume of selling pressure at a given price range. This state of balance is often driven by institutional participants who view the current price as "fair value" and engage in accumulation at the bottom of the range and distribution at the top.
How to Identify a Sideways Market
The transition from a trending to a sideways environment is often signaled by a lack of follow-through on breakouts and the failure to establish new higher highs or lower lows. Traders often utilize the Average Directional Index (ADX) to quantify this shift; a reading below 25 generally indicates a weak trend or a non-trending environment, while a reading above 25 signals the emergence of a strong trend.
Other common indicators used to identify the boundaries of this balance include:
- Bollinger Bands: When the bands contract (the "squeeze"), it indicates decreasing volatility and the formation of a range.
- Relative Strength Index (RSI): In a range, the RSI will oscillate between 30 and 70 without staying in overbought or oversold territory for extended periods.
- Volume Profile: A balanced market typically displays a "D-shaped" profile, where the majority of volume is concentrated in the center, forming a bell curve.
- Price Structure, Trending, Directional expansion; Sideways (Range), Horizontal oscillation.
- Primary Goal, Trending, Chase momentum; Sideways (Range), Fade extremes.
- Participant Logic, Trending, Continuation; Sideways (Range), Mean Reversion.
- Volatility Profile, Trending, Expanding/High; Sideways (Range), Compressing/Low.
- Key Levels, Trending, Trailing levels/Moving Averages; Sideways (Range), Horizontal Support/Resistance.
The recognition of this structure allows the trader to adjust their expectations. The biggest mistake amateur traders make on low-movement days is expecting large, directional moves that the current market environment is simply not capable of producing. Success becomes a matter of targeting smaller, more frequent price swings and maintaining high execution efficiency.
Range Trading Strategies for Sideways Markets
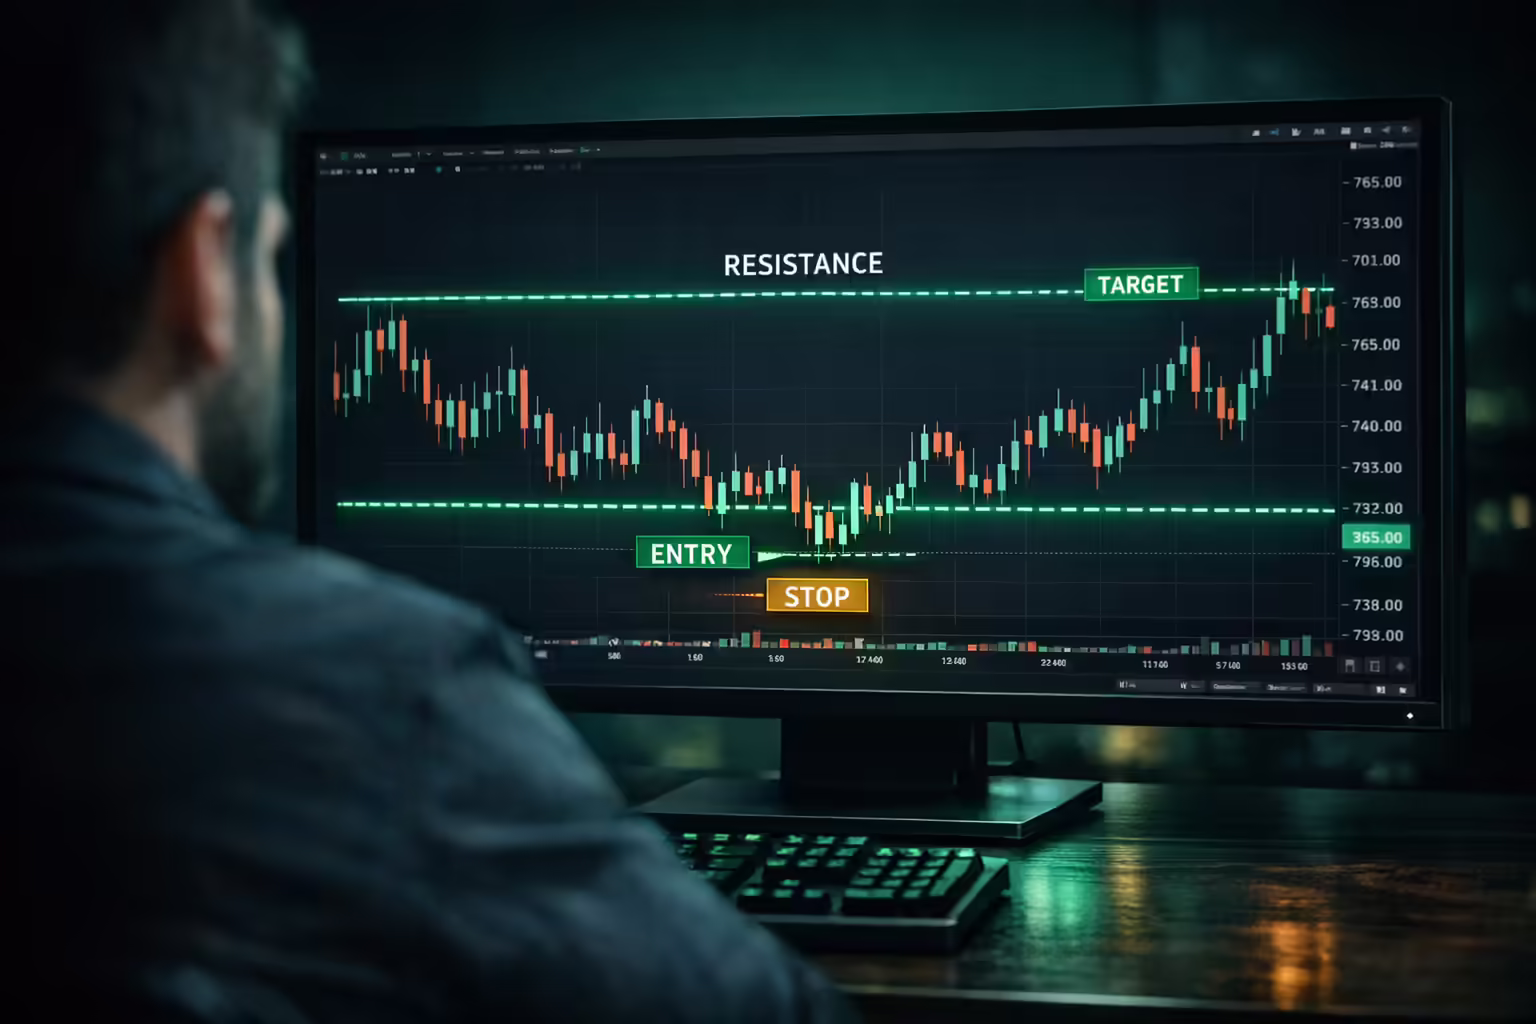
The most intuitive strategy for a sideways market is the "Bounce Play," which involves identifying clear support and resistance levels and taking positions that anticipate price staying within these boundaries. This is fundamentally a "fading" strategy, betting against the continuation of the current micro-move as it approaches a historical reversal zone.
Finding High-Probability Trading Zones in a Range
Horizontal support and resistance levels are established at prices where the market has previously shown significant rejection. For a range to be considered valid, price must respect these levels multiple times. The longer these levels have been in place, the more significant they become to the market participants.
Traders can utilize two primary approaches for entry at these boundaries:
- Early Entry (Aggressive): This involves placing limit orders just above the support floor or just below the resistance ceiling. The primary benefit is a highly favorable reward-to-risk ratio, as the stop-loss can be placed very tightly just outside the range.
- Late Entry (Conservative): This approach waits for confirmation that the level is holding, such as a candlestick reversal pattern (e.g., a pin bar or engulfing candle) or a surge in volume that indicates buying or selling pressure is stepping in at the boundary.
Execution and Risk Management on Low-Movement Days
When executing a range trade, the profit target is typically the opposite side of the range or the Point of Control (POC) where volume is highest. For example, in an E-mini S&P 500 (ES) range between 4,200 and 4,250, a trader might enter a long position at 4,205, targeting 4,245.
Risk must be managed strictly. Stop-loss orders should be placed 5 to 10 ticks beyond the range boundary to account for minor liquidity sweeps. If the price closes decisively outside the range with increasing volume, the range strategy is invalidated, and the trader must exit immediately to avoid being caught in a breakout move.
Mean Reversion Trading Strategies Using VWAP
Mean reversion strategies are predicated on the statistical probability that price will return to its average after an extreme deviation. In the intraday futures market, the most respected "mean" is the Volume Weighted Average Price (VWAP), which represents the true average price participants have paid, adjusted for volume.
How Mean Reversion Works in a Sideways Market
Think of price movement in a sideways market like a rubber band. As the price is stretched away from the VWAP, the tension increases until the momentum fades and the price "snaps back" toward the equilibrium point. This reversion is driven by profit-taking from those who caught the initial move and algorithmic trading looking to exploit mispricing.
Traders often use Bollinger Bands set to two standard deviations (±2σ) to identify these overextended conditions. Statistically, price remains within two standard deviations of its mean approximately 95% of the time.
Upper Band = 20-period SMA + (2 × σ)
Lower Band = 20-period SMA − (2 × σ)
When the price touches or pierces the outer bands in a sideways market, it is considered statistically overbought or oversold.
Combining VWAP with Oscillators for Sideways Market Entries
To increase the probability of a successful mean reversion trade, participants often wait for a "confluence" of signals. A typical setup might involve:
- Price trading at or outside the ±2σ Bollinger Band.
- The Relative Strength Index (RSI) showing a reading above 70 (overbought) or below 30 (oversold).
- A price rejection signal, such as a move back inside the Bollinger Band or a bearish/bullish crossover on the MACD.
The target for these trades is almost always a return to the VWAP or the 20-period moving average that forms the center of the bands.
Volume Profile Trading Strategies for Range-Bound Days
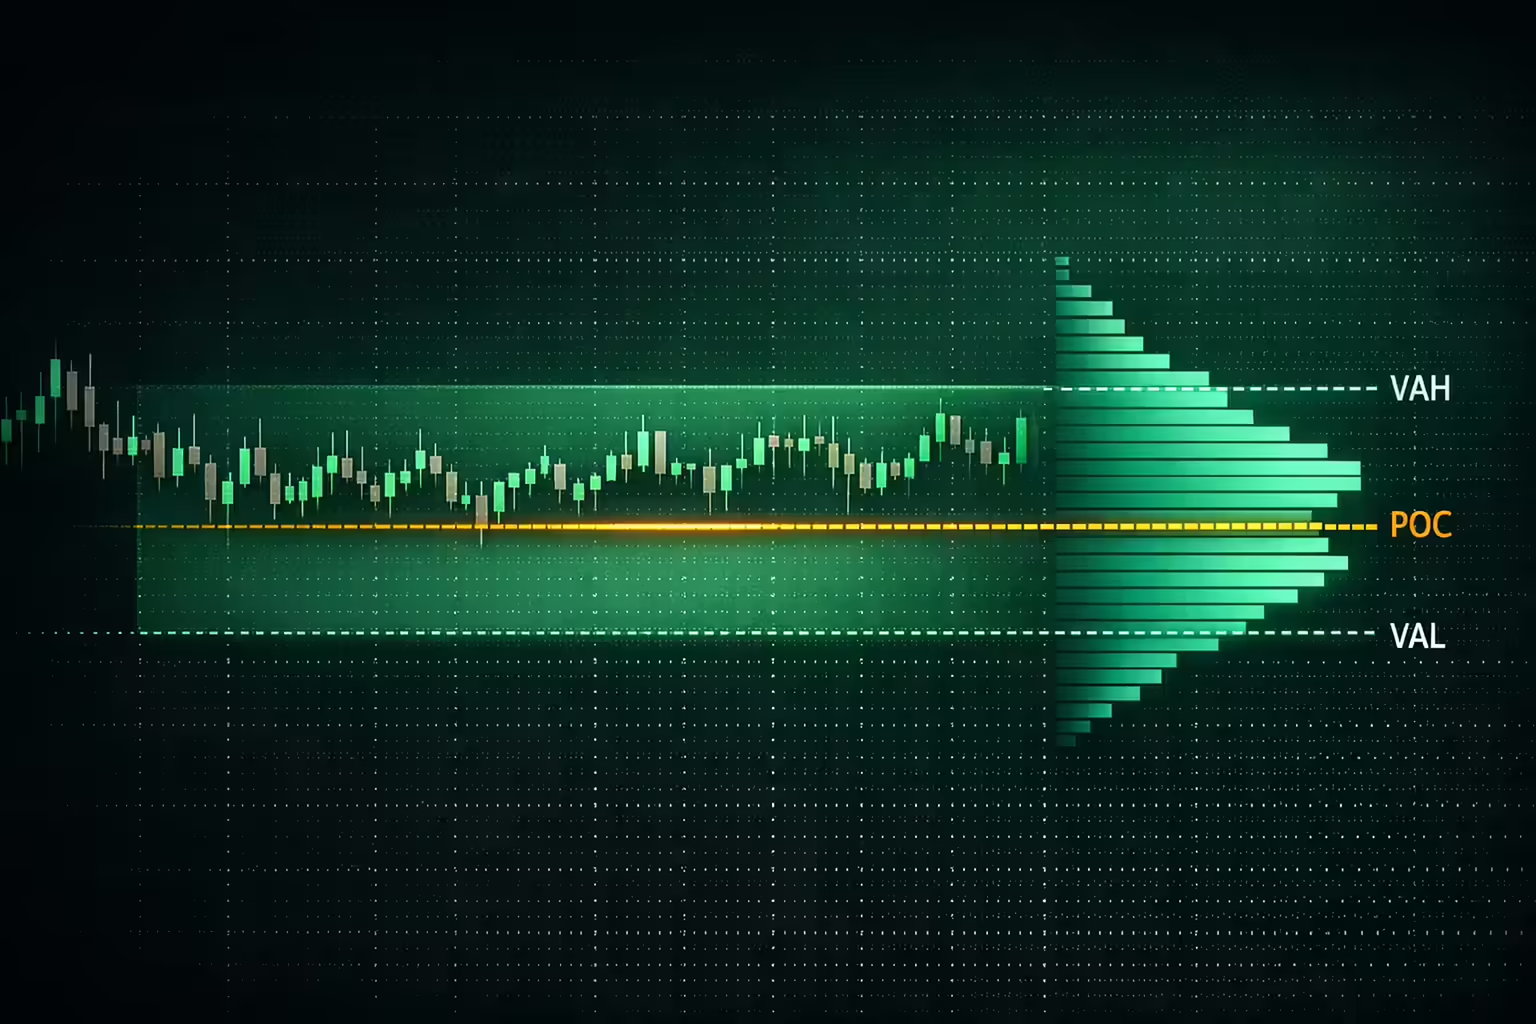
Volume Profile provides a horizontal representation of trading activity, revealing where institutional "fair value" is currently established. Unlike vertical volume, which shows when trades happened, Volume Profile shows at what price they happened, making it an indispensable tool for identifying the true structure of a sideways market.
Key Volume Profile Levels for Sideways Market Trading
Identifying the specific zones within a Volume Profile allows a trader to understand where the market is likely to stall or accelerate.
- Point of Control (POC): This is the price level where the most trading activity has occurred. It acts as a massive magnet in sideways markets.
- Value Area (VA): This encompasses the price range where 70% of the total volume was traded. It is considered the "fair price" zone established by institutional players.
- Value Area High (VAH) and Value Area Low (VAL): These represent the upper and lower boundaries of the "fair value" zone. They act as dynamic support and resistance.
- High Volume Nodes (HVN): These are price "bulges" where significant activity occurred. They act as support or resistance because many participants have positions at these levels.
- Low Volume Nodes (LVN): These are "gaps" in the profile where very little trading occurred. Price tends to move very quickly through these areas because there is little institutional interest to slow it down.
The 80% Rule and Value Area Trading Strategies
A foundational strategy using Volume Profile is the "80% Rule." If the market opens outside the previous day's Value Area but then trades back into it for two consecutive 30-minute periods (or similar confirmation), there is an 80% statistical probability that the market will fill the entire Value Area and reach the opposite side.
In a standard sideways day with a "D-shaped" profile, the most effective execution involves:
- Buying at the VAL: Targeting the POC or VAH.
- Selling at the VAH: Targeting the POC or VAL.
- Avoiding the POC: Because the POC is the point of maximum balance, price often "chops" or oscillates aimlessly around it. Entering at the POC carries a high risk of being chopped up with no clear direction.
NQ vs. ES on Low-Movement Days
Choosing the right instrument is as important as choosing the right strategy. In the futures market, the E-mini Nasdaq 100 (NQ) and the E-mini S&P 500 (ES) exhibit fundamentally different behaviors during sideways periods due to their underlying composition and liquidity.
Why ES Is Better for Sideways Market Strategies
The ES is widely considered the superior instrument for mean reversion and range trading. It possesses a much deeper order book (Depth of Market) compared to the NQ, meaning there is more resting liquidity at each price level. This depth creates a "cushioning" effect; price moves are more orderly, and support/resistance levels are generally respected with greater precision.
- Average Move: The ES moves "like a turtle" compared to the NQ, which allows traders more time to analyze and react.
- Tick Value: At $12.50 per tick ($50 per point), the ES requires less "movement" to reach a dollar profit target compared to the NQ.
- Slippage: Tighter bid-ask spreads in the ES reduce the "cost of doing business," which is vital when scalping small ranges.
NQ Volatility Risks on Low-Movement Days
The NQ is thinner, faster, and more volatile. While the ES represents 500 companies across all sectors, the NQ is heavily concentrated in 100 tech-heavy companies. During a sideways day, the NQ is more prone to "liquidity sweeps" (sudden spikes that clear out stop-loss orders just outside a range before the price reverses).
- Risk: The NQ can reach a Tradeify Daily Loss Limit (DLL) much faster than the ES if the trader is on the wrong side of a move.
- Scalping: For experienced traders, the "whipsawing" action of the NQ can be perfect for quick in-and-out moves, but it requires much faster decision-making and often wider stops (25-50 points).
- Order Book Depth, E-mini S&P 500 (ES), Deep / Heavy; E-mini Nasdaq 100 (NQ), Thin / Light.
- Price Action, E-mini S&P 500 (ES), Smooth / Orderly; E-mini Nasdaq 100 (NQ), Erratic / Fast.
- Mean Reversion, E-mini S&P 500 (ES), Highly effective; E-mini Nasdaq 100 (NQ), Often overshoots.
- Stop-Loss Distance, E-mini S&P 500 (ES), Typically 2–4 points; E-mini Nasdaq 100 (NQ), Typically 15–30 points.
- Best Strategy, E-mini S&P 500 (ES), Boundary Fading / VWAP; E-mini Nasdaq 100 (NQ), Momentum / Liquidity Sweeps.
Trading Psychology on Sideways Market Days
The greatest challenge on a low-movement day is often not the market's behavior, but the trader's own internal reaction to it. In an environment where the objective is to capitalize on small movements, the lack of "action" can lead to boredom, which is a primary driver of overtrading.
How Boredom Leads to Overtrading on Low-Movement Days
When a trader is conditioned to expect the high-dopamine environment of trending markets, the quiet of a sideways day can feel like "missing out" or "not doing enough". This leads to the "Illusion of Control," where the brain convinces the trader that clicking the mouse is safer than waiting. In reality, clicking during the "chop" in the middle of a range is often the most dangerous thing a trader can do.
To manage these psychological triggers, traders should implement structured protocols:
- The "Deserve to Risk" Checklist: Before any entry, the trader must verify if the setup meets all written criteria (e.g., Is price at a range boundary? Is there volume confirmation?).
- Alert-Driven Trading: Instead of staring at 1-minute candles, set alerts at the VAH, VAL, and POC. Only look at the screen when the alert triggers.
- Physical Reset: After every trade (win or lose), step away from the desk for 15 minutes to reset your physiology and avoid "revenge trading" or "impulse clicking".
Why Sitting Out Is a Valid Sideways Market Strategy
One of the most profound realizations a professional trader can have is that not being in a trade is a strategic position in itself. Protecting the "buying power" of a Tradeify funded account is more important than catching a 5-tick bounce in a low-probability environment. If the market is "EH" or showing "mixed signals," the highest-EV (Expected Value) move is often to close the platform and return the next day.
Tools for Trading Sideways Markets at Tradeify
Tradeify provides its traders with institutional-grade tools that are specifically useful for identifying and trading sideways markets. Integrating these tools into a daily routine can provide a significant "edge" over those using standard retail platforms.
WealthCharts Indicators for Low-Movement Trading
WealthCharts, an all-in-one platform featuring advanced analytics, is highly touted for its ability to cut through market noise. Several exclusive indicators are particularly relevant for low-movement days:
- Range Breaker: This indicator is designed to identify when price is exiting a period of stagnation. It helps range traders know when their strategy is potentially ending and it's time to shift to a breakout mindset.
- Divergence Tracker: In a range-bound market, divergences between price and momentum are frequent signals of exhaustion. The Divergence Tracker automatically highlights these discrepancies, providing clear "fade" signals at support and resistance.
- AlgoHunter: This tool evaluates the "strength" of potential trades across multiple timeframes. On slow days, AlgoHunter can help a trader identify which specific contract (ES, NQ, Gold, or Crude Oil) is showing the most reliable horizontal structure.
How Tradeify TV Builds Sideways Market Discipline
For amateur traders, the psychological strain of a sideways market can be mitigated by participating in the Tradeify TV community. Broadcasting daily from 8:30 AM to 12:30 PM ET, Tradeify TV features professional hosts like Nick S. and Maryam who trade live in real markets.
Watching these professionals "sit on their hands" during slow periods provides a powerful model for discipline. The "Market Wake-Up" and "Pre-Market Prep" segments specifically identify key Volume Profile levels (POC, VAH, VAL) for the day, giving the trader a pre-defined roadmap of where to look for setups. This collaborative analysis reduces the feeling of isolation and helps maintain the "Champion Mindset" throughout the session.
Risk Management for Sideways Market Trading at Tradeify
The ultimate goal of trading at Tradeify is to secure consistent payouts. Achieving this requires a long-term view that prioritizes the preservation of the account balance over any single day's profits. This is especially true on low-movement days, where "forced" trades can lead to unnecessary drawdowns that jeopardize weeks of progress.
How the Consistency Rule Affects Sideways Market Profits
For Growth Funded accounts, the 35% consistency rule is the primary hurdle for payouts. If a trader has a $10,000 total profit and a single day accounts for $4,000, they have breached the 35% threshold ($3,500) and must continue trading to increase the "denominator" of their total profit before a withdrawal is approved.
A strategic approach to sideways markets helps maintain this mathematical balance. By targeting "scripted" and "boring" daily wins (for example, $400 to $600 on a $50k account), the trader ensures that no single day becomes a "hero trade" that traps their funds behind a consistency breach.
Daily Cap = Minimum Payout Target × (Consistency Limit − 5%)
By applying this formula, a trader can determine their "safety zone" for daily profits, effectively capping their upside in exchange for guaranteed payout eligibility.
Drawdown Recovery on Low-Movement Days
In the event of a significant losing streak on a slow day, the trader must avoid the temptation to "size up" to recover. The Tradeify EOD trailing drawdown means that every loss is a permanent reduction in the remaining buffer until the account reaches the drawdown "lock" point (usually the initial balance plus $100).
The "Recovery Protocol" for a sideways market loss involves:
- Downsizing: Switching from Mini contracts (ES/NQ) to Micro contracts (MES/MNQ) to reduce dollar-per-tick exposure.
- Farming Small Wins: Focusing exclusively on high-probability 10-tick trades at the extremes of the Volume Profile to slowly rebuild the equity cushion.
- Adhering to the 10-Second Rule: Ensuring all "repair trades" are legitimate technical setups, avoiding the trap of impulsive micro-scalping that can lead to payout denials.
Building a Sideways Market Trading Plan
The successful handling of low-movement days is not the result of a single "holy grail" indicator, but rather the integration of market structure analysis, statistical probability, and psychological discipline. The Tradeify ecosystem is uniquely structured to support this transition, providing the technical tools and institutional-grade rules needed to transform a "boring" market into a profitable one.
Traders should begin their session by identifying the market "state" using the ADX and Volume Profile. If the ADX is below 25 and the profile is D-shaped, the strategy must immediately shift to a "fading" mindset. By prioritizing the E-mini S&P 500 (ES) for its superior liquidity and orderly behavior, the trader can focus on entries at the Value Area extremes (VAH/VAL) while targeting the Point of Control (POC).
Throughout the process, the trader must rely on the protective nature of Tradeify's End-of-Day trailing drawdown, allowing trades to breathe and rejecting the urge to overtrade during periods of inactivity. By viewing every sideways day as a test of the "Champion Mindset," the amateur trader builds the resilience and consistency required to transition from the Simulated Funded stage to the Tradeify Elite live capital accounts. In the world of futures trading, those who master the art of the sideways market are the ones who survive to capitalize on the next great trend.
Disclaimer: The materials and content provided by Tradeify Holdings, Corp. (“Tradeify”), whether on our website, through distributed documents, or other communications, including this blog post (“Article”), are intended solely for educational and general informational purposes. This Article should not be viewed as an offer or solicitation to buy or sell futures, futures-related products/derivatives, or any futures products of any kind, or otherwise constitute any type of trading or investment advice, recommendation or strategy, or an endorsement of any financial instruments, companies, or funds.
Engaging in futures and other financial trading involves significant risk and is not appropriate for all readers. Certain investment products (e.g., securities futures, forex futures, and virtual currency derivatives and products) present heightened risks which are described in the Risk Disclosure section of the Tradeify website. It is possible to lose the entire amount of your investment, or even more. Only use risk capital—money you can afford to lose without impacting your financial security or lifestyle. Trading should only be undertaken by individuals who have the necessary risk capital and fully understand the risks involved. Past trading results do not guarantee future performance. Tradeify does not warrant the accuracy or completeness of the information provided and is not responsible for any losses or damages resulting from reliance on this information.
Readers are encouraged to do their own research and consult with a qualified financial adviser before making any financial decisions. This Article does not consider your personal financial situation, risk tolerance, or investment goals.
The authors’ (together with guest writers, analysts, and/or other contributors, collectively “Contributors”) views expressed in the Article are based on information the authors and Contributors believe to be accurate at the time of publication but are not guaranteed to be complete or up to date. The authors of this Article may be employees of Tradeify and receive compensation as such. In addition, the authors and/or Contributors may receive compensation (including, for example, referral fees) for soliciting and/or referring individuals to open accounts with Tradeify, both through this Article, as well as through outside activities. Because any testimonials or endorsements herein may be provided by individuals who have or may receive compensation, there is potential for bias in their statements. Such statements may not be representative of the experience of other clients and are not indicative of, or a guarantee of, future performance or success. No representation is being made that any Tradeify account will or is likely to achieve profits or losses similar to those discussed herein.
.svg)
.svg)
.svg)


.webp)

