.svg)

.svg)
.svg)

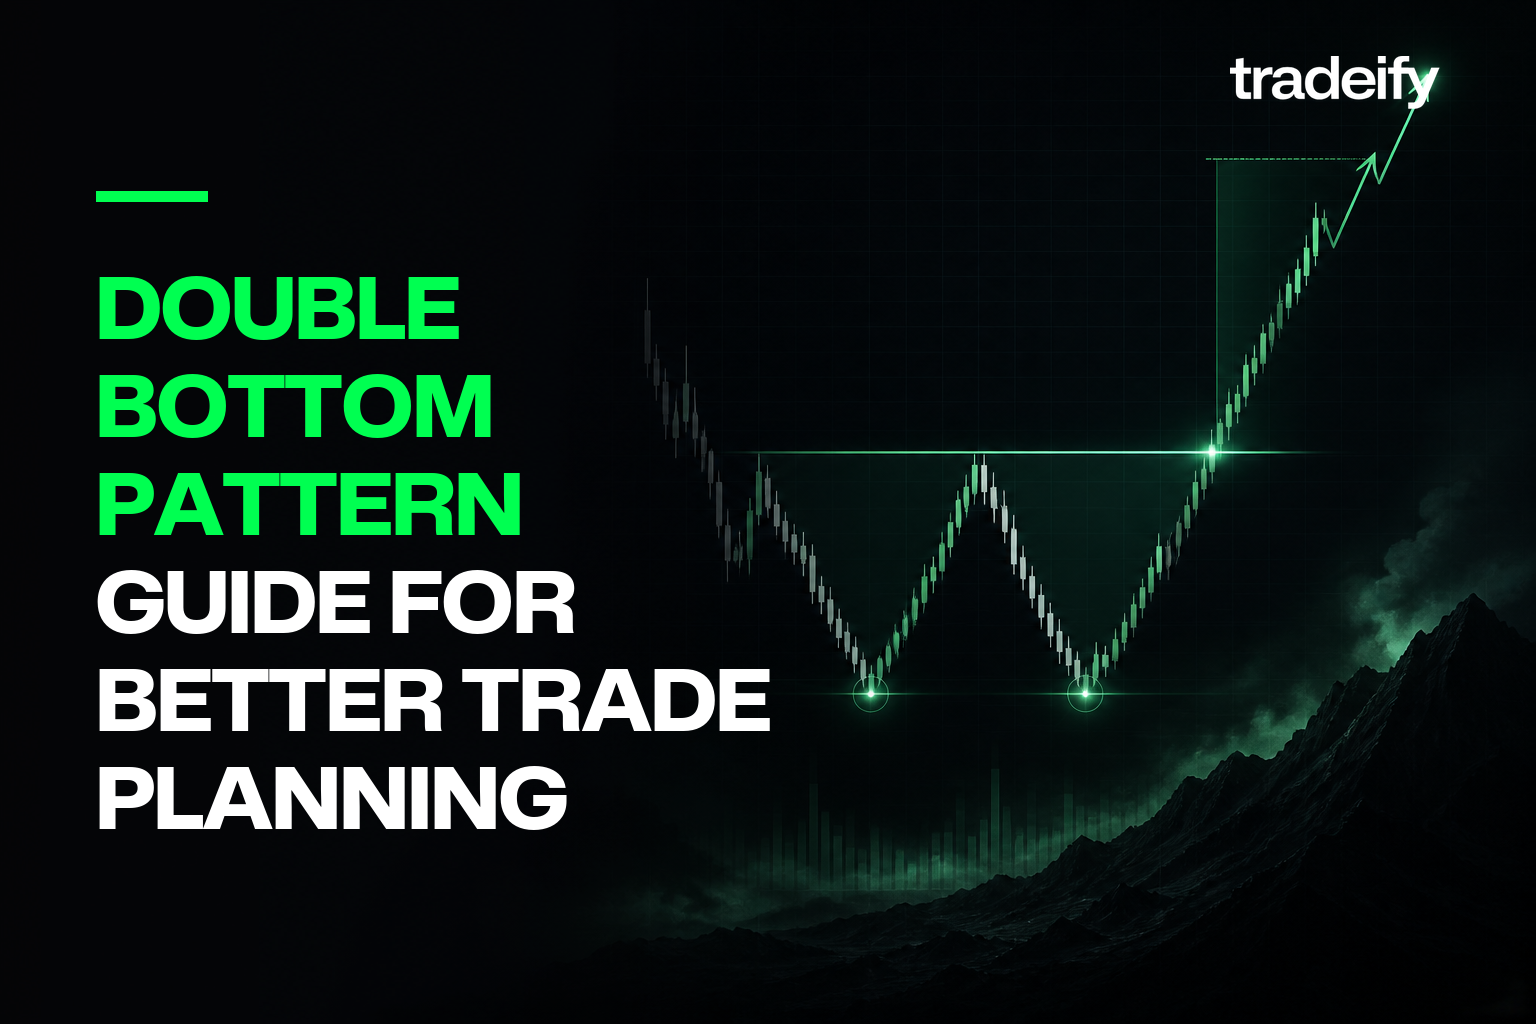


TL;DR: A double bottom pattern is a potential bullish reversal that forms after a decline, tests a similar support zone twice, and creates a resistance level at the rebound high between those tests. The W shape alone is not confirmation. Many traders wait for price to close above that resistance level, called the neckline, then use the pattern low as an invalidation reference and the pattern height as a possible measured-move objective. For futures and prop-firm traders, the setup is only usable when the stop distance, contract size, and total trade risk fit the account’s loss limits. False breakouts happen, measured targets are not promises, and no universal success rate applies across every market, time frame, or execution plan.
Table of Contents
- What a double bottom pattern actually shows
- How to identify a double bottom pattern
- When a double bottom pattern is confirmed
- Read three double bottom states before trading
- How to trade a double bottom pattern
- A double bottom futures example
- Why double bottom patterns fail
- How prop-firm traders can manage the pattern
- Double bottom pattern checklist
- Double bottom pattern FAQs
What a Double Bottom Pattern Actually Shows
The difficult part is not seeing a W on a chart. You will find W-shaped price action everywhere, especially on fast intraday time frames.
The real question is whether the structure shows a meaningful change in control.
A double bottom pattern begins after a decline. Price reaches a low, rebounds, and then returns to roughly the same support area. If sellers cannot extend the decline and buyers push price back above the rebound high between the two lows, the market may be shifting from a downtrend toward an uptrend.
That middle rebound high is the neckline. It matters because the two lows only show that support held twice. A move above the neckline provides evidence that price has also overcome the resistance created during the rebound.
CME Group’s technical analysis education describes the confirmation signal for a double bottom as a break above the high formed between the lows. CME also warns that patterns are indications, not absolute rules about what price will do next.
Double Bottom Pattern Structure
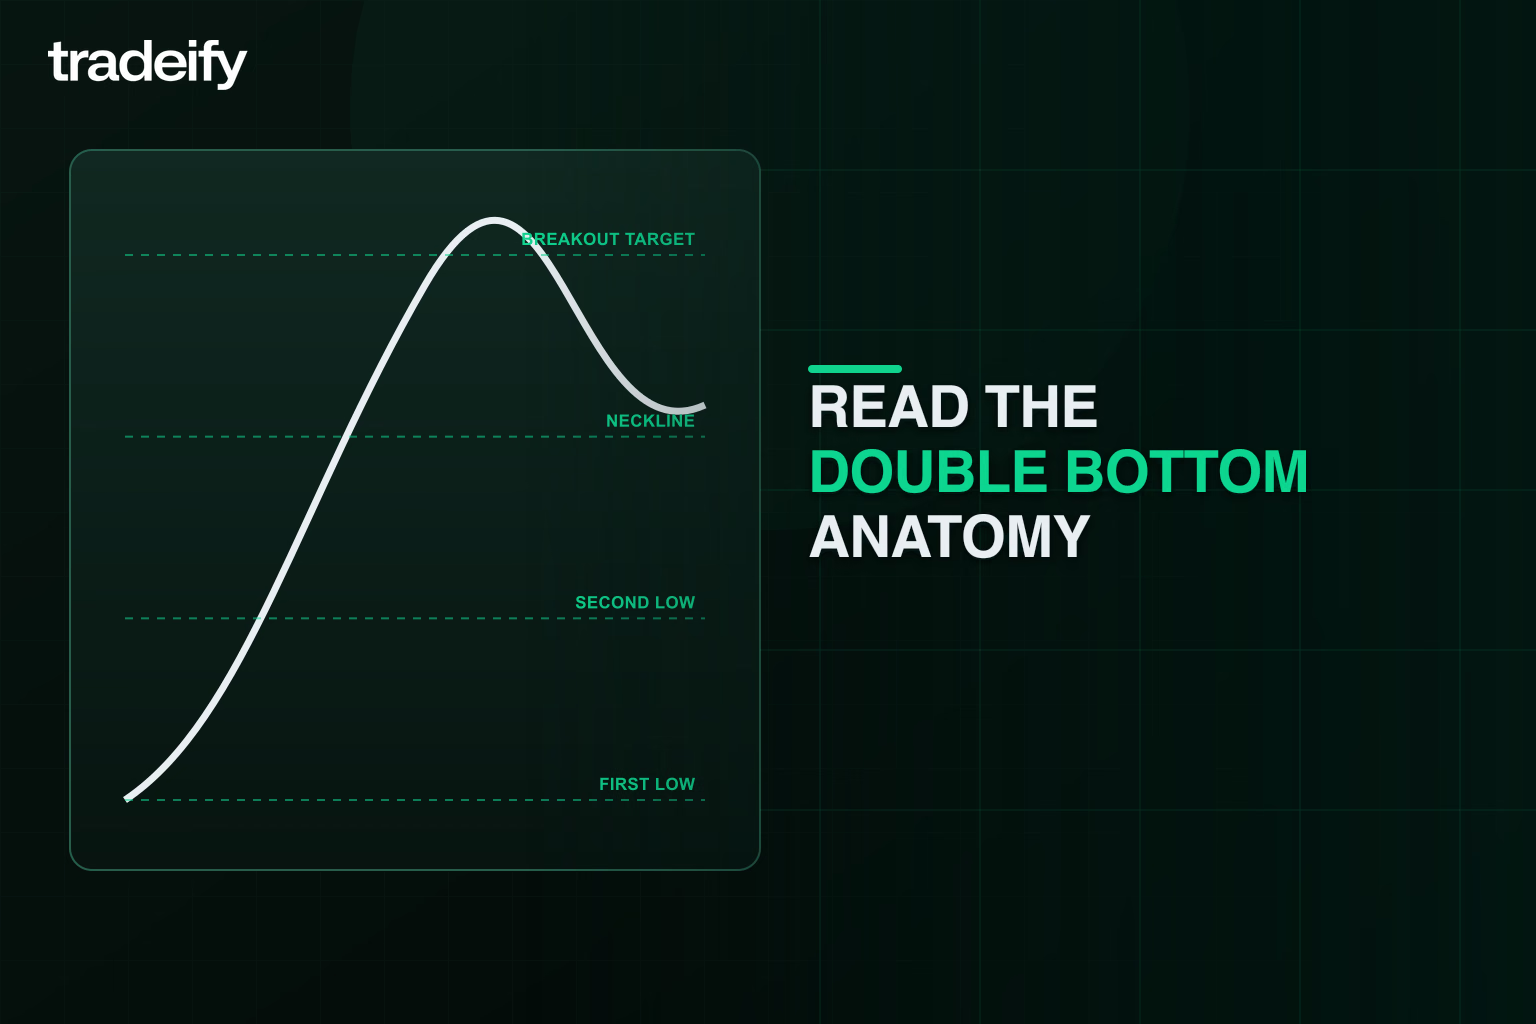
A practical double bottom has five parts:
- A visible decline into the setup.
- A first low where selling pauses and price rebounds.
- An intermediate high that defines the neckline.
- A second test of the support area.
- A move above the neckline that confirms the pattern.
Before step five, you have a developing pattern. You do not yet have a confirmed double bottom.
How to Identify a Double Bottom Pattern
Good pattern recognition starts with context. If you begin with the W shape, your eyes can force the label onto ordinary market noise.
Confirm the Double Bottom Follows a Decline
A double bottom is a reversal pattern, so it needs something to reverse. Look for a clear sequence of lower highs and lower lows, or at least a sustained move down into the first low.
If price has been moving sideways, two similar lows may simply mark the bottom of a range. That can still create a tradable breakout, but it is not the same claim as a downtrend reversal.
Mark the Two Double Bottom Support Tests
The lows do not need to match tick for tick. Markets often react to zones rather than perfect horizontal lines.
Judge the two tests relative to the contract’s normal volatility and the time frame you trade. A difference that is trivial on a daily chart may be large on a one-minute chart. The important question is whether both lows represent repeated defense of the same general support area.
The second low can be slightly higher or slightly lower than the first. What matters more is what happens next. If price keeps accepting below the first low, the support thesis is weakening. If price rejects the area and reclaims the neckline, the reversal case becomes stronger.
Draw the Double Bottom Neckline
Mark the highest point of the rebound between the two lows. That level is the neckline and the pattern’s key resistance.
Do not draw it through whichever candles make the setup look cleanest. Use the actual swing high. If the rebound created a broad, messy resistance area, treat the neckline as a zone and plan around that uncertainty.
Read Double Bottom Volume as Supporting Evidence
Increasing volume as price completes a reversal can strengthen the signal, according to CME Group. It can show that the breakout has participation behind it.
Volume is still supporting evidence, not a guarantee. Futures traders should also account for the contract, session, and time of day. A volume reading during a liquid regular session does not carry the same context as a thin overnight move.
The broader principle is confirmation. Charles Schwab’s chart-reading guide notes that individual indicators can produce false signals and that traders often combine price action with tools such as volume or moving averages.
When a Double Bottom Pattern Is Confirmed
A pattern can look obvious and still be incomplete.
Many traders wait for a candle to close above the neckline. A brief trade above resistance that closes back below it may be a failed breakout, not confirmation. The close does not remove risk, but it asks price to prove more than a momentary push through the level.
Breakout Confirmation for the Double Bottom
The simplest confirmation sequence is:
- Price tests the support zone a second time.
- Buyers push price back toward the neckline.
- Price closes above the neckline.
- The breakout holds or price successfully retests the level.
A retest is optional. Sometimes price breaks out and keeps moving. Waiting for a retest can improve the entry location, but it can also mean missing the trade.
This is a trade-off, not a flaw in the method. Your plan should decide in advance whether you enter the breakout, wait for a retest, or skip the setup if neither entry fits your risk.
Double Bottom Confirmation Does Not Mean Certainty
Even a clean close above the neckline can fail. Price may reverse immediately, retest the second low, or continue the original downtrend.
That is why confirmation and invalidation belong in the same plan. Confirmation tells you when the idea becomes actionable. Invalidation tells you when the market has disproved the version of the idea you chose to trade.
Read three double bottom states before trading
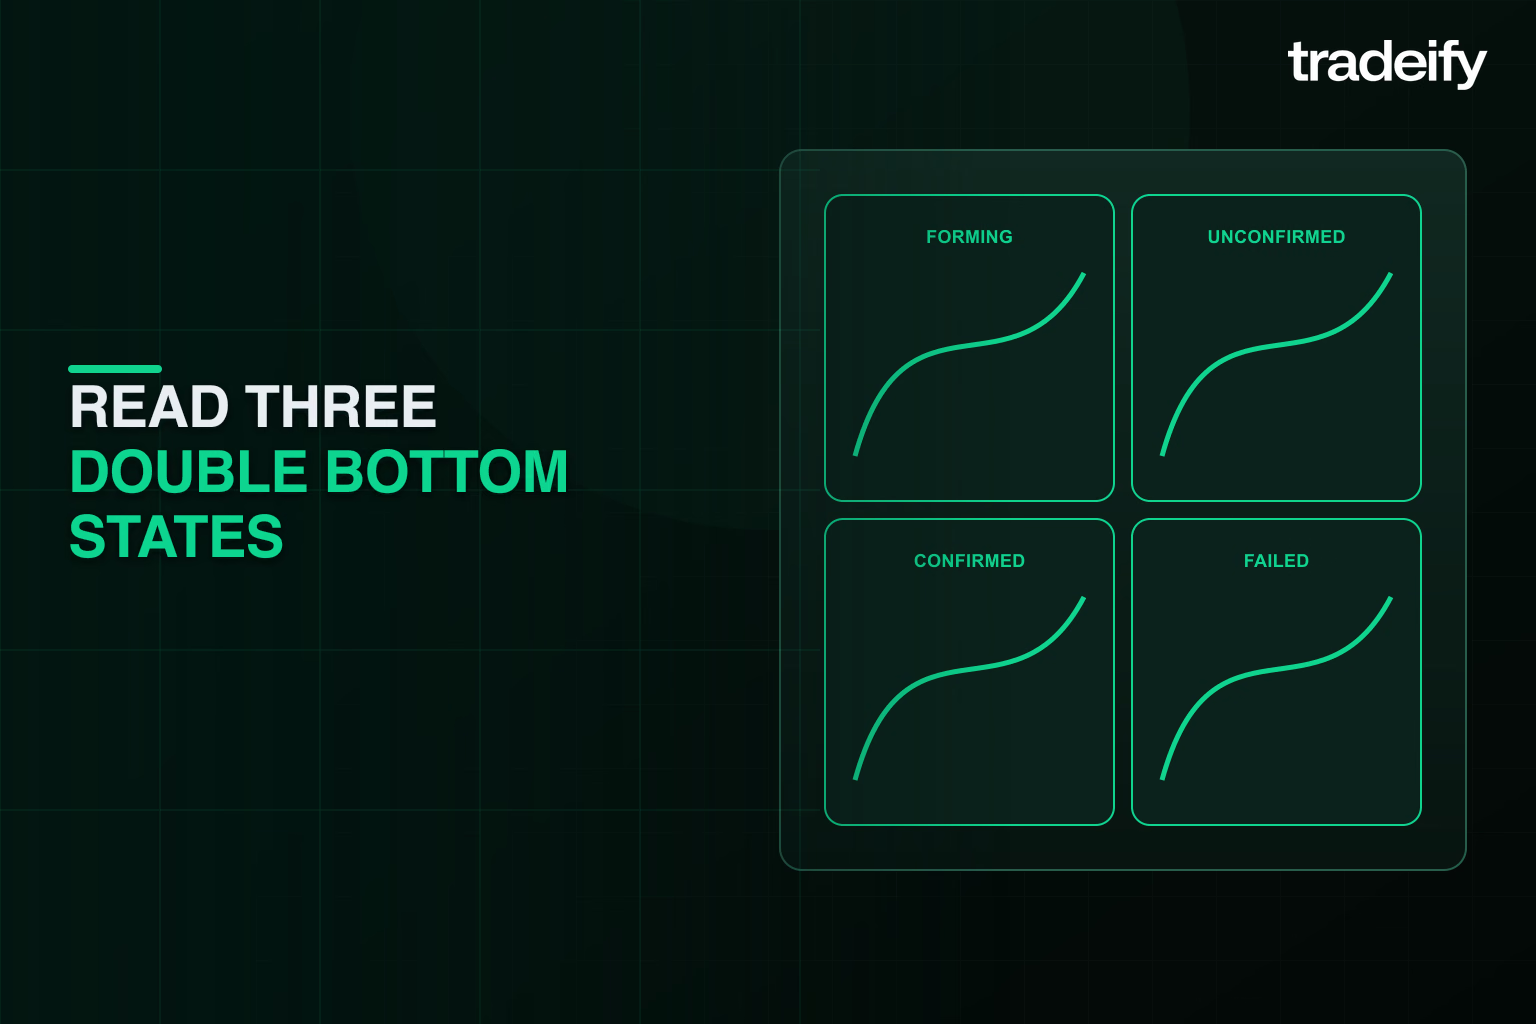
Two charts can show nearly the same W and require different decisions. The difference is not the drawing. It is the evidence available at that moment.
Pattern state | What price has shown | What the trader actually knows | Practical response |
|---|---|---|---|
Developing | Two support tests, but price remains below the neckline | Support held twice. A reversal is still unconfirmed. | Mark the levels and wait for the entry condition in the plan |
Attempted breakout | Price trades above the neckline but closes back below it | Buyers tested resistance, but acceptance above it is missing | Treat the move as a warning, not proof that the pattern worked |
Confirmed and holding | Price closes above the neckline and either holds above it or completes the required retest | The confirmation condition has occurred. Outcome is still uncertain. | Calculate the actual stop distance and take the trade only if the risk fits |
This state-based view prevents a common mistake: trading the completed image before the market has completed the evidence. A screenshot taken later can make the W look obvious. In real time, the developing version and the failed version often look similar until the neckline decision is made.
Label the state before choosing the order. If the label changes, rebuild the trade from the current price, stop, and target. Do not keep the original position size simply because the chart still resembles a W.
How to Trade a Double Bottom Pattern
There is no single required entry. The better choice is the one you can define, size, and execute consistently.
Entry approach | What the trader waits for | Main advantage | Main risk |
|---|---|---|---|
Neckline breakout | A close or decisive move above resistance | Earlier participation if momentum continues | More exposure to a false breakout or an extended stop |
Neckline retest | A pullback that holds the former resistance area as support | Potentially clearer invalidation and better entry location | Price may never retest, or the retest may fail |
Plan the Double Bottom Entry
For a breakout entry, define what qualifies as a break before the move happens. Is it a close above the level, a specific amount of acceptance above it, or a breakout with above-normal volume?
For a retest entry, define what “holds” means. You might require price to reject the neckline zone and close back above it. Avoid changing the rule after entry just to keep a losing trade alive.
Set the Double Bottom Invalidation
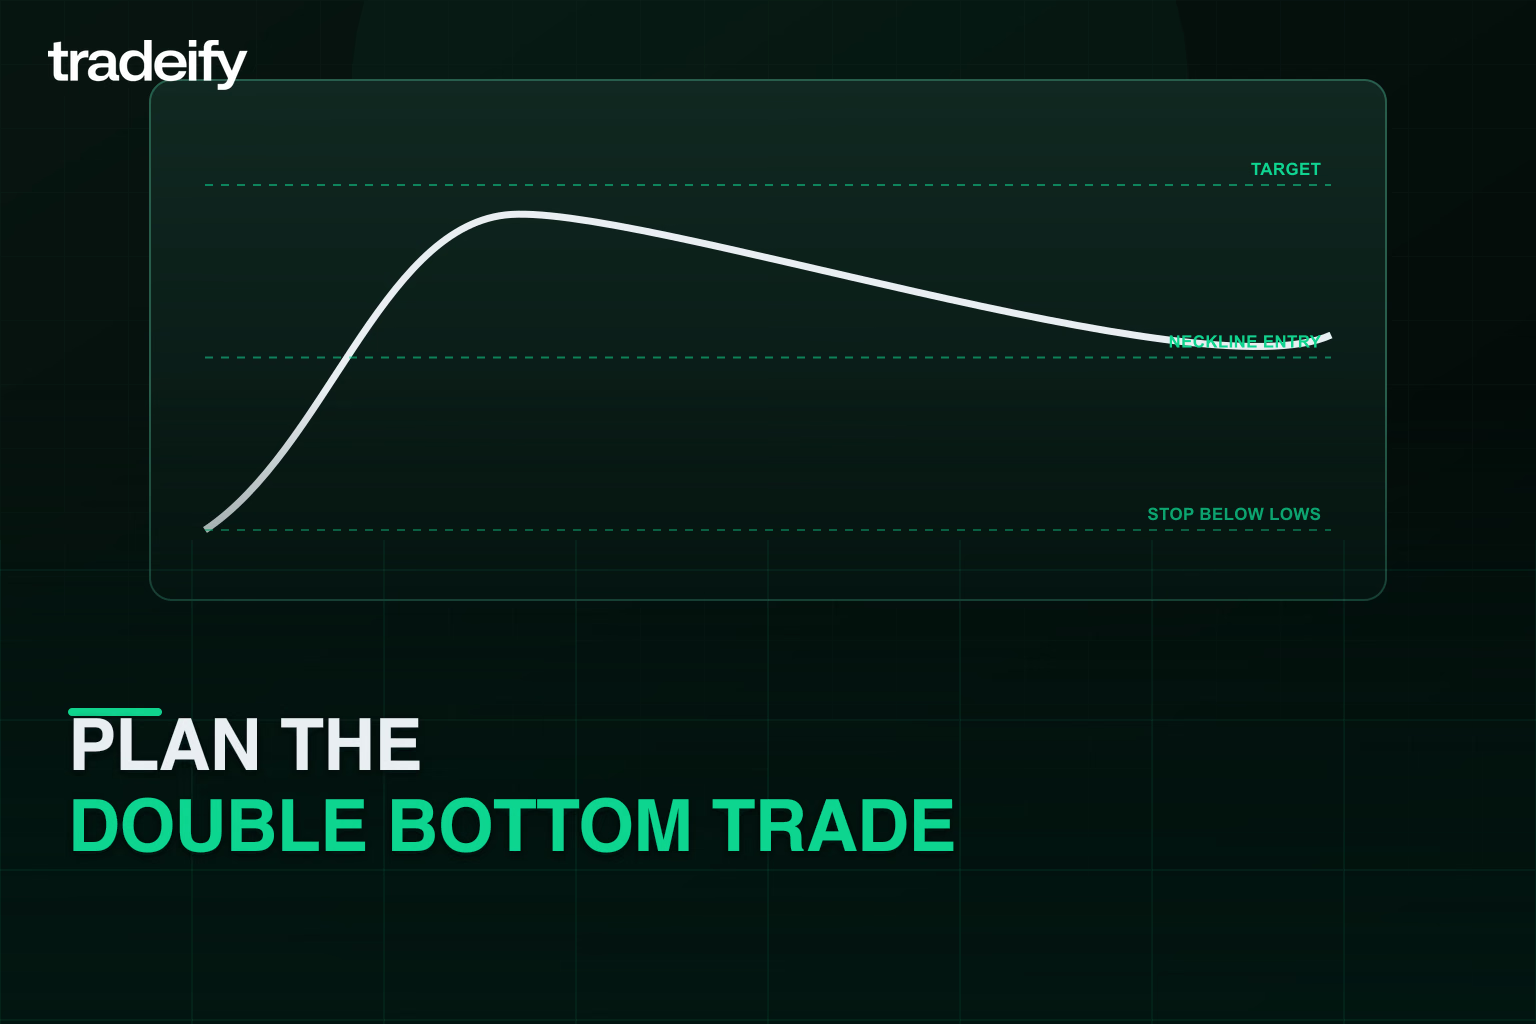
The pattern thesis is under pressure if price breaks and accepts below the support zone created by the two lows. Traders often use a stop below the second low or below the full support area.
The exact stop belongs to the chart, not to a preferred dollar amount. Then position size brings the chart risk down to the account risk budget.
If the logical stop is too far away, use fewer contracts or skip the trade. Pulling the stop inside normal noise just to trade more size changes the setup and can create avoidable losses.
Estimate the Double Bottom Measured Move
The common measured-move method is:
- Measure the vertical distance from the support area to the neckline.
- Add that distance to the breakout level.
If support is near 5,120 and the neckline is 5,160, the pattern height is 40 points. A basic measured objective would be 5,200.
That number is a planning reference, not a forecast. Price can stall before the objective, exceed it, or fail immediately after the breakout. Nearby resistance, market conditions, and your actual reward relative to stop distance still matter.
Size the Double Bottom Trade
Before entering a futures trade, convert the stop distance into money using the contract’s point or tick value:
risk per contract = stop distance × contract value per point
Then calculate:
maximum contracts = allowed trade risk ÷ risk per contract
Round down. If the result is zero, the setup does not fit the risk budget.
This calculation is especially important in an evaluation or funded-account setting. A chart pattern does not get an exception from a daily loss limit, trailing drawdown, or personal risk rule.
A Double Bottom Futures Example
Assume a futures market falls from 5,220 to 5,120, rebounds to 5,160, and then revisits the support area at 5,124. Price rejects the second test and later closes at 5,164.
The structure is:
- First low: 5,120
- Neckline: 5,160
- Second low: 5,124
- Confirmation: close above 5,160
- Pattern height: about 40 points
- Basic measured objective: about 5,200
A breakout trader might plan an entry above 5,160. A retest trader might wait to see whether a pullback holds near 5,160 as support.
Suppose the chosen entry and logical stop create 48 points of risk. The trader must multiply those 48 points by the specific contract’s value per point. If that amount exceeds the trade-risk budget, the answer is not to hope harder. The trader can reduce size, use a smaller related contract when appropriate, or pass.
The measured objective does not make the trade acceptable by itself. The stop location, contract value, slippage allowance, and account constraints decide whether the setup is executable.
Why Double Bottom Patterns Fail
Most bad double bottom trades do not start with a bad drawing. They start with a trader asking the pattern to prove more than it has proved.
Entering the Double Bottom Before Confirmation
The second low can look attractive because the entry is close to support. It is also the point where the downtrend may simply continue.
An early entry can be valid as a separate support-rejection strategy, but it should not be described as a confirmed double bottom. The entry logic, stop, and expected win rate may be different.
Mistaking Double Bottom Noise for Structure
Two nearby lows on a very fast chart may be ordinary back-and-forth movement. Look for a meaningful decline, a visible rebound, and enough separation for the second test to represent a real attempt to break support.
There is no universal number of bars or percentage distance that works across every contract and time frame. Define the pattern in testable terms for the market you trade.
Chasing the Double Bottom Breakout
If price runs far above the neckline before entry, the original stop may create too much risk and the measured objective may offer too little remaining reward.
Missing the clean entry does not create a new obligation to trade. Chasing can turn a sound observation into a poor position.
Ignoring the Failed Double Bottom
A breakout that falls back below the neckline is a warning. A later break below the two-low support zone is stronger evidence that the bullish thesis failed.
Do not widen the stop because the W still looks convincing. Do not add size simply because the market is closer to the lows. Follow the invalidation rule you set before entry.
Forcing Another Double Bottom Trade
One stopped trade can create pressure to recover the loss immediately. That is where a technical setup becomes a discipline problem.
After a failure, pause. Recheck the market structure, remaining risk capacity, and whether the next setup is genuinely new. A revenge trade can do more damage than the original false breakout.
How Prop-Firm Traders Can Manage the Double Bottom Pattern
Prop-firm traders have two jobs at once: read the market and stay inside the account’s rules. A valid-looking pattern does not solve the second job.
Put Double Bottom Risk Before the Target
Start with invalidation and contract risk. Only then compare the possible target with the amount at risk.
If the setup needs a wide stop because the support zone is broad, reduce size. If minimum size still risks too much, skip it. Protecting the account is part of executing the pattern correctly.
Account for Double Bottom Drawdown Pressure
Know how much room remains before the session begins and before every new entry. A breakout trade taken near a daily loss threshold carries more than chart risk. It also carries the risk of losing the ability to trade the rest of the session or damaging account progress.
Avoid stacking correlated positions that express the same reversal idea. Several contracts or markets moving together can turn one thesis into multiple losses.
Keep Double Bottom Rules Repeatable
Write down:
- The market and time frame.
- What qualifies as a prior decline.
- How you define the support zone.
- What confirms the neckline break.
- Whether you allow breakout entries, retest entries, or both.
- Where the setup is invalidated.
- The maximum risk per trade and per day.
- How you handle scheduled market events and thin sessions.
Consistency makes review possible. If the rule changes every time the chart changes, you cannot tell whether the pattern or the execution caused the result.
Double Bottom Pattern Checklist
Before entering, ask:
- Was there a clear decline into the first low?
- Did price make two meaningful tests of the same support zone?
- Is the rebound high between the lows clearly marked?
- Has price actually confirmed above the neckline?
- Does volume or another independent input support the move?
- Is the entry a planned breakout or a planned retest?
- Where is the trade invalidated?
- What is the risk per contract at that stop?
- How many contracts fit the risk budget after rounding down?
- Is there enough room before the next resistance area or measured objective?
- Does the trade fit the account’s current daily and overall drawdown constraints?
- What will you do if the breakout fails?
If those answers are not clear, the setup is not ready.
Double Bottom Pattern FAQs
Is a Double Bottom Pattern Bullish?
It is a potential bullish reversal pattern because it shows price testing support twice and then attempting to break the resistance between those tests. It is not confirmed until price breaks above that neckline under the trader’s defined rule.
Do Both Double Bottom Lows Have to Match?
No. Treat support as an area, not a requirement for identical prices. The acceptable difference should reflect the market’s volatility and the chart time frame. What happens after the second test matters more than a perfect visual match.
What Is the Best Double Bottom Time Frame?
There is no single best time frame. The pattern can appear on intraday, daily, or weekly charts. Faster charts usually contain more noise and more apparent W shapes, while slower charts take longer to confirm. Use a time frame that matches your holding period, then define and test the setup on that market.
What Is the Double Bottom Pattern Success Rate?
There is no universal success rate worth applying to every trade. Results change with the pattern definition, market, time frame, session, confirmation rule, stop, target, slippage, fees, and sample period.
A useful number must come from a documented backtest or trade log that matches your actual rules. Treat any unsupported percentage as marketing, not a risk assumption.
What Is the Difference Between a Double Bottom and a Double Top?
A double bottom follows a decline and looks for a bullish break above the high between two lows. A double top follows an advance and looks for a bearish break below the low between two highs. The structures are inverse versions of the same support-and-resistance idea.
Is a Double Bottom the Same as an Inverse Head and Shoulders?
No. A double bottom has two main lows. An inverse head and shoulders has three troughs, with the middle trough usually lower than the two shoulders. Both are potential bullish reversals, and both still require confirmation and risk control.
Trade the Double Bottom Plan, Not the Shape
A double bottom pattern can organize a trade, but it cannot remove uncertainty.
Wait for the evidence your plan requires. Mark the neckline. Define invalidation before entry. Convert the stop into contract risk. Check the result against the account’s limits, and be willing to pass when the numbers do not fit.
The W gets your attention. The risk plan decides whether there is a trade.
Risk note: Futures trading is complex and involves a substantial risk of loss. This article is educational, not financial advice. Review the CFTC’s futures market basics and understand the contract and account rules before trading.
.svg)
.svg)
.svg)
.svg)









.webp)