.svg)

.svg)
.svg)

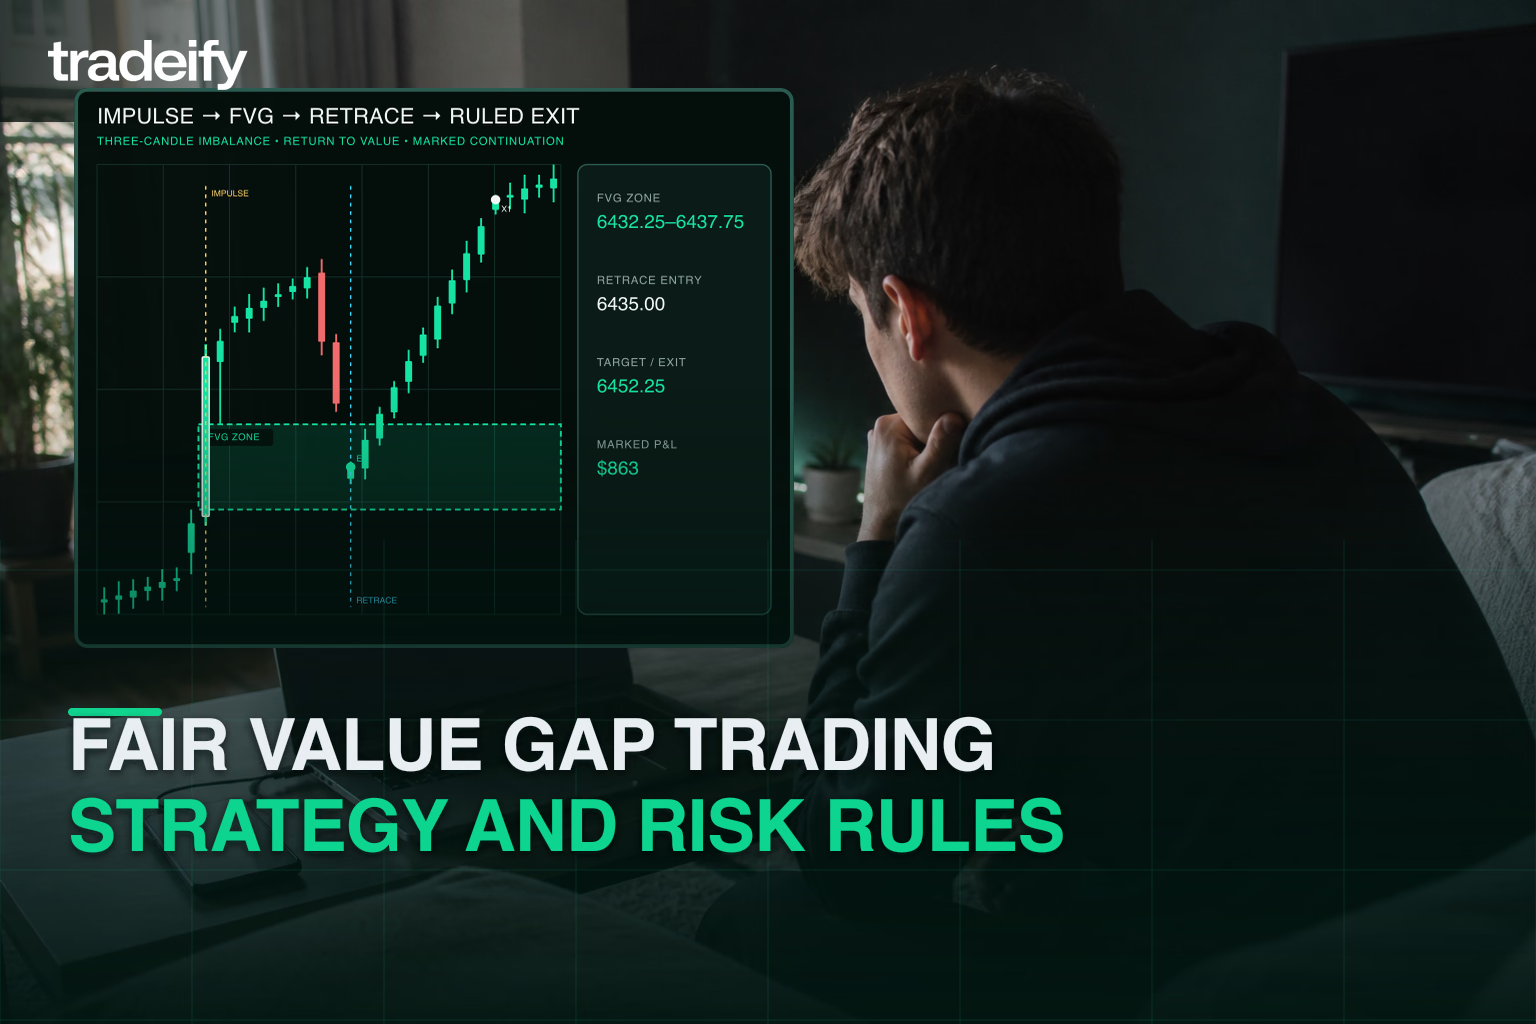


TL;DR: Fair value gap trading uses a three-candle pattern to mark where price moved quickly enough to leave a non-overlapping zone. That zone is a location to watch, not an automatic entry or proof that price must return. A complete setup needs context, a trigger, structural invalidation, contract sizing, and a target chosen before entry. If the logical stop does not fit your risk limit, the trade does not fit. Test one exact rule set by instrument, session, and timeframe before trusting it.
You mark the box. Price comes back. The setup looks almost too clean.
Then one of three things happens. You enter before confirmation, use a stop that does not fit your account, or keep trading the same zone after the original idea has failed. The problem is not the rectangle on the chart. It is the lack of a complete decision process around it.
Fair value gaps can help you organize price action and plan a trade. They cannot tell you who placed an order, guarantee that price will “fill” a zone, or make an oversized position safer. That distinction matters even more when a daily loss limit, trailing drawdown, or consistency rule leaves little room for improvisation.
What fair value gap trading means
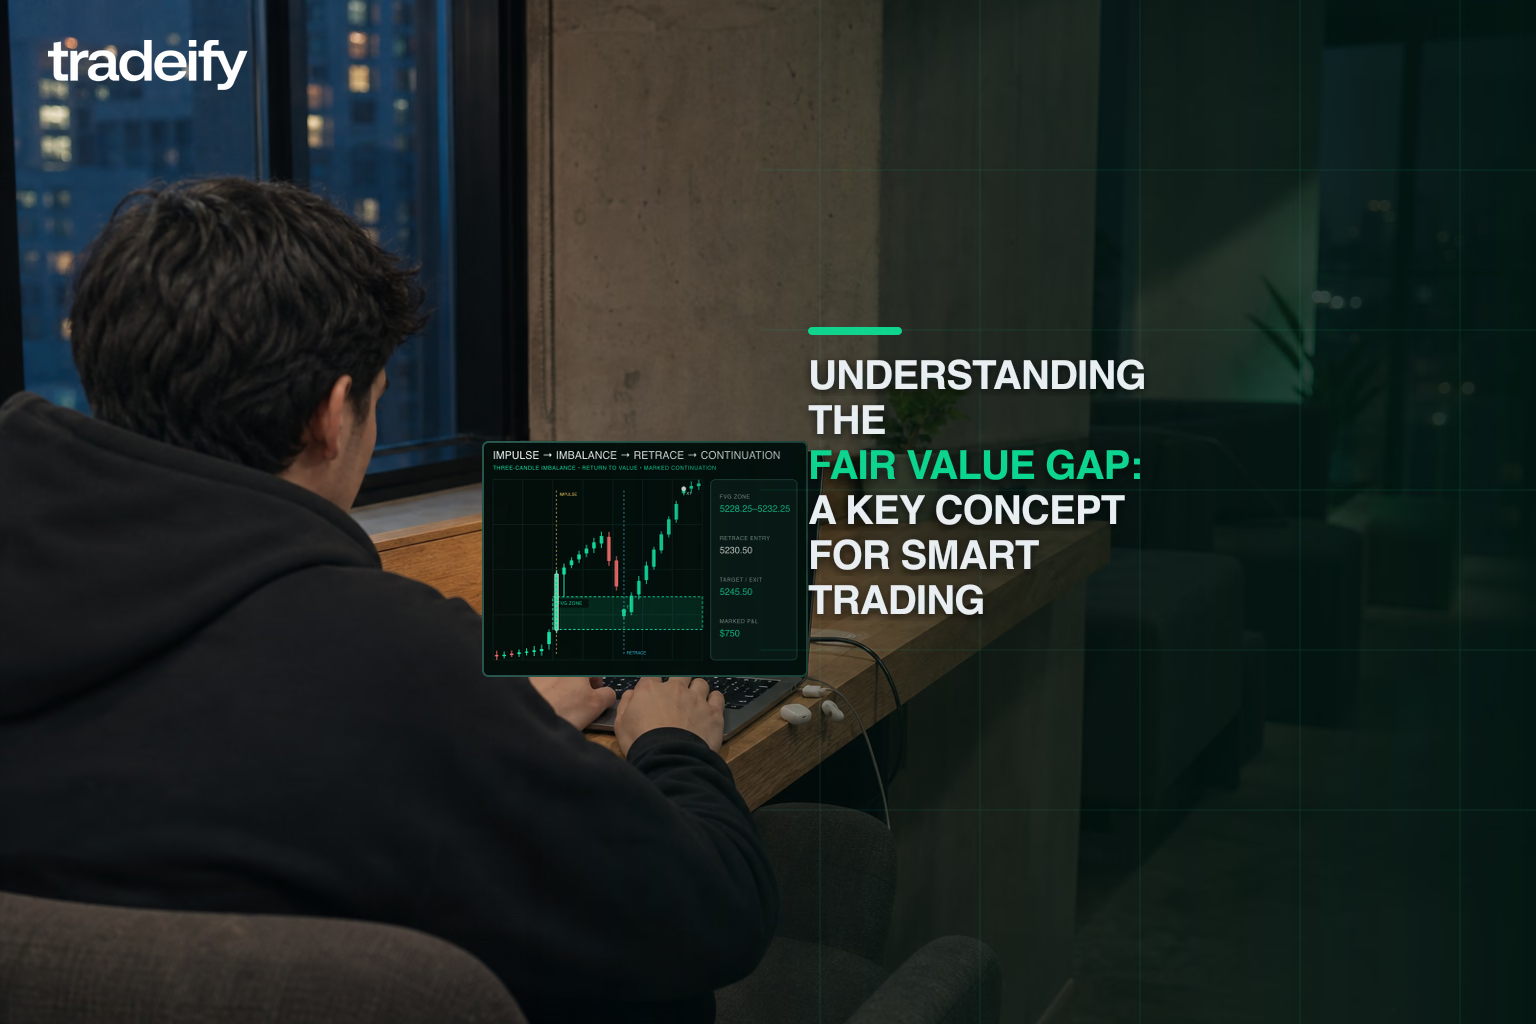
A fair value gap, usually shortened to FVG, is a three-candle pattern used in technical analysis. Traders mark the price range where the first and third candles do not overlap after a strong middle candle.
The word “gap” can be confusing. An FVG does not require an empty space between two consecutive candles. It is a non-overlapping interval across a three-candle sequence. Trading may have occurred inside that price range during the middle candle.
That is why the cleanest definition is visual:
- Candle one establishes one boundary.
- Candle two moves sharply in one direction.
- Candle three fails to overlap part of candle one’s range.
- The non-overlapping interval becomes the FVG zone.
The CFTC glossary defines technical analysis as forecasting based on patterns in price, rates of change, volume, and open interest. FVG trading fits inside that broad category. It is a way to structure a hypothesis from past price action, not a promise about the next move.
Fair value gap terms traders use
You will see a few recurring labels:
- Displacement is the strong directional move that creates the pattern.
- Mitigation means price has returned into some or all of the zone.
- Filled FVG usually means price has traded through the full marked zone.
- Unmitigated FVG means price has not returned to the zone.
- Consequent encroachment is the midpoint of the zone.
- Inverse fair value gap describes a failed FVG that traders then watch from the opposite side.
These are practitioner terms, not exchange rules. Define them in your plan so that you do not change their meaning after a trade moves against you.
What an FVG proves and what it cannot prove
An FVG shows that price moved far enough during a three-candle sequence to leave a non-overlapping interval between the first and third candles. That is observable.
Why fair value gaps form
A fair value gap forms when price moves through a range faster than two-sided trade can occur inside it.
The gap appears because aggressive buying or selling clears the prices it crosses. Resting limit orders on one side of the book are consumed before new ones replenish them, leaving an interval where little two-sided activity took place. NinjaTrader's guide to fair value gaps calls this an imbalance, the visual signature of one-sided order flow, and its order imbalance guide covers how one-sided flow can create a trading edge. FluxCharts describes the same idea when it locates FVGs as areas of imbalance where the fair price of an asset has recently changed.
The aggressive side matters more than the shape. A gap printed on thin participation can fill quickly and mean little. A gap printed with heavy committed volume tends to mark an area participants still defend. Order-flow tools can show you the difference. A footprint chart can show whether aggressive buying or selling actually drove the move, and a volume profile can show whether the gap sits in a low-volume node, which NinjaTrader notes tends to fill faster.
None of that makes the zone self-executing. It tells you where the market last showed urgency, and therefore where a reaction is possible. Your plan still supplies the trigger, the invalidation, and the size.
Everything after that is an interpretation.
Traders often say the zone contains unfilled institutional orders or that price must return to “rebalance” the market. A candlestick chart alone cannot prove either claim. It shows open, high, low, and close for each bar. It does not identify the motive or identity of every buyer and seller.
A more disciplined reading is:
- The middle candle shows strong directional movement for that chart period.
- The zone gives you an objective area to monitor.
- A return into the zone may create a planned entry opportunity.
- Price can react before the zone, inside it, beyond it, or never return at all.
Treat the FVG as a location. Require a separate reason to take risk.
How to identify a fair value gap
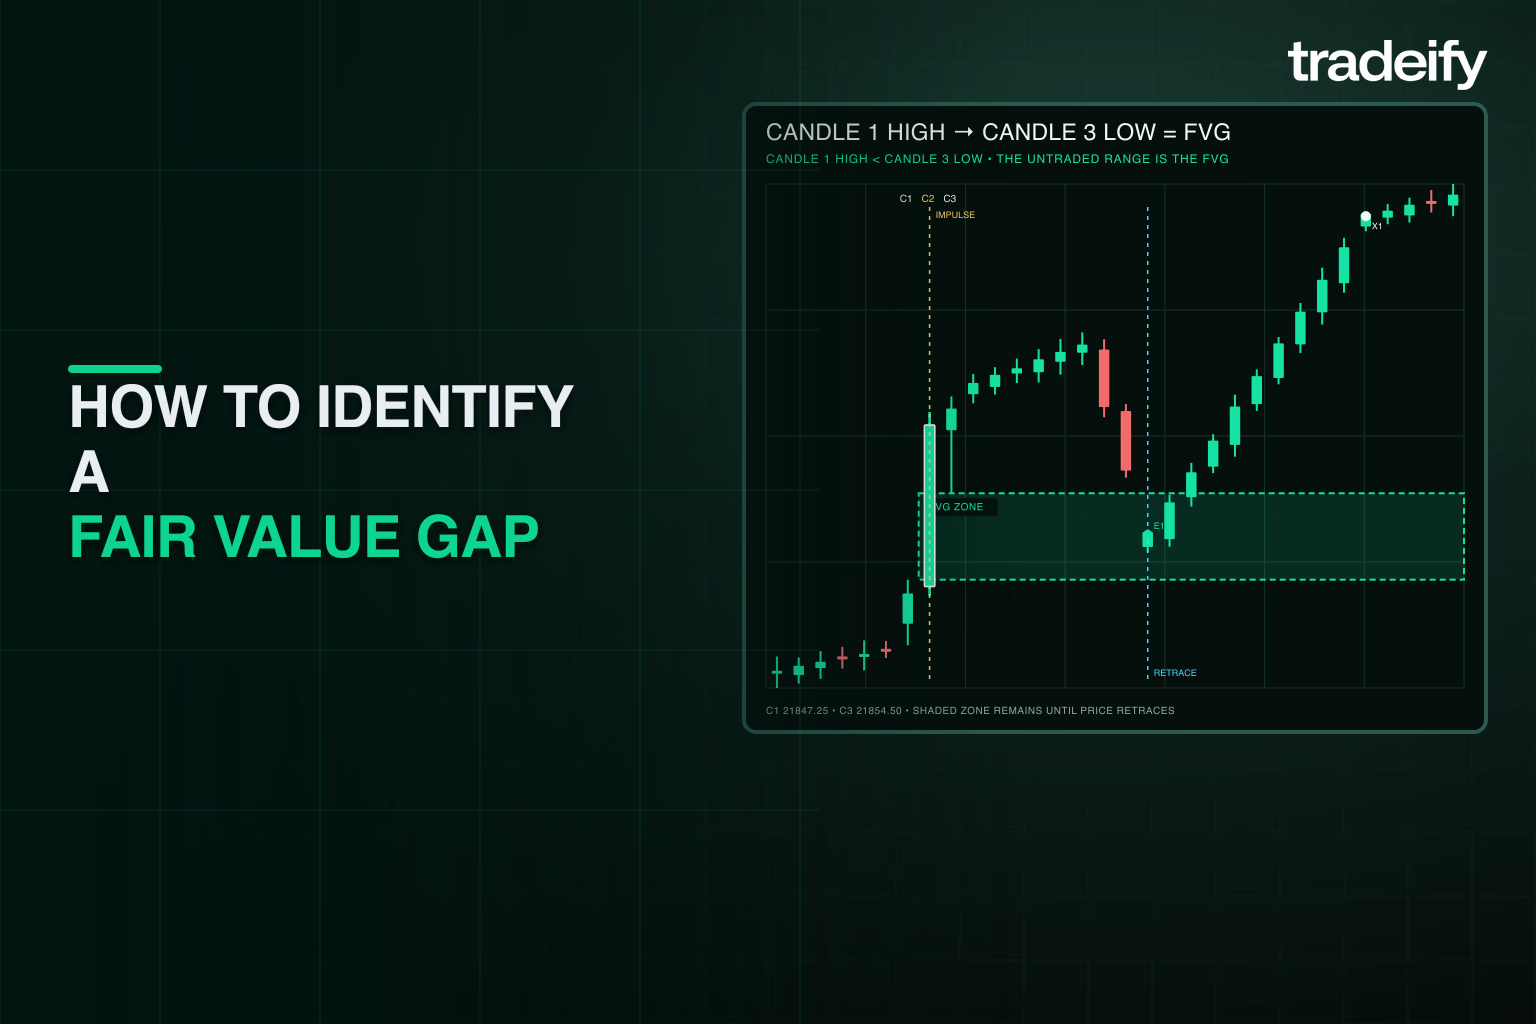
Use candle highs and lows, including the wicks. CME Group’s guide to candlestick chart anatomy explains that the wick shows the high and low traded during the period, while the body shows the open and close.
An indicator may draw the boxes for you, but you should still understand the boundaries.
Automatic detection is standard on modern platforms. NinjaTrader Desktop ships an official Fair Value Gap indicator that detects three-bar imbalances, plots the gap zone, and marks the FVG as filled when price closes through the gap. It exposes a lookback period that controls how many bars back it scans for new gaps, plus settings for how a filled gap is displayed once price trades through it.
Before you trust any FVG tool, verify four things against your written rules:
- Boundaries. The tool must use candle highs and lows, including the wicks. Some scripts use bodies only, which shifts every zone.
- Fill behavior. Some tools mark a gap filled when price touches the far edge; others require a close through the zone. Match the definition in your plan.
- Minimum size. A size floor in ticks or points filters the two-tick noise that appears every few minutes on fast charts.
- Alerting. Zone-created and zone-retested alerts are useful; an alert on every fill candidate is not.
Scanners extend the same logic across markets. TrendSpider's fair value gap strategy guide notes that its indicators, scanners, and proximity tools can detect both fair value gaps and inverse fair value gaps automatically. Community scripts on TradingView vary widely in boundary logic, so test any tool against zones you have already marked by hand before you let it drive a decision.
What an indicator cannot do is decide which zone deserves risk. Use it to save marking time. Keep the entry trigger, the invalidation, and the size decision in the plan you wrote.
How to mark a bullish fair value gap
A bullish FVG forms after an upward displacement:
- Find a three-candle sequence with a strong move higher in the middle.
- Compare the high of candle one with the low of candle three.
- Confirm that candle one’s high is below candle three’s low.
- Mark the zone from candle one’s high up to candle three’s low.
The marked interval is a bullish FVG. Traders may watch it as a possible support or continuation area if price returns.
For example, assume candle one has a high of 5,210 and candle three has a low of 5,214. The bullish FVG runs from 5,210 to 5,214. The midpoint is 5,212.
How to mark a bearish fair value gap
A bearish FVG is the mirror image:
- Find a three-candle sequence with a strong move lower in the middle.
- Compare the low of candle one with the high of candle three.
- Confirm that candle one’s low is above candle three’s high.
- Mark the zone from candle three’s high up to candle one’s low.
Traders may watch that bearish FVG as possible resistance if price retraces upward.
If candle one has a low of 5,210 and candle three has a high of 5,206, the bearish FVG runs from 5,206 to 5,210. Its midpoint is 5,208.
How to handle borderline fair value gaps
Small gaps are common on fast charts. Decide in advance whether your rules require:
- a minimum zone size in ticks or points;
- a middle candle larger than a recent average;
- a close through prior structure;
- formation during a specific trading session;
- a minimum distance to the next target;
- no immediate overlap from the next candle.
There is no universal threshold. The important part is consistency. If a two-tick zone counts in your winning examples but not in your losing examples, you are reviewing the chart with hindsight.
How to build a fair value gap trading plan
A box is not a plan. Use a sequence that forces you to define the trade before the pressure starts.
Set the fair value gap context
Start with the market condition and directional idea. Is the futures market trending, ranging, breaking prior structure, or reacting to scheduled news? Is the candidate FVG aligned with the higher-timeframe move or sitting directly against it?
You do not need five indicators. You do need a sentence that can be proven wrong, such as:
I will consider a long only if price holds above the prior swing low and returns to the first bullish FVG created by the break above the session range.
That is more useful than “the gap should hold.”
Qualify the fair value gap zone
Before waiting for a retracement, decide why this FVG deserves attention. Possible filters include:
- it formed with a clear expansion in candle range;
- it followed a break of a level you marked before the move;
- it aligns with the higher-timeframe direction;
- it formed during the session you actually trade;
- it has not already been fully traded through;
- there is enough room to a logical target.
More filters do not automatically create a better setup. Choose a small set that you can define and test.
Choose a fair value gap entry
Three common entry models have different tradeoffs.
| FVG entry model | Example | What triggers the trade | Main tradeoff |
|---|---|---|---|
| First touch | A limit order at the near edge of the zone | Earlier entry and tighter theoretical risk, but no evidence that the zone is holding | |
| Midpoint touch | A limit order near the 50 percent level | More retracement before entry, but price may turn before the order fills | |
| Confirmation | A lower-timeframe rejection, reclaim, or structure shift inside the zone | More information, but a later entry and often a wider stop |
Pick one model for a test. Switching from confirmation to first touch because you fear missing a move is not adaptation. It is a new strategy introduced at the worst time.
Define fair value gap invalidation
Invalidation is the price behavior that proves your setup is no longer the trade you planned. It is not simply the largest loss your account can tolerate.
Depending on the setup, invalidation might be:
- a close through the far edge of the FVG;
- a break of the swing that created the directional thesis;
- failure to hold a higher-timeframe level;
- a time stop when the expected reaction does not occur within a set number of bars.
Your actual protective stop may need a small buffer beyond the structural level. Account for normal price movement and order execution without turning the buffer into an excuse for unlimited risk.
Size the fair value gap trade
Work backward from permitted risk:
- Mark the entry.
- Mark the stop.
- Calculate the distance in ticks or points.
- Convert that distance to dollars per contract.
- Choose a contract quantity that keeps the planned loss within your limit.
- Include commissions and possible slippage in your estimate.
If one contract is already too large, skip the trade or use a smaller contract when your rules permit it. Moving the stop closer only to make the position fit changes the technical setup. Review stop-loss placement separately from position sizing so one decision does not quietly rewrite the other.
Set the fair value gap target
Choose the target before entry. Reasonable reference points might include a prior swing, the other side of a range, a session high or low, or a higher-timeframe level.
Then ask whether the available reward justifies the defined risk. Do not force a fixed reward-to-risk ratio onto every chart. A target should come from price structure, and the resulting ratio should help you decide whether the trade is worth taking.
An opposing FVG can also serve as a target reference when it sits before a major swing or session level. Treat it as a possible reaction area, not a guarantee that price will fill the zone.
A futures fair value gap example
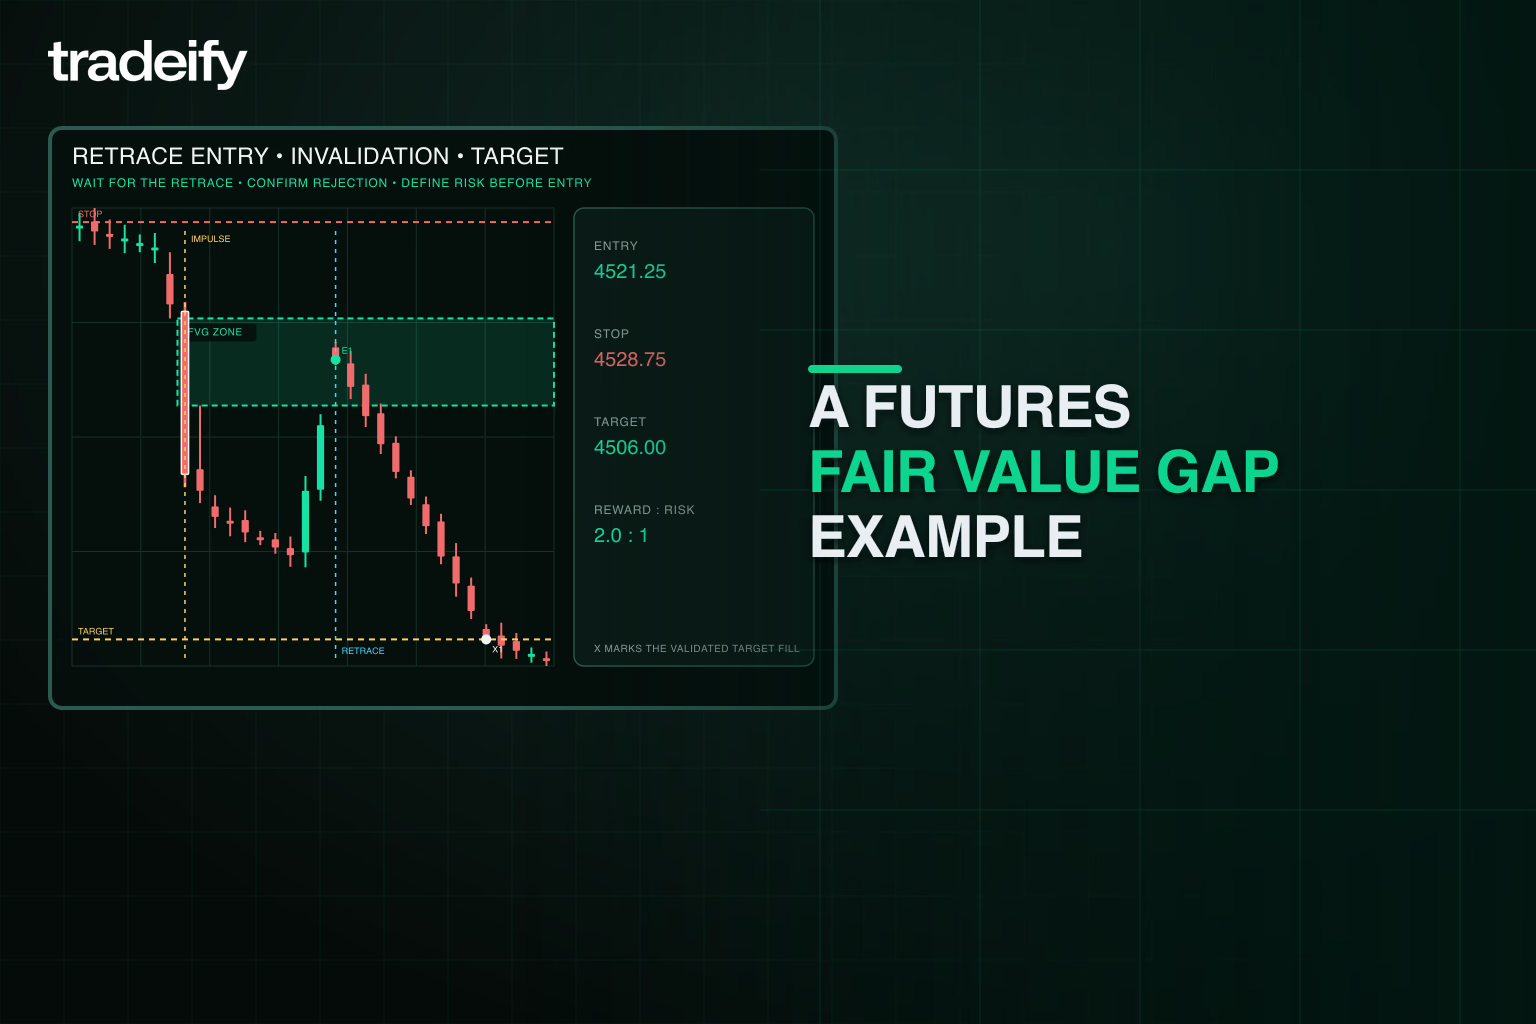
Assume a trader is watching a five-minute index futures chart during the morning session. Price breaks above a range, and the three-candle move leaves a bullish FVG from 5,210 to 5,214.
The trader’s written plan says:
- trade only in the direction of the 30-minute structure;
- enter only after a five-minute close back above the FVG midpoint;
- place the stop below the swing low, not merely below the box;
- target the prior session high;
- risk no more than the trader’s pre-set amount for one idea.
Price retraces into the FVG, but the swing-based stop is much farther away than expected. At the available contract size, the worst-case loss would exceed the trader’s limit.
The correct decision is to pass.
The zone may still produce a bounce. Missing that move does not make the decision wrong. In an evaluation or funded account, a setup is valid only when both the chart logic and the account risk fit. Protecting the account is part of execution.
Does the fair value gap fit your risk limits?
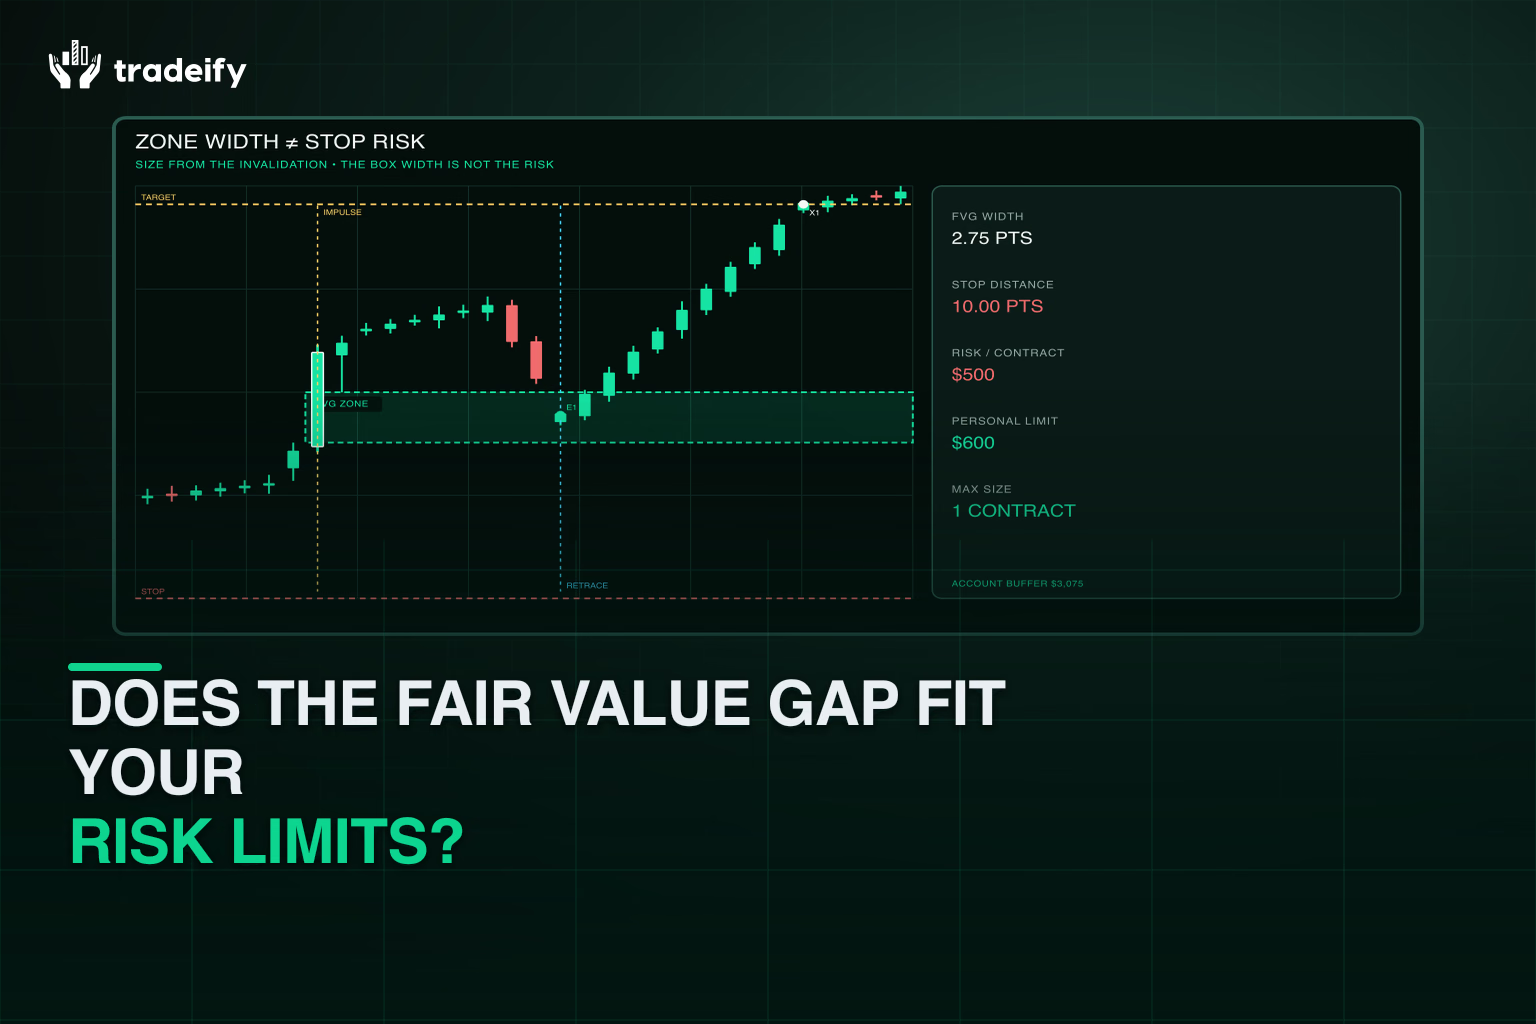
FVG trading can create a dangerous illusion of precision. A narrow box may tempt you to use more contracts, but the logical invalidation may sit well beyond it. This matters for any trader with a fixed risk budget and becomes critical when daily loss, drawdown, or consistency rules apply.
CME Group’s position and risk management guidance emphasizes selecting contract quantity from risk scenarios rather than the maximum size allowed and placing stops within your risk tolerance.
Before taking an FVG setup, run these checks:
- Daily loss room: What would the account show if the stop fills with estimated costs?
- Drawdown room: Does the trade leave enough buffer for normal variance and later opportunities?
- Open risk: Are correlated positions creating one larger directional bet?
- Consistency: Would this position be unusually large compared with your normal risk?
- Event exposure: Could a scheduled release cause a worse fill than planned?
- Re-entry limit: How many attempts can one FVG idea receive?
Set a personal loss limit below any hard account threshold. The goal is to stop while you still have decision quality, not when the platform forces the issue.
How to choose a fair value gap timeframe
There is no single best FVG timeframe. A chart interval changes what each candle summarizes, so it changes the zones you see.
Lower timeframes usually produce more candidate FVGs and more decisions. They also make you more sensitive to spread, slippage, rapid reversals, and small changes in your definition. Higher timeframes produce fewer, wider zones that may require larger stops.
A practical two-timeframe workflow is:
- Use a higher timeframe to define trend, range boundaries, and major levels.
- Use an execution timeframe to mark the FVG and trigger the trade.
For example, a trader might use a 30-minute chart for context and a five-minute chart for execution. That pairing is not inherently better than another. It is useful only if it fits the instrument, session, holding period, and risk limits the trader has tested.
Avoid scanning every interval until one supports the trade you already want. That turns timeframe selection into confirmation bias.
How to filter fair value gap setups
Confluence should narrow your trades, not justify a larger position.
Fair value gaps with market structure
A FVG formed during a meaningful break of structure may be more useful than one in the middle of a choppy range because the directional thesis and invalidation can be clearer. If you use that vocabulary, keep the full Smart Money Concepts framework separate from the entry trigger itself.
Define “break” before the trade. A wick beyond a prior high, a close beyond it, and a sustained move beyond it are different events.
Fair value gaps at planned levels
A zone near a prior session high or low, range boundary, or higher-timeframe swing gives the trade context. The level should already matter before the FVG appears.
If you mark a level only after the gap forms, it is easy to create a story around any chart. The same rule applies when pairing an FVG with an order block: the second label should clarify the setup, not rescue it.
Fair value gaps with volume or order flow
Volume, footprint, or order-flow tools can add information about participation. They do not turn an FVG into certainty.
Write the exact confirmation you need. “Strong volume” is vague. “Volume on the displacement candle must exceed the median of the prior 20 bars” is testable.
Fair value gaps around scheduled news
Major releases can create fast displacement and poor fills. A clean FVG after news may carry more execution risk than the chart suggests.
Your plan should state whether you avoid new positions around scheduled events, wait a fixed period, or trade them under a separate tested rule set. Do not decide after the candle starts moving.
Fair value gaps and similar trading concepts
These terms overlap in casual trading language, but they are not identical.
| Trading concept | Example | Basic definition | Key distinction |
|---|---|---|---|
| Fair value gap | A non-overlapping price interval across a three-candle sequence | Does not require an empty space between consecutive candles | |
| Session gap | A visible space between one session’s close and the next session’s open or trading range | Often tied to a market close and reopen | |
| Liquidity void | A broader area where price moved quickly with limited two-sided activity | May span more than three candles and depends on the trader’s definition | |
| Order block | A practitioner-defined candle or zone believed to precede strong displacement | Attempts to label an origin area rather than the three-candle non-overlap | |
| Inverse FVG | A prior FVG that fails and is then watched from the opposite direction | Requires a rule for when the original zone has failed |
Your charting platform may label these differently. Keep your own definitions stable and test each setup separately.
What is an inverse fair value gap
An inverse fair value gap begins as an ordinary FVG that fails under a rule you defined before the trade. If price closes through the zone and later respects it from the opposite side, some traders treat that flip as a new setup.
The important word is new. Do not rename every failed box after the fact. Define what constitutes a break, require fresh confirmation, and set a new invalidation level. For the broader framework behind these terms, see ICT concepts for trading evaluations.
Do fair value gaps work
Fair value gaps can work as a repeatable way to define location, entry, and invalidation. That is different from saying every FVG has a predictive edge.
There is no honest universal win rate. Results change with:
- the market and contract;
- the trading session;
- the chart timeframe;
- the minimum gap size;
- trend or range context;
- first-touch versus confirmation entry;
- stop and target rules;
- costs and slippage;
- how repeat entries are counted.
A screenshot proves that one pattern existed on one chart. It does not tell you how often the setup failed, how much adverse movement occurred, or whether the result survives costs.
The right question is not “Do FVGs work?” It is “Does my exact FVG rule set show acceptable results in the market and conditions I plan to trade?”
How to backtest fair value gap trading
Write the rules before collecting examples. If you are unsure how large the sample should be, start with this guide to how many trades to backtest.
Define one fair value gap setup
Specify:
- instrument and contract;
- session and timezone;
- context timeframe and execution timeframe;
- bullish and bearish FVG formulas;
- minimum and maximum zone size;
- displacement requirement;
- entry trigger;
- stop placement;
- target and trade management;
- treatment of news periods;
- whether a zone can be traded more than once.
If a rule requires judgment, create a clear label for that judgment and review whether two people would classify the chart the same way.
Record every fair value gap candidate
Do not save only the attractive charts. Use a trading journal to record all setups that meet the definition.
Useful fields include:
- formation time;
- gap direction and size;
- higher-timeframe condition;
- entry, stop, and target;
- maximum favorable excursion;
- maximum adverse excursion;
- result after costs;
- whether the zone was partially or fully filled;
- whether the planned trade fit account limits.
Review fair value gap results
Look beyond win rate. Compare average win with average loss, the length and depth of losing streaks, drawdown, missed fills, time in trade, and performance by session.
Use out-of-sample data or a later period to check whether the rules still hold. Then test in simulation before putting the setup under evaluation pressure.
Common fair value gap trading mistakes
Trading every fair value gap
Fast markets print many three-candle non-overlaps. Without context, you are trading a shape rather than a setup.
Assuming every fair value gap fills
Price may never return. It may touch only the near edge, trade through the entire zone, or continue without a retracement. Do not chase a missed entry.
Entering during fair value gap displacement
Buying the large bullish candle or selling the large bearish candle can put you far from invalidation with poor reward left to the target. Wait for the entry your plan defines.
Moving a fair value gap stop
If the invalidation level fails, widening the stop does not improve the thesis. It increases the loss on an idea the market has already challenged.
Oversizing a fair value gap
A small-looking zone is not the same as small risk. Calculate the distance to the actual stop and convert it to dollars before choosing quantity.
Retrying the same fair value gap
One stop-out can turn into three when a trader keeps calling the zone “fresh.” Define mitigation and re-entry rules before the first attempt.
Changing fair value gap timeframes
Dropping to a smaller chart after entry often produces a new reason to stay in. Manage the trade on the timeframe named in the plan.
Frequently asked questions about fair value gap trading
Which fair value gap is best?
The one that fits your written rules. Traders commonly prioritize the most recent unmitigated gap in the direction of the higher-timeframe move, or the gap at a level you planned in advance. Whichever you choose, define it before the session starts so you are not ranking boxes mid-move.
Is FVG the same as imbalance?
Close, but not identical. An FVG is a three-candle pattern whose first and third candles do not overlap, and the skipped interval is commonly called an imbalance because little two-sided trade occurred there. The similar-concepts section above separates FVGs from session gaps, liquidity voids, and order blocks, which overlap in casual usage but mean different things.
Does a fair value gap always fill?
No. A zone may fill quickly, fill much later, fill partially, or never fill within the period you trade. A fill is an outcome to measure, not an assumption to risk money on.
What is the best fair value gap timeframe?
There is no universal best timeframe. Choose a context chart and an execution chart that match your instrument, session, holding period, and risk. Test the exact combination.
What is the best fair value gap indicator?
The best indicator is one that uses boundaries you understand, lets you control minimum gap size and fill behavior, and matches your written definition. It should save marking time, not make entry or risk decisions for you.
A better way to use fair value gaps
Fair value gap trading becomes useful when it makes your decisions more specific.
Mark the zone. State the context. Choose the trigger. Define invalidation. Size from the stop. Set the target. Decide what makes you skip the trade.
Then follow the same rules across enough examples to learn something real. The edge, if your testing finds one, will not come from calling every fast candle institutional activity. It will come from repeating a clear process while protecting the account when the setup fails.
Your next step: choose one instrument, one session, one context timeframe, and one entry model, and use the same setup to gather a sample you can actually judge. Record every qualifying FVG, including the trades you skip, before changing the rules.
Educational note: This article is for general trading education and is not financial advice. Futures trading involves substantial risk.
.svg)
.svg)
.svg)
.svg)





.webp)