.svg)

.svg)
.svg)




TL;DR: Smart Money Concepts (SMC) is a price-action vocabulary built around market structure, liquidity, displacement, order blocks, fair value gaps, and range location. A chart can show highs, lows, closes, gaps, and breaks. It cannot prove who placed an order or why. Use SMC as a testable hypothesis: define context, confirmation, structural invalidation, position size, and target before entry. If any piece is missing, or the stop does not fit your risk limit, pass.
Table of Contents
- What Smart Money Concepts means
- Smart Money Concepts at a glance
- Market structure first
- Liquidity without the certainty story
- Order blocks, FVGs, and mitigation
- Premium, discount, and dealing ranges
- Complete SMC setup workflow
- Futures example and position sizing
- Failed SMC setup
- When to pass on an SMC setup
- How to backtest an SMC strategy
- Hindsight and confirmation bias
- Smart Money Concepts FAQ
A chart can look perfect after the move. That is the problem.
Once you know the outcome, almost any swing can become a break of structure, almost any red candle can become an order block, and almost any pause can become “liquidity.” The useful version of SMC removes that freedom. It tells you what must be visible before the trade, what confirms the idea, and where the idea is wrong.
What Smart Money Concepts Means
Smart Money Concepts is a practitioner framework for organizing price action. Traders use terms such as market structure, liquidity sweep, break of structure (BOS), change of character (CHOCH), order block, fair value gap (FVG), displacement, and premium or discount.
The framework overlaps with conventional technical analysis. Both read historical price behavior and form a hypothesis about what may happen next. The difference is mostly the vocabulary and the story SMC traders place around certain levels.
What a Chart Shows
A candlestick chart records the open, high, low, and close for each bar. CME Group’s candlestick chart guide explains that the wick marks the high and low traded during the period, while the body marks the open and close. Those values are observable. A sequence of higher highs and higher lows is observable. A close beyond a prior swing is observable.
The interpretation begins when a trader says those shapes reveal an institution, an unfilled order, a stop hunt, or a market maker’s motive. A candlestick chart does not identify every participant or explain why each trade occurred. CME Group’s technical-analysis course makes the same broader distinction: chart values are objective, while chart-pattern analysis introduces subjectivity.
SMC Versus ICT and Conventional Price Action
SMC is the broader retail vocabulary. ICT refers to a specific teaching system associated with many of the same labels, including liquidity, fair value gaps, order blocks, kill zones, and dealing ranges. Conventional price action may describe similar events as swing breaks, failed breakouts, momentum candles, support and resistance, or supply and demand.
You do not get a better trade by stacking more names on the same candles. The test is whether the label produces a rule you can execute and review. For a broader look at levels, see Tradeify’s guide to support and resistance indicators.
Smart Money Concepts at a Glance
Use the table as a map, not a signal list. Each concept needs context and a separate risk decision.
| Concept | Visual example | What it describes | Confirmation | Failure condition |
|---|---|---|---|---|
| Market structure | HH, HL, LH, and LL | A consistent swing sequence | The protected swing breaks | |
| BOS | A break through a prior swing in the active direction | A close and follow-through beyond the swing | Price immediately reclaims the level | |
| Liquidity sweep | Price trades beyond a visible high or low | A reclaim plus movement away | Price accepts beyond the level | |
| Order block | A practitioner-defined origin candle or zone | Reaction plus a separate entry trigger | A close through the chosen boundary | |
| Fair value gap | A three-candle non-overlapping interval | A defined reaction or structure trigger | Price trades through the zone under your rules | |
| Premium / discount | Location above or below a range midpoint | The dealing range remains valid | A different range becomes controlling | |
| Displacement | A strong directional move for the chart period | A close through a defined structure level | No follow-through or immediate reversal |
Market Structure Comes First
Market structure describes the sequence of swing highs and swing lows. In a bullish sequence, price forms higher highs (HH) and higher lows (HL). In a bearish sequence, it forms lower lows (LL) and lower highs (LH). A range forms when price rotates without a stable sequence.
The hard part is not recognizing a finished trend. It is defining swings consistently in real time. Decide whether a swing requires a fixed number of bars on both sides, a minimum move, or another objective rule. If the definition changes from chart to chart, the backtest is measuring your hindsight.
Break of Structure Versus Change of Character
Break of structure (BOS) usually means price moved through a prior swing in the direction of the active trend. Change of character (CHOCH) usually means price broke the first protected swing against that trend. Traders sometimes use market structure shift (MSS) for a similar reversal event.
A BOS or CHOCH is not automatically an entry. A brief trade beyond a swing can fail. Require a close, follow-through, reclaim, or lower-timeframe trigger according to one rule set.
Displacement
Displacement is SMC terminology for a strong directional move relative to nearby bars. The observable features might include a wide real body, a close near the bar’s extreme, little overlap with recent candles, and a close through structure.
“Strong” must be measurable. You might require the candle range to exceed a recent average, the close to break a named swing, or the move to occur during a chosen session. Without a threshold, every winning move becomes displacement after the fact.
Liquidity Without the Certainty Story
In market mechanics, liquidity concerns the ability to transact without causing a large price change. In SMC language, “liquidity” often means visible levels where traders expect orders to cluster: prior highs and lows, equal highs and lows, session extremes, or range boundaries.
You can observe the level and whether price trades through it. You cannot see every resting order or prove that a specific candle was designed to take stops. “Buy-side liquidity” and “sell-side liquidity” are useful practitioner labels only when your plan defines the level objectively.
Equal Highs and Equal Lows
Equal highs are two or more highs within a defined tolerance. Equal lows are the mirror image. Exact equality is rare, so set the tolerance in ticks or points before reviewing the chart. A loose tolerance finds more examples but also creates more discretion.
Liquidity Sweep Versus Genuine Breakout
A liquidity sweep trades beyond a visible level and then returns through it. A breakout trades beyond the level and holds. The difference is not the first tick through the line. It is what price does next.
Confirmation might be a close back inside the range after a sweep, followed by displacement away. A breakout rule might require one or more closes beyond the level or a retest that holds. Invalidation for a short sweep setup could be acceptance above the swept high. Invalidation for a breakout long could be a close back inside the prior range.
Order Blocks, Fair Value Gaps, and Mitigation
Order blocks and fair value gaps are both used as areas of interest, but they describe different chart structures.
Order Blocks
An order block is commonly defined as the last opposing candle, or a small origin area, before displacement breaks structure. That definition is practitioner terminology. The candle itself does not prove that institutional orders remain there.
Make the zone testable. Specify whether you use the full candle range or only its body, which candle qualifies, whether a structure break is required, what counts as first touch, and what closes invalidate the zone.
Fair Value Gaps
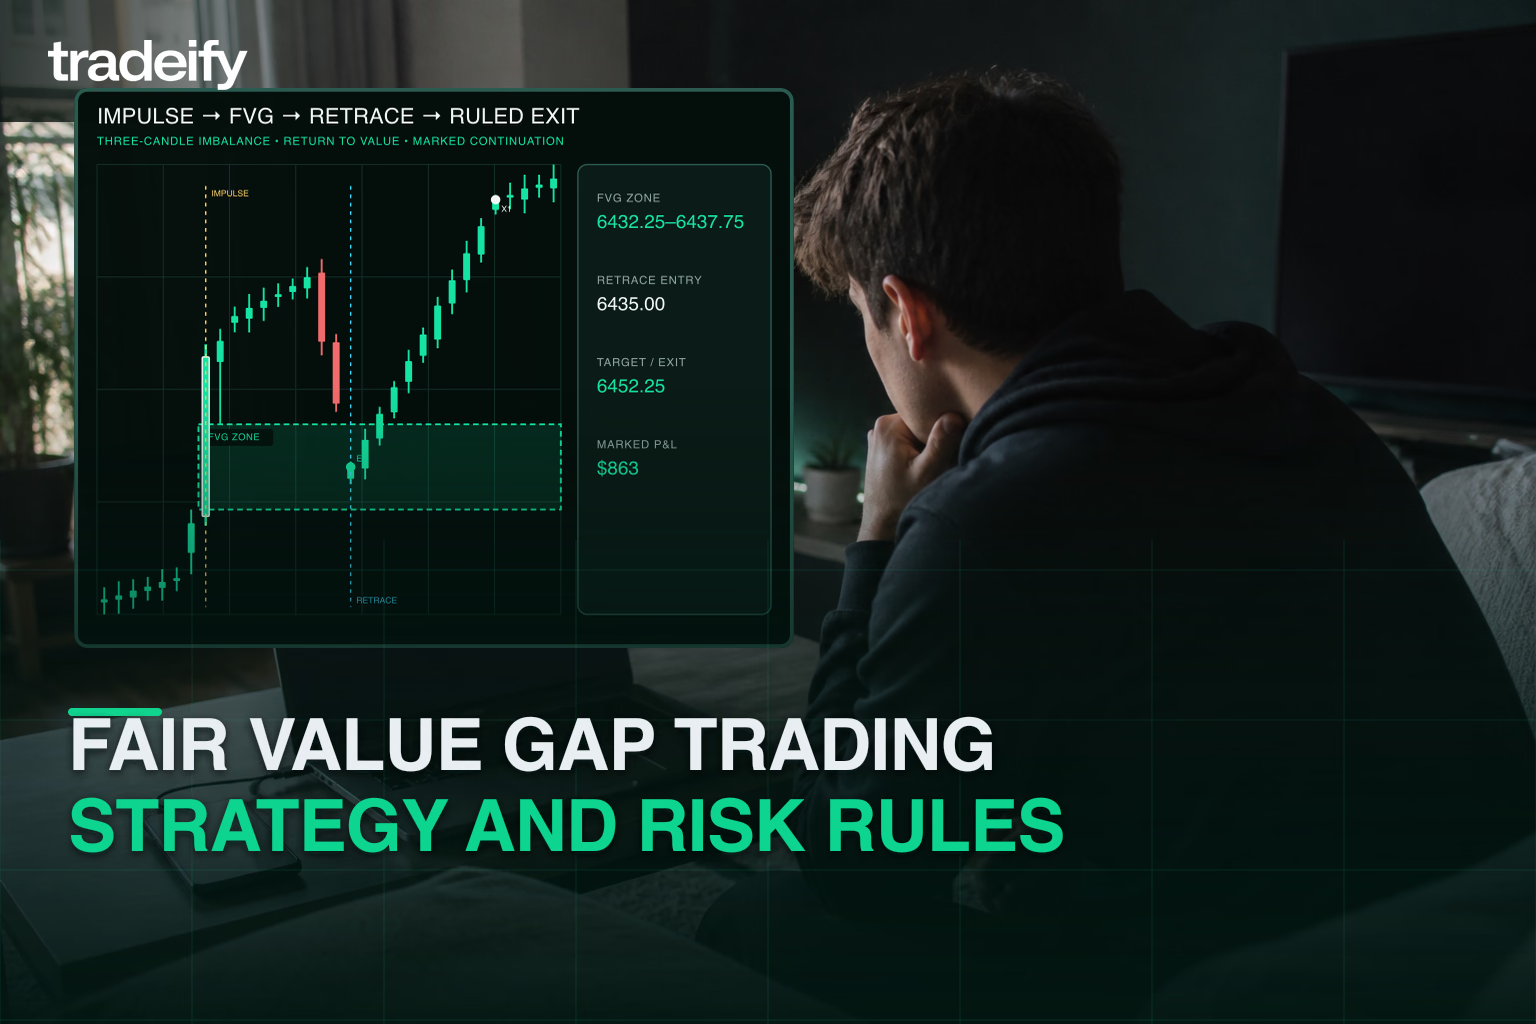
A fair value gap is a three-candle pattern. In a bullish FVG, candle one’s high is below candle three’s low after an upward move. The interval between those prices is the marked zone. In a bearish FVG, candle three’s high is below candle one’s low.
That non-overlap is observable. The claim that price must return to fill it is not. Price may react before the zone, inside it, through it, or never revisit it. Tradeify’s full fair value gap trading guide covers marking, entry choices, and risk rules in more detail.
Mitigation Versus Invalidation
Mitigation usually means price returned into some or all of a marked zone. It does not mean the zone held. A return is an event; a reaction is a possible confirmation; invalidation is the price behavior that makes the original thesis wrong.
For example, your bullish order-block plan might require a return into the upper half, a lower-timeframe reclaim, and a stop below the origin low. A touch alone is not confirmation. A close below the origin low ends the original thesis under that rule set.
Similar SMC Concepts Traders Confuse
| Comparison | Visual example | Key distinction | Decision rule |
|---|---|---|---|
| BOS vs. CHOCH | BOS normally continues the current swing sequence; CHOCH is the first break against it. | State the trend and protected swing before the break. | |
| Sweep vs. breakout | A sweep returns through the level; a breakout holds beyond it. | Define reclaim, acceptance, and time allowed in advance. | |
| Order block vs. FVG | An order block labels an origin area; an FVG is a three-candle non-overlap. | Either still needs an independent entry trigger. | |
| Mitigation vs. invalidation | Mitigation means a return into a zone; invalidation means the thesis is wrong. | Write the exact boundary before entry. | |
| Premium vs. discount | Both are relative to the midpoint of one selected dealing range. | Use the same range in planning and review. |
Premium, Discount, and Dealing Ranges
SMC traders divide a selected high-to-low range at its midpoint. Prices above the midpoint are called premium, prices below are discount, and the midpoint is equilibrium.
The math is objective. The chosen range is not. A daily range, a four-hour swing, and a five-minute leg can place the same price in different categories. Name the timeframe and exact range anchors before using premium or discount as a filter.
Premium does not mean price is objectively expensive, and discount does not mean it is objectively cheap. They describe location within the chosen range. In an uptrend, a trader might watch discount for a long setup; in a downtrend, premium for a short setup. Structure and confirmation still decide whether the trade exists.
A Complete SMC Setup Workflow
The workflow matters more than the vocabulary. Follow the sequence in order so a late chart label cannot rescue an incomplete trade.
- Define context: Mark the higher-timeframe swing sequence or range. Record the session and any scheduled event that could alter volatility.
- Mark one liquidity event: Choose a prior high, low, equal level, or range boundary using a fixed tolerance.
- Wait for evidence: Require the sweep, breakout, displacement, or structure close specified by the plan.
- Choose the entry area: Mark one order block, FVG, retest, or range location. Overlapping labels do not count as independent evidence.
- Require confirmation: Use one exact trigger, such as a reclaim close or lower-timeframe structure break.
- Fix structural invalidation: Place the stop where the price thesis is wrong, then calculate whether that distance fits the risk plan.
- Pre-plan the target: Use the next structural level, opposite range boundary, or tested exit rule. If the available distance is inadequate, pass.
Entry Confirmation
Anticipation enters at the area of interest before a confirming event. Confirmation waits for evidence but often produces a later entry and wider structural stop. Neither is universally better. Backtest them separately; combining both in one result set hides the tradeoff.
Structural Invalidation
The stop belongs where the setup is wrong. The position size adapts to the stop distance, not the other way around. Pulling a stop inside normal price movement just to trade more contracts changes the strategy.
SMC Futures Example and Position Sizing
Consider a hypothetical Micro E-mini S&P 500 (MES) setup. Price sweeps a prior session low, closes back above it, then produces bullish displacement through a local swing high. A retracement enters a defined FVG, and a five-minute close back above the near edge is the trigger.
- Observable context: higher-timeframe range; price is in the lower half.
- Liquidity event: trade below the prior session low followed by a close back above it.
- Confirmation: bullish close through the local swing high, then a planned FVG reclaim.
- Entry: 5,240.00 after the reclaim closes.
- Structural stop: 5,228.00 below the sweep low; 12 index points of risk.
- Target: 5,264.00 near the opposite range objective; 24 points above entry.
CME Group lists MES at $5 per index point, with a 0.25-point minimum tick worth $1.25. The market risk for one contract with a 12-point stop is therefore 12 × $5 = $60, before fees and slippage. Two contracts would be $120; three would be $180.
Suppose the plan allows $125 for this trade. $125 ÷ $60 = 2.08, so the maximum whole-number size is two MES contracts before costs. If two contracts do not fit the remaining account buffer, the correct size may be one, or zero.
This example is arithmetic, not a performance claim. Futures leverage can amplify losses. The CFTC describes futures as volatile, complex, and risky, and advises traders to understand contract obligations and how much they can afford to lose. The NFA’s investor guidance also emphasizes risk capital and the wider profit-and-loss swings leverage can create. For a deeper account-level process, see risk management for prop firm traders and position sizing and the 1% rule.
A Failed SMC Setup
Now take the same bullish thesis. Price sweeps the low, displaces upward, and returns to the FVG. The trigger closes. You enter. Then price closes below the sweep low and continues lower.
That is a failed setup. It does not become a “deeper order block,” “second mitigation,” or new dealing range unless a separate, prewritten setup forms. Renaming the chart after the stop is hit protects the story, not the account.
The useful review asks whether the setup followed the rules, whether costs and position size were recorded correctly, and whether the failure repeats under a specific context. One loss does not disprove the strategy. A pattern of losses in the same condition may justify a new filter, but only after the evidence exists.
When to Pass on an SMC Setup
Passing is part of the strategy. Do not force a trade when:
- the higher-timeframe structure is unclear or the chosen range keeps changing;
- price is trapped in the middle of a noisy range;
- the sweep occurs without the displacement or reclaim required by the plan;
- the order block or FVG is marked only because it sits near the desired entry;
- the confirmation arrives after price has already reached the planned target area;
- the structural stop is too wide for the dollar-risk limit or remaining drawdown buffer;
- the next target leaves inadequate reward relative to the planned risk;
- scheduled news or unusual volatility falls outside the tested conditions;
- you missed the planned entry and would have to chase a different trade.
SMC Trade-Planning Checklist
| Field | Record before entry | Reason to pass |
|---|---|---|
| Context | Trend, range, session, scheduled event | No stable context or conflicting timeframes |
| Location | External high/low, range edge, OB, or FVG | Middle of a noisy range |
| Trigger | Defined close, reclaim, rejection, or lower-timeframe break | Anticipation without the planned signal |
| Invalidation | Exact structural price level | Stop chosen only from desired dollar loss |
| Risk | Contracts × stop points × dollars per point, plus costs | Risk exceeds the plan or remaining account buffer |
| Target | Next structure or liquidity objective chosen before entry | Insufficient distance relative to structural risk |
| Review | Screenshot and rule-by-rule journal fields | Labels changed after the outcome is known |
How to Backtest an SMC Strategy
Do not backtest “SMC” as one giant strategy. Test one exact setup. A useful specification includes:
- Instrument and contract: for example, MES front-month with a written rollover method.
- Session and timezone: include the exact start and end times.
- Timeframes: one for context and one for the trigger.
- Swing definition: fixed-bar pivot, minimum move, or another repeatable rule.
- Liquidity rule: level type and tolerance in ticks or points.
- Displacement rule: measurable candle or structure criteria.
- Entry and invalidation: exact price behavior, not a visual impression.
- Exit rule: fixed target, structural target, time exit, or tested management rule.
- Costs: commissions, fees, and a stated slippage assumption.
- Journal fields: screenshot before entry, pass/fail for every rule, maximum favorable and adverse excursion, and outcome.
Separate setup variants. A first-touch order-block entry and a confirmation entry are not the same strategy. A New York morning test and an overnight test are not the same sample. For more on sample planning, read how many trades to backtest a strategy.
Review win rate, average win, average loss, expectancy, maximum drawdown, losing streaks, and performance by context. Out-of-sample or forward testing matters because a rule can be fitted to the history used to create it. The CFTC warns that no trading system can guarantee profits.
SMC Hindsight and Confirmation-Bias Errors
- Moving the swing: selecting a different protected high or low after seeing the break.
- Renaming failed zones: turning an invalid order block into a breaker, mitigation block, or broader zone without a prewritten rule.
- Counting overlapping labels as separate evidence: an order block and FVG created by the same move may be one event, not two confirmations.
- Keeping winners and filtering losers: applying minimum gap size, session rules, or displacement thresholds only during review.
- Reading intent from outcome: calling a winning sweep “institutional accumulation” and a losing one “manipulation.” The chart does not prove either story.
- Ignoring skipped setups: recording trades taken but not qualified trades passed makes execution quality impossible to measure.
The fix is simple but not easy: freeze the labels at decision time. Save the before-entry screenshot, the exact rule values, and the invalidation price. Review the record, not the story you can tell later.
Smart Money Concepts FAQ
What Are Smart Money Concepts?
Smart Money Concepts is a practitioner framework for reading market structure, liquidity events, displacement, order blocks, fair value gaps, and range location. It organizes a trading hypothesis; it does not reveal every market participant’s identity or guarantee an outcome.
Does SMC Really Work in Trading?
SMC can produce testable strategies, but the labels alone have no universal win rate. Results depend on the exact definitions, instrument, timeframe, session, entry, invalidation, costs, and risk rules. Backtest one complete setup and keep the losing examples.
Is Smart Money Concepts Legit?
The observable parts (OHLC data, swing sequences, closes beyond levels, and three-candle non-overlaps) are legitimate chart facts. Claims that those shapes prove institutional intent or guarantee a return are interpretations that the chart alone cannot verify.
What Is the Difference Between SMC and ICT?
SMC is the broader retail vocabulary. ICT is a specific teaching system that popularized many overlapping terms and models. Traders often use the labels interchangeably, so define the actual chart rule instead of relying on the name.
Is SMC Better Than Price Action?
SMC is a form of price-action analysis. It is not automatically better than support and resistance, trend structure, or other technical frameworks. The better method is the one you can define, test, execute, and size consistently.
What Is the Best SMC Trading Strategy?
There is no universal best setup. A simple sequence of context, one liquidity event, displacement, one entry area, confirmation, fixed invalidation, and a preplanned target is easier to test than a chart covered with advanced labels.
What Timeframes Work for SMC?
SMC terminology can be applied to many timeframes, but faster charts create more noise and transaction costs. Choose one context timeframe and one trigger timeframe, then test that combination on the instrument and session you actually trade.
What Should Beginners Learn First?
Start with swing structure, BOS versus CHOCH, equal highs and lows, sweep versus breakout, one FVG definition, structural invalidation, and position sizing. Add advanced terminology only when it solves a failure found in your journal.
A Better Way to Use Smart Money Concepts
SMC is most useful as a shared language for a decision process. It is least useful as a certainty story about invisible participants.
Pick one setup. Write the observable conditions, confirmation, invalidation, size, and target. Save the chart before entry. Test it across a meaningful sample, including the setups that fail and the trades you correctly pass.
A clean loss can still follow a good process. A winning trade can still break every rule. Judge the system by the record, not by the last result.
Educational risk disclaimer: This article is for general educational purposes only and is not financial advice. Futures trading involves substantial risk and leverage can amplify losses. No Smart Money Concepts setup, chart pattern, or trading system can guarantee profits.
.svg)
.svg)
.svg)
.svg)






.webp)