.svg)

.svg)
.svg)



Table of Contents
- Futures volume and open interest at a glance
- How futures volume works
- How futures open interest works
- How each futures trade changes volume and open interest
- How to read price volume and open interest together
- When futures volume or open interest matters more
- Futures volume and open interest during contract rollover
- Common futures volume and open interest mistakes
- Where to find futures volume and open interest data
- Futures volume and open interest questions
- Using futures volume and open interest in a trading process
TL;DR: Futures volume counts every contract traded during a session and resets for the next session, while open interest counts contracts that remain open after clearing and carries forward until positions are offset, expire, or settle. Every matched contract adds to volume, but open interest rises only when both sides open new positions, falls when both sides close positions, and stays unchanged when an opening trade replaces a closing trade. Use volume to judge current activity and execution conditions, then use the change in open interest to estimate whether new participation or position exits are behind a price move.
Futures volume and open interest both count contracts, but they answer different questions. Volume tells you how much trading occurred over a period. Open interest tells you how many contracts still connect a buyer and seller after positions are netted and cleared.
That distinction matters because a busy market does not always attract new positions, and a market with substantial open interest may trade quietly for part of a session. Looking at both measures can help a trader separate short-term activity from longer-lasting participation.
Futures volume and open interest at a glance
Measure | Futures volume | Futures open interest |
|---|---|---|
What it counts | Contracts traded during a chosen period | Outstanding contracts that remain open |
When it changes | With every matched trade | After opening and closing positions are netted |
Reset behavior | Daily volume starts again for the next session | Carries forward until positions are offset, expire, or settle |
Typical data timing | Often available intraday | Official figures are commonly published after clearing or at the end of the day |
Main use | Current activity, liquidity, and move confirmation | Participation, position buildup, and trend commitment |
Directional signal | None by itself | None by itself |
Neither number is automatically bullish or bearish. A high reading can occur in a rising, falling, or flat market. The useful signal comes from the number's change, its relation to recent history, the price response, and the specific contract month being traded.
How futures volume works
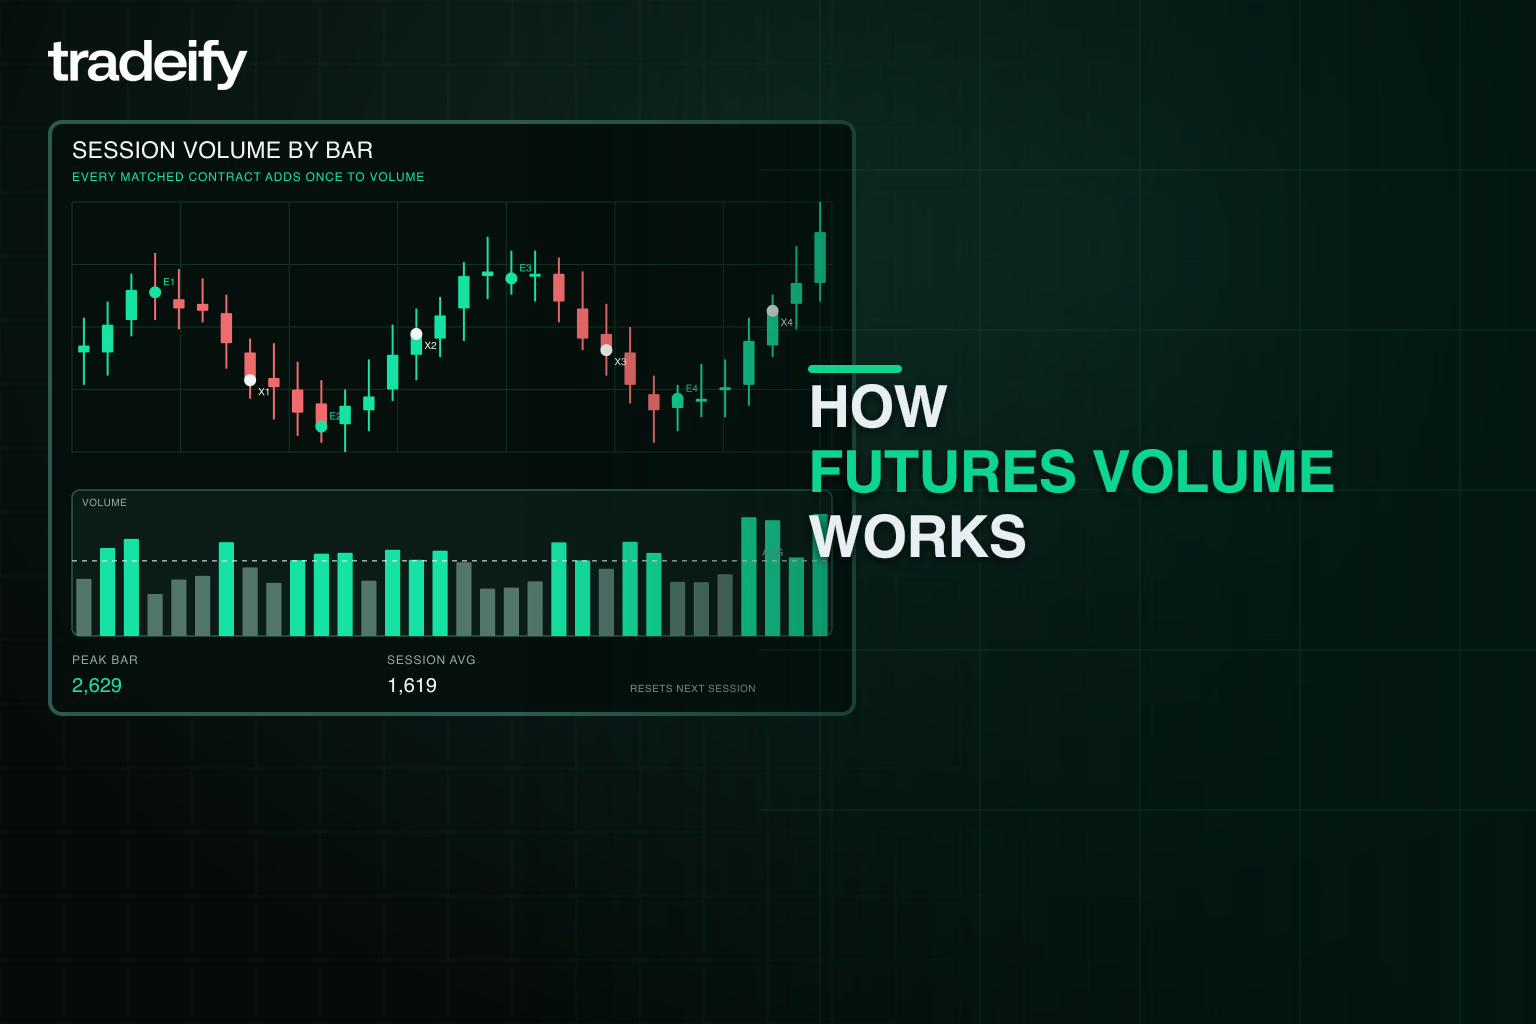
Futures volume is the number of contracts exchanged during a period. If 250 E-mini S&P 500 futures contracts trade, volume increases by 250. It does not increase by 500 simply because every contract has a buyer and a seller. The matched contract is counted once.
Traders can view volume for a single bar, a session, or another chosen interval. A five-minute bar shows contracts traded during those five minutes. Daily volume adds the session's trades and starts again for the next session.
What rising futures volume can show
Rising volume means more contracts are changing hands. When price breaks a well-watched level on volume that is high relative to the same time of day, the move has more participation than a break on light volume. That can support the move, but it does not prove that price will continue.
Volume is also useful for execution. Actively traded contracts usually have more orders near the current price, although volume alone does not guarantee a tight bid-ask spread or deep order book at the moment an order is placed.
What falling futures volume can show
Falling volume indicates less trading activity. A price move on declining volume may reflect weaker participation, a quiet time of day, a holiday session, or activity shifting to another contract month. It is context, not a trade command.
Intraday comparisons should account for the normal session curve. Index futures often trade more heavily near major market opens, economic releases, and the close. Comparing midday volume with opening volume can create a false weak-volume signal. Relative volume measured against similar times in prior sessions is usually more useful.
How futures open interest works
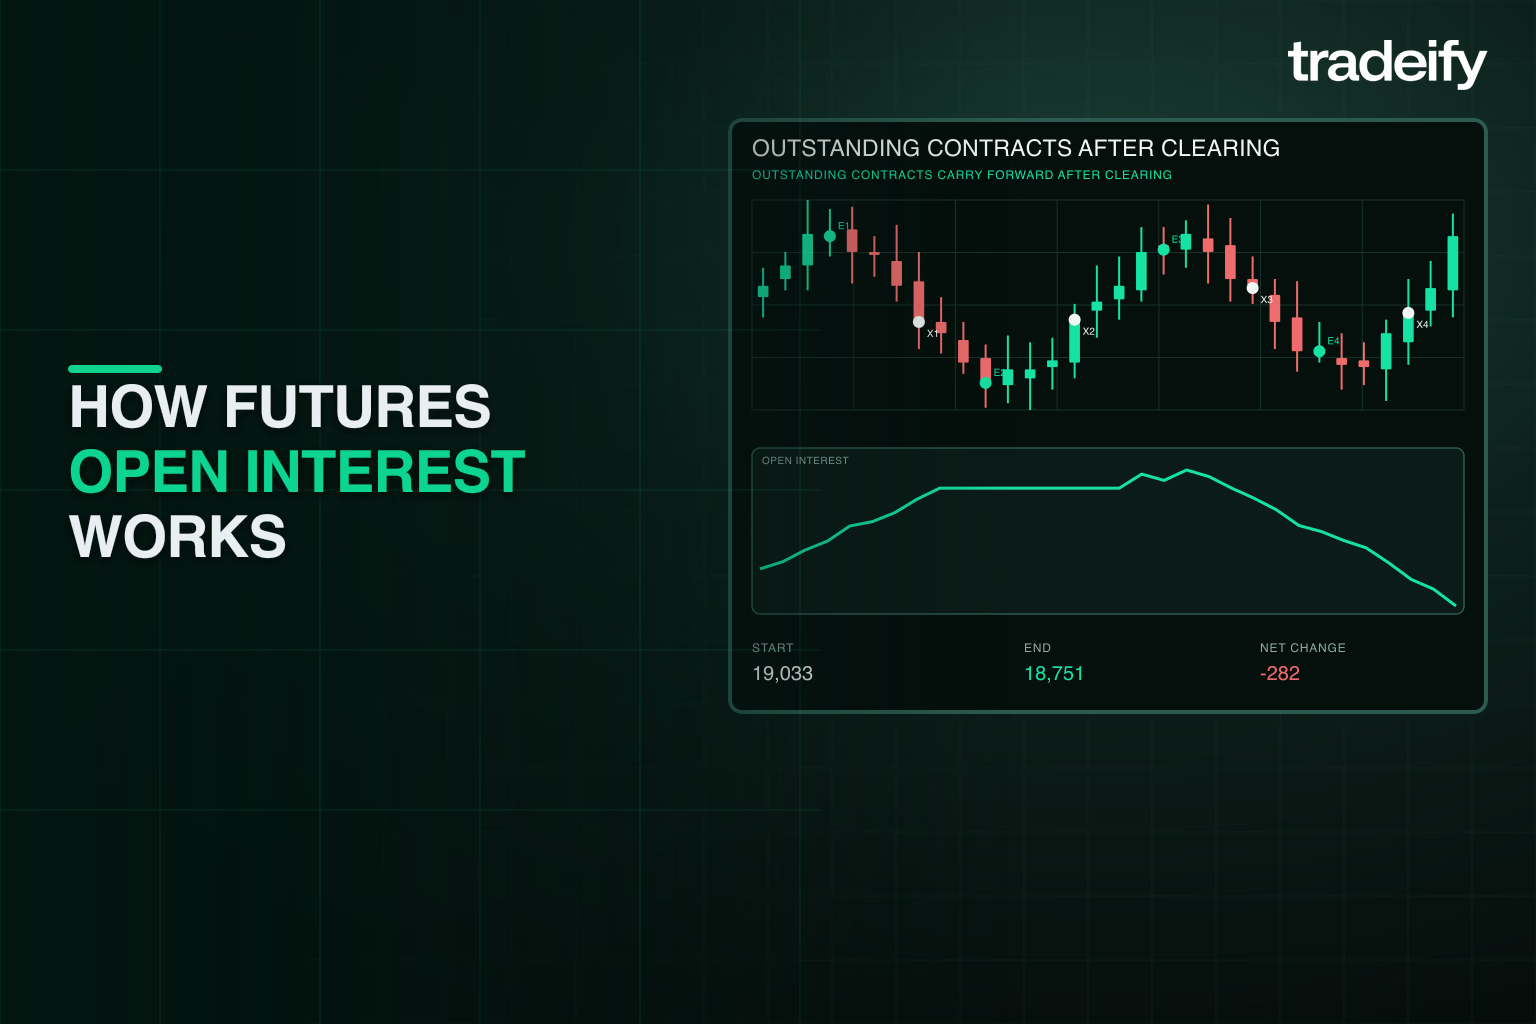
Open interest is the number of futures contracts that remain outstanding. One open contract always has a long side and a short side, but open interest counts that contract once.
The CME Group explanation of open interest describes it as the total number of futures contracts held by market participants at the end of the trading day. Open interest increases when new contracts are created and decreases when existing contracts are closed.
Suppose open interest in a futures contract is 10,000. If a new buyer and a new seller trade 100 contracts, open interest can rise to 10,100. If 100 existing longs close against 100 existing shorts, it can fall to 9,900. If new participants take over positions from participants who are exiting, it can remain at 10,000 even though those trades add to volume.
Why futures open interest changes after clearing
A trade screen shows buyers and sellers, but it does not always show whether each side is opening or closing a position. The clearing process nets participant positions to determine the official change in outstanding contracts. For that reason, official open interest is generally an end-of-day measure, even when a platform displays an intraday estimate.
Open interest also varies by contract month. June, September, December, and other expirations are separate contracts, so each has its own volume and open interest. Always confirm that you are comparing the same symbol and expiration.
How each futures trade changes volume and open interest
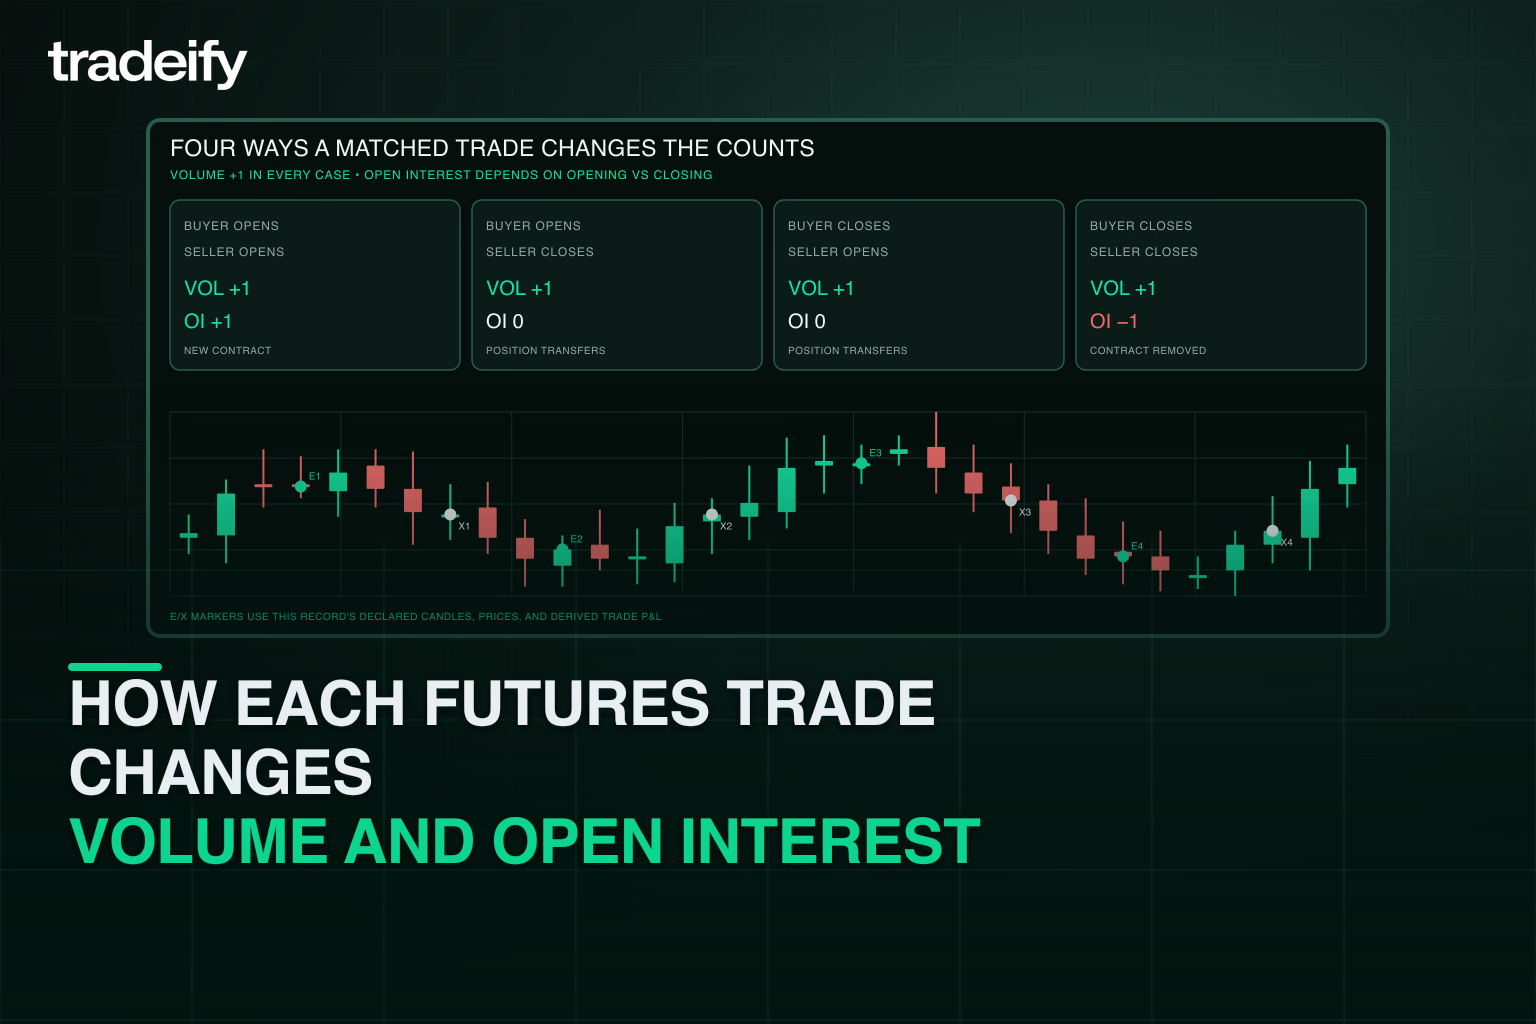
Every matched trade adds to volume. Its effect on open interest depends on whether the buyer and seller are opening or closing positions.
Buyer action | Seller action | Volume change | Open interest change | What happened |
|---|---|---|---|---|
Opens | Opens | Increases | Increases | A new contract is created |
Opens | Closes | Increases | No change | A position transfers from an exiting seller to a new buyer |
Closes | Opens | Increases | No change | A position transfers from an exiting buyer to a new seller |
Closes | Closes | Increases | Decreases | An existing contract is removed |
This table explains how daily volume can exceed open interest. The same outstanding position can change hands several times, and each transfer adds to volume without creating another open contract.
It also explains why open interest can be much higher than one day's volume. Open interest is a running stock of positions, while daily volume is a flow of transactions during one session.
How to read price volume and open interest together
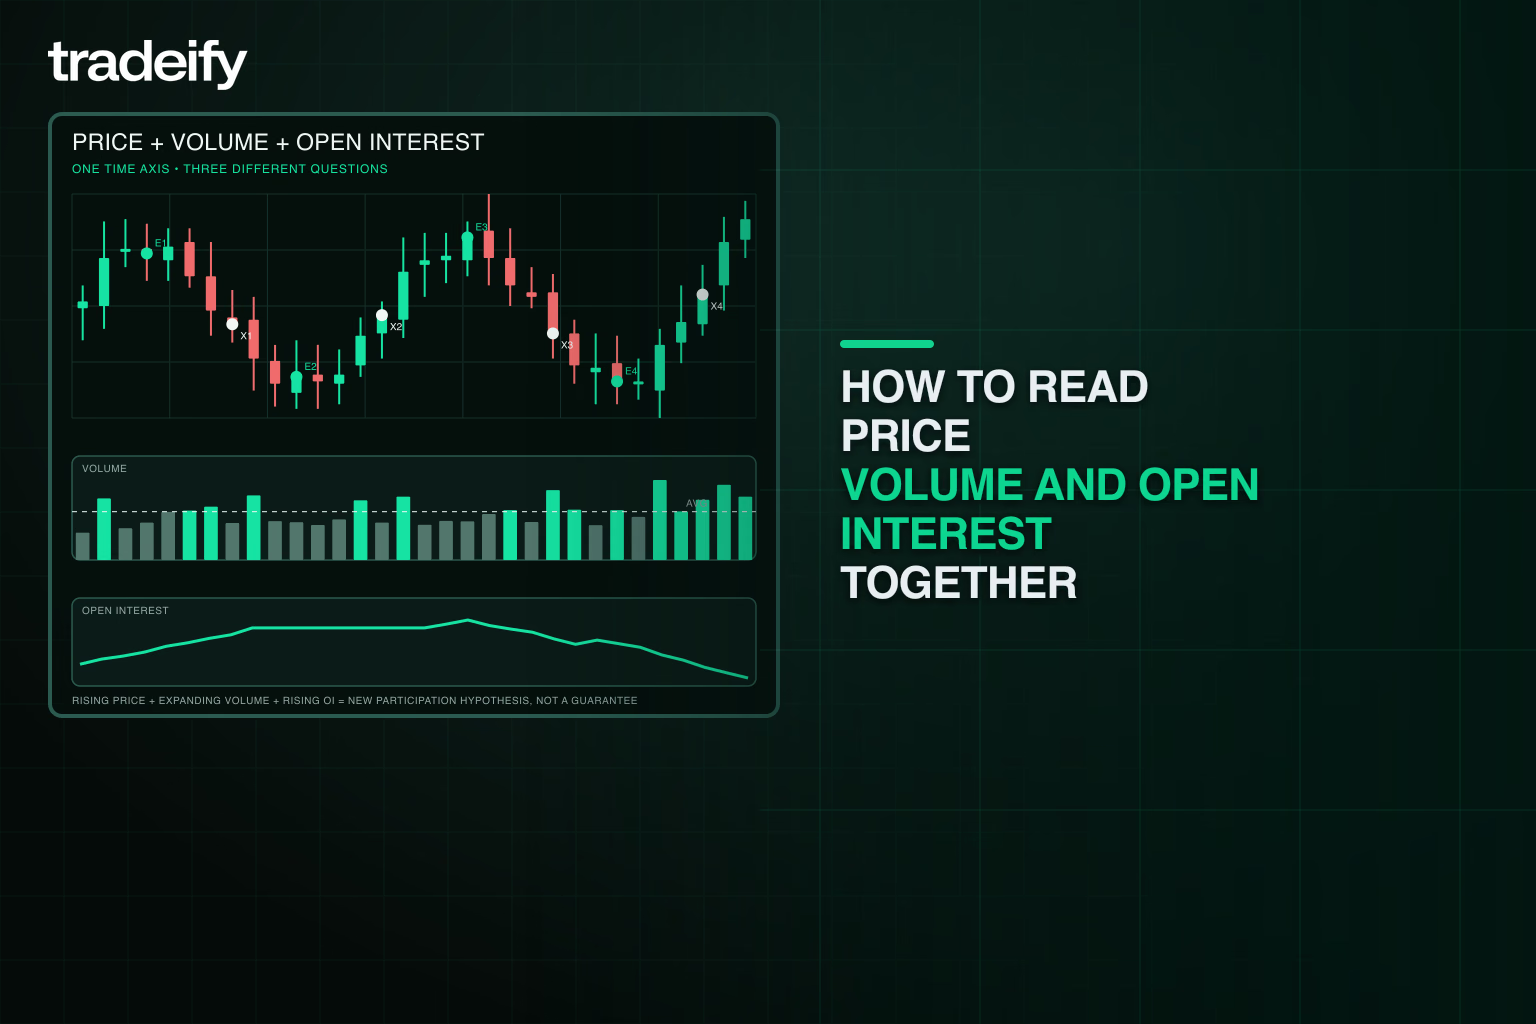
Price shows the result of buying and selling pressure. Volume shows how much trading accompanied the move. The change in open interest suggests whether outstanding participation expanded or contracted. Used together, the three measures support a more complete reading.
Price action | Volume | Open interest | Common interpretation | Main caution |
|---|---|---|---|---|
Rising | Rising | Rising | New participation may be supporting the advance | New positions can still be wrong and reverse quickly |
Rising | High | Falling | Position exits or short covering may be driving the rally | Falling open interest does not set a reversal time |
Falling | Rising | Rising | New participation may be supporting the decline | It does not reveal who will be forced to exit first |
Falling | High | Falling | Long liquidation or broad position reduction may be driving the decline | Liquidation can continue longer than expected |
Flat | Low | Rising | Positions may be building while price stays balanced | Open interest does not predict breakout direction |
These are hypotheses, not fixed rules. Open interest cannot identify every participant's motive, and a long and short are created together. The data shows position growth or contraction, not a simple count of bullish versus bearish traders.
Futures price rising with open interest rising
When price and open interest rise together, analysts often read the move as a trend supported by new participation. The conclusion is stronger when volume also expands and price holds above the breakout area. It is weaker when volume fades, price rejects the move, or the increase comes from rollover activity.
Futures price rising with open interest falling
A rally with falling open interest may reflect shorts closing positions, longs taking profits against new buyers, or a general reduction in exposure. Traders often call the first case short covering. Because the outstanding position count is shrinking, the rally may have less commitment from new positions. That does not make an immediate decline certain.
Futures price falling with open interest rising
A price decline with rising open interest can indicate new positions entering as the market falls. Many analysts treat that combination as support for the downtrend, especially when volume is strong and price closes near the session low. The data still cannot prove that new short sellers control the next session.
Futures price falling with open interest falling
When both price and open interest fall, existing positions are leaving the market. Long liquidation may be part of the move. The decline can lose force after enough positions are removed, but open interest alone cannot identify the turning point.
When futures volume or open interest matters more
For an intraday trader deciding which contract to trade now, volume usually matters more. Current volume, bid-ask spread, order-book depth, and slippage affect whether an order can be entered and exited efficiently. Open interest provides useful background but may be based on the prior session.
For a swing trader studying whether a multi-session move is attracting or losing participation, the change in open interest can add more context. Compare it with price, daily volume, volatility, and important technical levels rather than using it alone.
For contract selection, both matter. A contract with strong recent volume and substantial open interest is usually a better candidate than a thin contract with little activity. Still, verify the live spread and depth because yesterday's open interest cannot guarantee today's execution quality.
Futures volume and open interest during contract rollover
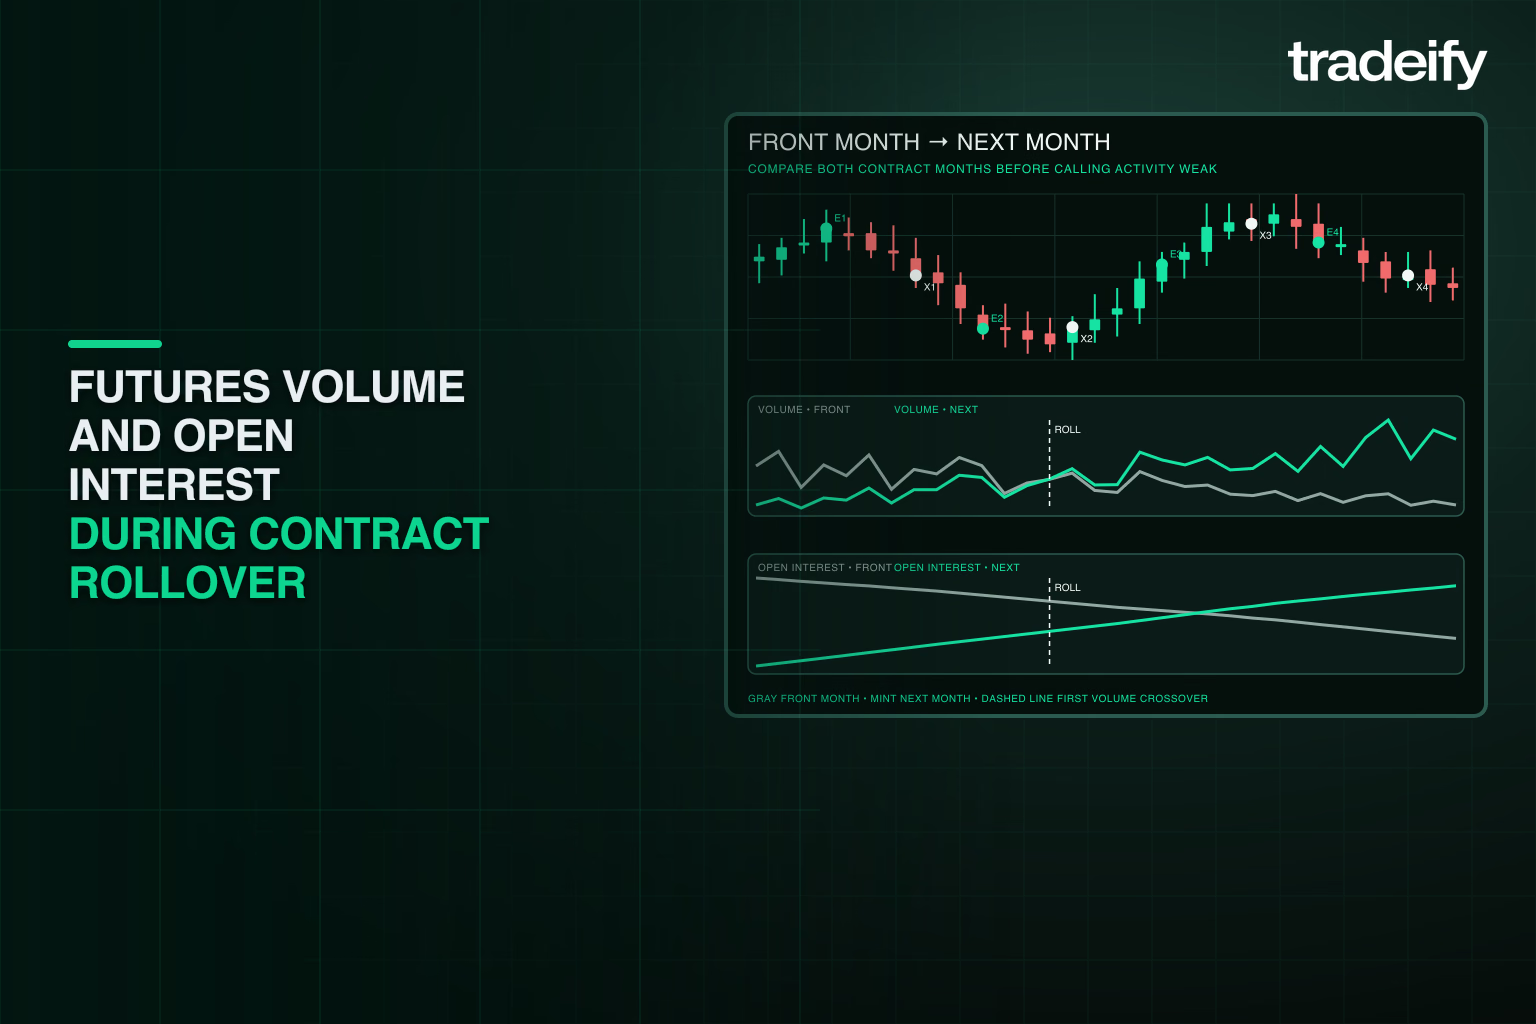
Futures expire, so activity shifts from the current contract to a later expiration. During rollover, volume and open interest can fall in the expiring month while rising in the next month. That transfer can look like participation is leaving the market when it is mainly moving along the futures curve.
Use these checks around rollover periods:
- Compare the same expiration from one day to the next.
- Review both the front month and the next active month.
- Check whether total activity across nearby expirations is stable.
- Use the contract with the strongest current execution conditions rather than relying only on a fixed calendar date.
- Confirm that chart indicators and historical levels use the intended continuous-contract adjustment.
Many platforms reduce the manual work around rollover. Tradovate typically prompts you to switch to the newer, more liquid contract as the rollover date approaches. Tradesea, for example, uses NQ1!, the continuous Nasdaq-100 futures symbol, and routes trades to the most liquid underlying contract on the back end. Even when the platform handles the switch, confirm the contract month on each order and whether the chart is continuous or contract-specific so your indicators and levels match the instrument being traded.
Rollover timing varies by product and trader convention. The contract with the nearest expiration is not always the contract with the highest volume.
Common futures volume and open interest mistakes
Treating high futures open interest as bullish
High open interest means many contracts are outstanding. Every contract has a long and a short, so the number does not reveal a bullish majority. Directional context comes from price behavior, changes in open interest, volume, and other evidence.
Treating futures volume as new money
Volume counts transactions, including repeated turnover and trades that close positions. High volume can occur while open interest falls because many participants are exiting.
Comparing unrelated futures contracts
Volume and open interest differ by product and expiration. Comparing raw numbers for Micro E-mini Nasdaq-100 futures with full-size crude oil futures says little unless contract size, normal activity, session, and expiration are considered.
Using delayed open interest as an intraday trigger
Official open interest often reflects end-of-day clearing. A platform may show the latest official figure beside real-time price and volume, which creates a timing mismatch. Read the timestamp and data definition before using the number.
Ignoring futures spreads and offsetting positions
Calendar spreads and other multi-leg positions can add open interest without expressing a simple outright price view. The CFTC's weekly reports even separate certain spreading positions when breaking down reportable traders. Open interest measures outstanding contracts, not a complete motive map.
Where to find futures volume and open interest data
Most futures platforms display intraday volume on charts and quote screens. For official exchange figures, use the exchange's daily reports. CME Group publishes a daily exchange volume and open interest report with activity across its divisions and asset classes.
Check four details before comparing data from different sources:
- Contract symbol and expiration
- Session cutoff and time zone
- Whether volume is real-time, estimated, or final
- Whether open interest is preliminary or cleared end-of-day data
For a broader view of participant categories, the CFTC Commitments of Traders reports break down Tuesday open interest for qualifying futures and options on futures markets and are generally released on Friday. COT data is useful for slower positioning analysis, not precise intraday timing.
Futures volume and open interest questions
What is the relationship between volume and open interest
Volume counts contracts traded during a period. Open interest counts contracts that remain open. Every trade raises volume, while open interest rises, falls, or stays the same depending on whether both sides are opening, both are closing, or one is replacing the other.
Can futures volume be higher than open interest
Yes. Contracts can change hands repeatedly during a session. Each trade adds to volume, but a transfer between an opening participant and a closing participant leaves open interest unchanged.
What if futures open interest is higher than volume
That is common. Open interest carries positions from prior sessions, while daily volume measures only the current session's turnover. The two numbers are a stock and a flow, so one does not need to stay below the other.
Is high futures open interest good
High open interest can indicate broad participation and may support liquidity, but it is not automatically good, bullish, or safe. Check current volume, spread, depth, volatility, and the position of the contract in its rollover cycle.
Does futures volume matter for day trading
Yes. Volume helps show when activity is expanding or contracting and can help confirm reactions at important price levels. For execution, combine it with the live bid-ask spread, order-book depth, and expected slippage.
Which matters more in futures trading
Volume is usually more useful for current activity and intraday execution. Open interest is usually more useful for outstanding participation and multi-session context. Most traders get a better read by using both with price and contract-specific timing.
Using futures volume and open interest in a trading process
Start with price, then ask two separate questions. Did volume expand enough to show meaningful activity? Did open interest rise or fall after clearing, suggesting that outstanding participation grew or contracted?
Keep the comparison tied to the same contract month and a relevant historical baseline. Around rollover, check nearby expirations before concluding that traders entered or left the broader market. Most important, treat volume and open interest as evidence to test a trade idea, not as standalone entry signals.
.svg)
.svg)
.svg)
.svg)







.webp)