.svg)

.svg)
.svg)



TL;DR: Lagging indicators confirm a move after price or another measured outcome has already changed. Moving averages and MACD can make a futures trend easier to see, but the extra confirmation can also leave you entering farther from invalidation and closer to the target. Before acting, run a confirmation-cost check: compare the new entry-to-invalidation distance with the reward still available. If the delay pushes risk beyond your cap or leaves less reward than your plan requires, skip the trade instead of widening the stop. Give each indicator one job, use it for confirmation rather than certainty, and review completed metrics such as drawdown, average loss, rule adherence, and late entries after the session. Pair those lagging numbers with leading behaviors, such as sizing before the order and recording the planned level in advance, so the review can change the next trade rather than just describe the last one.
You see the move, wait for confirmation, and enter just as price starts pulling back.
That is the trade-off built into every lagging indicator. More confirmation can make a trend easier to trust, but it can also leave less room between your entry and the point where the trade is wrong. Under evaluation or funded-account pressure, that difference matters. A late signal can tempt you to chase, widen a stop, or take more size because the move already looks obvious.
Lagging indicators are still useful. The key is giving them the right job.
What lagging indicators tell traders
A lagging indicator is a measurement that reacts after the activity it tracks has changed. It looks backward because its calculation or observation depends on present and prior data rather than information from the future.
In trading, the input is usually price, volume, or a calculation derived from them. Many indicators update while the current bar is forming, but they still respond only after their price inputs change. A MACD crossover cannot appear until the underlying moving averages have changed enough to cross.
That delay does not make the information false. It changes what the information can do.
A lagging indicator is strongest at:
- confirming that a trend or outcome has developed
- smoothing noisy data so the larger direction is easier to see
- measuring the result of a completed process
- comparing actual performance with a plan
- finding repeatable problems during review
It is weak at calling an exact top, bottom, or turning point before price moves. Treating confirmation as prediction is where traders get caught.
Leading, lagging, and coincident indicators
The label depends on timing. Ask when the measurement changes relative to the event you care about.
A leading indicator is the mirror of a lagging one. It is a measurable input that tends to move before the outcome you care about, so you can act on it while the result is still open. In business, hours of preventive maintenance run before downtime figures. In trading, a planned breakout level, a volatility expansion, or a completed pre-trade checklist can all act as leading inputs that arrive before the completed trade.
The reason traders keep both is that each one answers a different question at a different time. Leading inputs tell you what to prepare for while the decision is still open. Lagging measures tell you what your process actually produced once the decision is closed. A review built only on lagging data cannot change the trade you just took. A plan built only on leading guesses never checks whether the guesses earned their place. The pairing, not either half, is what keeps the process honest.
Indicator type | What it tells you | General example | Trading example |
|---|---|---|---|
Leading | What may happen next | Building permits that may precede construction activity | A planned breakout level or order-flow condition that may precede a move |
Coincident | What is happening now | Production or income data that moves with current activity | Current price behavior, range expansion, and liquidity at the decision point |
Lagging | What has already happened | Unemployment duration or a completed revenue period | A moving-average crossover or a completed-session drawdown figure |
Leading does not mean accurate. A leading condition can appear without the expected outcome. Lagging does not mean useless. A lagging measurement can confirm that a change is real enough to manage, measure, or study.
The three types work best as different parts of one process:
- leading information defines what you are watching for
- coincident information shows the market state at the decision point
- lagging information confirms the move or measures the result
If you ask one indicator to do all three jobs, you will probably change its interpretation whenever the trade changes.
Common lagging indicator examples
The search term appears in several fields, but the logic stays the same. The measurement follows the event.
Economic lagging indicators confirm a business cycle
The Conference Board publishes leading, coincident, and lagging indexes for the U.S. economy. Its lagging index includes measures such as average duration of unemployment, the inventory-to-sales ratio, the average prime rate charged by banks, and changes in service-sector consumer prices.
These measures can help confirm that an expansion or contraction has taken hold. They are less useful as an early warning because the broader shift has already begun by the time the lagging data turns.
For a futures trader, the practical point is simple: a market may reprice expectations before a backward-looking economic measure confirms them. A late economic confirmation can still explain the larger backdrop, but it does not automatically create a timely entry.
What a KPI is and what it measures
A key performance indicator, or KPI, is a quantifiable measure of progress toward a result you have defined. KPI.org describes KPIs as the critical, quantifiable measures of progress toward a desired result, used to decide whether effort is producing an effect. Lagging KPIs report outcomes that already happened. Leading KPIs measure inputs that can influence the next outcome. Your realized profit and loss is a lagging KPI. The number of times you sized the trade before entry is a leading one.
Business lagging indicators measure completed outcomes
Revenue, profit, customer retention, downtime, and completed-project results are common business examples. They show what a prior set of decisions produced.
The trading equivalent is your completed-session data. Realized profit and loss, maximum session drawdown, average losing trade, rule violations, and the number of trades taken outside the plan all describe outcomes that are already fixed. You cannot change yesterday’s result. You can use it to change tomorrow’s behavior.
Review dashboards work the same way in business and in trading. KPI.org notes that organizations typically balance leading indicators, which forecast performance, with lagging indicators, which reflect achieved outcomes, to guide both planning and review. Keep the trading version small. SimpleKPI reports that the average team tracks 7 to 9 KPIs at once, and a personal review sheet rarely needs more. Two columns are enough. Put each completed-session metric on the left and the behavior that controls it on the right, then update both after the close.
OSHA lagging indicators record past incidents
The Occupational Safety and Health Administration describes lagging safety indicators as measures of past events, including the number or rate of injuries, illnesses, and fatalities. It pairs them with proactive leading indicators that show whether prevention work is being performed.
That same pairing makes sense for traders. A rule breach is a lagging outcome. A pre-trade size check is a leading behavior. Tracking only the breach tells you the damage. Tracking the preventive behavior shows whether you are reducing the chance of repeating it.
Technical lagging indicators follow price
Common examples include:
- simple and exponential moving averages
- moving-average crossovers
- moving average convergence divergence
- trend-strength tools based on smoothed historical ranges
- performance dashboards calculated after trades close
Some tools can be used in leading or lagging ways depending on the question. An overbought reading may be treated as a possible reversal warning, while a crossover may be treated as confirmation. The useful distinction is not the marketing label. It is whether the signal anticipates, describes, or confirms the event you are trading.
Why traders use lagging indicators
If lagging indicators arrive late, why use them?
Because raw price can be noisy, and not every trader makes better decisions with more speed. Confirmation can create structure.
Lagging indicators reduce some market noise
A moving average compresses many prices into one line. That can make trend direction easier to see than a string of alternating candles. The smoothing also removes detail, which is why the line reacts more slowly.
Lagging indicators make rules easier to test
“The market looks strong” is difficult to evaluate. “Price closed above a rising moving average” is observable. A precise condition lets you review whether it helped, hurt, or added nothing.
Lagging indicators can slow impulsive entries
Waiting for a bar close, a crossover, or another defined confirmation can keep you from reacting to every intrabar push. That pause may be valuable if your main problem is anticipation without evidence.
The same pause becomes harmful when it turns into five layers of confirmation. By then, the signal may be clear because the opportunity is nearly gone.
Lagging metrics expose execution problems
Post-trade data can reveal patterns that are hard to notice in real time:
- losses become larger after the first losing trade
- entries occur farther from the planned level during fast markets
- size increases after a missed move
- trades outside the plan cluster late in the session
- one rule violation causes most of the drawdown
These are not forecasts. They are evidence about your process.
How moving averages lag price
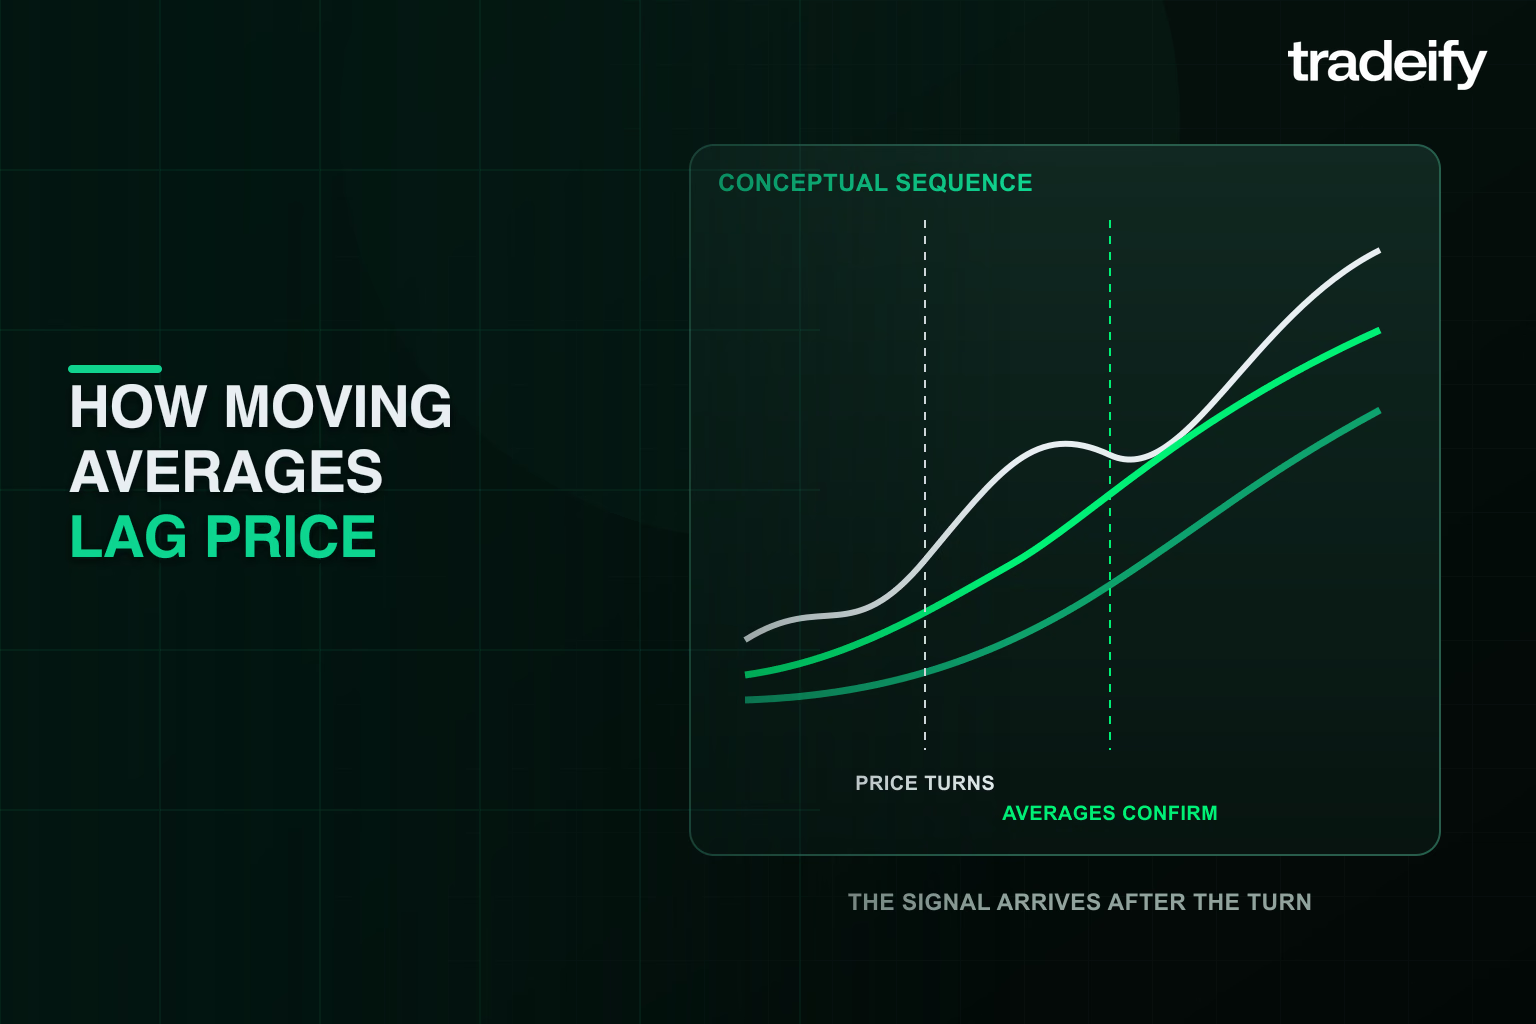
A moving average calculates the average price over a chosen number of periods. The CME Group moving-average lesson uses futures examples and explains the two common versions.
Simple moving averages give each price equal weight
A simple moving average adds the selected closing prices and divides by the number of periods. A 20-period SMA therefore reflects the last 20 completed inputs equally.
Longer lookback periods usually create a smoother, slower line. Shorter periods usually react faster but change direction more often. Neither setting removes uncertainty. It only changes the balance between speed and smoothing.
Exponential moving averages react faster
An exponential moving average gives more weight to recent prices. That makes an EMA follow price more closely than an SMA using the same period.
The trade-off remains. Faster response means less delay, but it also means more sensitivity to short-term movement. Fidelity notes that moving averages can help show the general trend while still delaying entry and exit.
Moving-average crossovers confirm after price moves
When a short-period average crosses above a longer-period average, traders often read it as bullish confirmation. A cross below is often treated as bearish confirmation.
The signal cannot occur until recent prices pull one average through the other. In a clean trend, that delay may help filter early noise. In a range, repeated crosses can produce a series of late entries and exits.
Before using a crossover, decide what question it answers:
- Is it a trend filter that permits only long or short setups?
- Is it an entry trigger?
- Is it an exit condition?
- Is it only a review label for classifying past trades?
Using the same cross for every decision creates conflicts. An entry tool may be too slow for risk control, while an exit tool may be too sensitive for trend classification.
How MACD confirms momentum
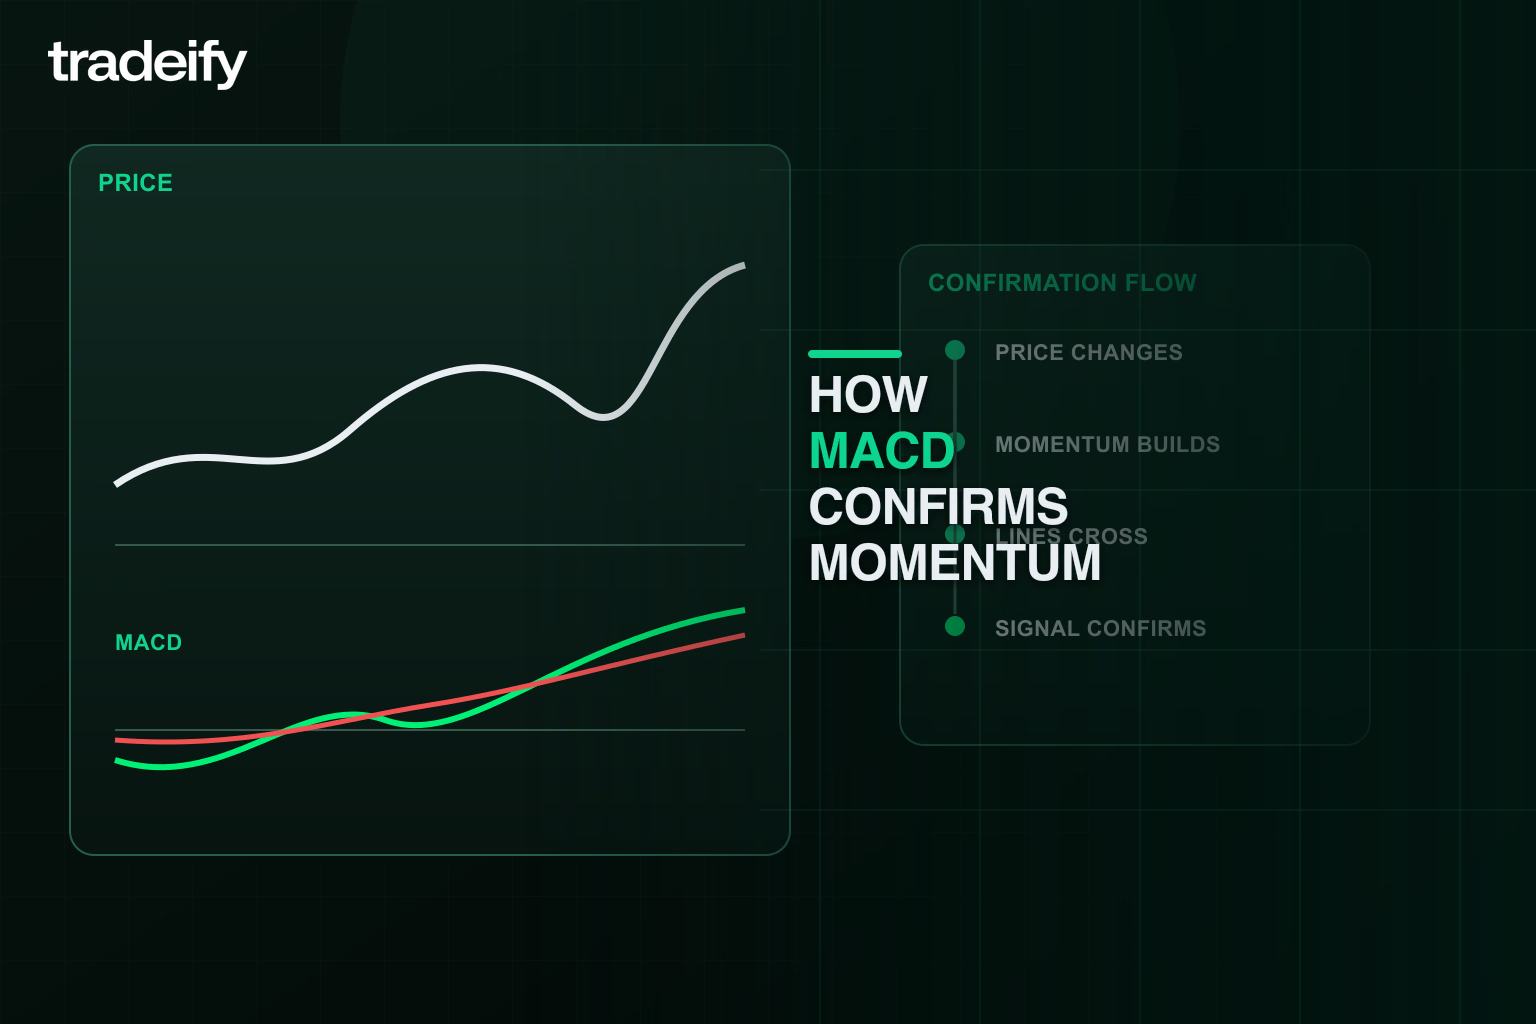
Moving average convergence divergence, or MACD, is built from moving averages. A common construction subtracts a longer EMA from a shorter EMA and compares that result with a signal line, which is another EMA.
That gives traders three common observations:
- whether the MACD line is above or below the zero line
- whether the MACD line has crossed its signal line
- whether indicator momentum and price are moving together or diverging
The CME Group oscillator lesson explains that oscillators use price history and remain a step behind the market. It also warns that an oscillator can stay at an extreme during a strong trend.
MACD works best as a defined confirmation
MACD can help answer a narrow question such as, “Has momentum shifted enough to support the trend idea?”
It cannot answer:
- whether the remaining reward justifies the distance to invalidation
- whether the next bar will continue in the same direction
- how many contracts fit your risk limit
- whether a trade complies with account rules
Those decisions require price structure and risk planning.
MACD can whipsaw in a range
When price moves back and forth without a durable trend, the underlying averages can repeatedly converge and diverge. Crossovers may alternate after each short swing.
Adding more lagging indicators rarely fixes this. If several tools are derived from the same price history, they may all confirm the same stale move. The chart looks more certain, but the evidence is not more independent.
How prop traders can use lagging metrics
Prop-firm traders have two sets of lagging indicators:
- chart indicators that follow market data
- account and behavior metrics that follow completed trades
The second group is often more useful during an evaluation or funded-account process because it shows how your decisions interact with risk constraints.
Lagging account metrics show the cost of behavior
Review metrics such as:
- maximum drawdown during the session
- average planned risk versus average realized loss
- largest loss and what caused it
- consecutive losses before you stopped trading
- trades taken outside the written setup
- entries taken after the planned level had already passed
- stop changes after entry
- rule warnings or violations
These numbers do not tell you what the next market move will be. They tell you whether your execution is compatible with staying inside your limits.
Leading trader behaviors can change the next outcome
Pair each result with an action you can complete before or during the next trade:
- calculate size before sending the order
- define the invalidation level before entry
- set a maximum acceptable distance from the planned entry
- decide what ends the session
- label the setup before taking it
- wait for the one confirmation required by the plan
- record any deviation immediately
This is where a lagging metric becomes useful. It identifies the leak. A leading behavior gives you something to do about it.
A four-part lagging indicator framework
Keep the trading process separate enough that one signal does not control everything.
Define the trader setup
State the market condition you want to trade. Examples include a pullback in an established trend, a breakout from a defined range, or a failed test of a prior level.
This is the idea. It is not yet an order.
Choose one lagging confirmation
Select the smallest confirmation that addresses your main uncertainty.
If your problem is trading against the broader trend, you might require price to be on the correct side of a rising or falling EMA. If your problem is entering before a breakout holds, you might require a completed close beyond the level.
Do not add a second indicator unless it contributes different information.
Define indicator invalidation
The trade is wrong at a price or market condition, not because an indicator “feels weaker.” Mark the level before entry.
If the lagging signal appears only after price is already far from invalidation, the trade may no longer offer acceptable risk. Missing that trade is a valid decision.
Set trader risk before the order
Calculate position size from the distance to invalidation and your predetermined loss cap. The indicator does not decide size.
The CFTC advises traders to understand the market, use only risk capital, and follow a plan suited to their own situation. Its customer advisory on short-term speculation also makes the important point that no signal program or past result can guarantee a future outcome.
In a simulated evaluation or funded account, your personal risk process must also fit the applicable account rules. Verify those rules directly and do not assume a chart signal overrides them.
Separate the three delays inside a lagging signal
“The indicator was late” is not a diagnosis. A signal can lose time in three different places, and only one of them comes from the indicator formula.
Delay | Where it comes from | What a trader can test |
|---|---|---|
Calculation delay | The lookback and smoothing rules need additional price data before the value changes | Whether a shorter setting adds useful speed or only creates more false changes |
Rule delay | The plan waits for a close, crossover, second bar, retest, or another confirmation event | Whether the extra condition improves outcomes enough to justify the price surrendered |
Execution delay | The trader notices the signal, chooses an order, sends it, and receives a fill | Whether hesitation, order choice, spread, or slippage creates more delay than the indicator |
Build a delay log with four timestamps or bar references:
- When price first met the raw setup condition.
- When the indicator produced the qualifying value.
- When every rule in the plan authorized the order.
- When the position actually filled.
Record the price at each point, plus the structural invalidation and logical target. Now the lost distance has an address. If most of it appears between the raw setup and the indicator, test the calculation. If it appears between the indicator and authorization, inspect the rule stack. If it appears after authorization, work on execution instead of changing the indicator.
Do not optimize each delay to zero. A confirmation rule is supposed to wait for evidence, and a limit order may intentionally trade fill certainty for price control. The question is whether the delay buys something measurable.
Review the delays separately across winners, valid losses, and skipped trades. If removing a delay increases false entries more than it improves location, the faster version is not automatically better. If a delay repeatedly leaves too little room to the target, the setup may be useful for direction but unusable as an entry.
Measure the cost of confirmation before you trade
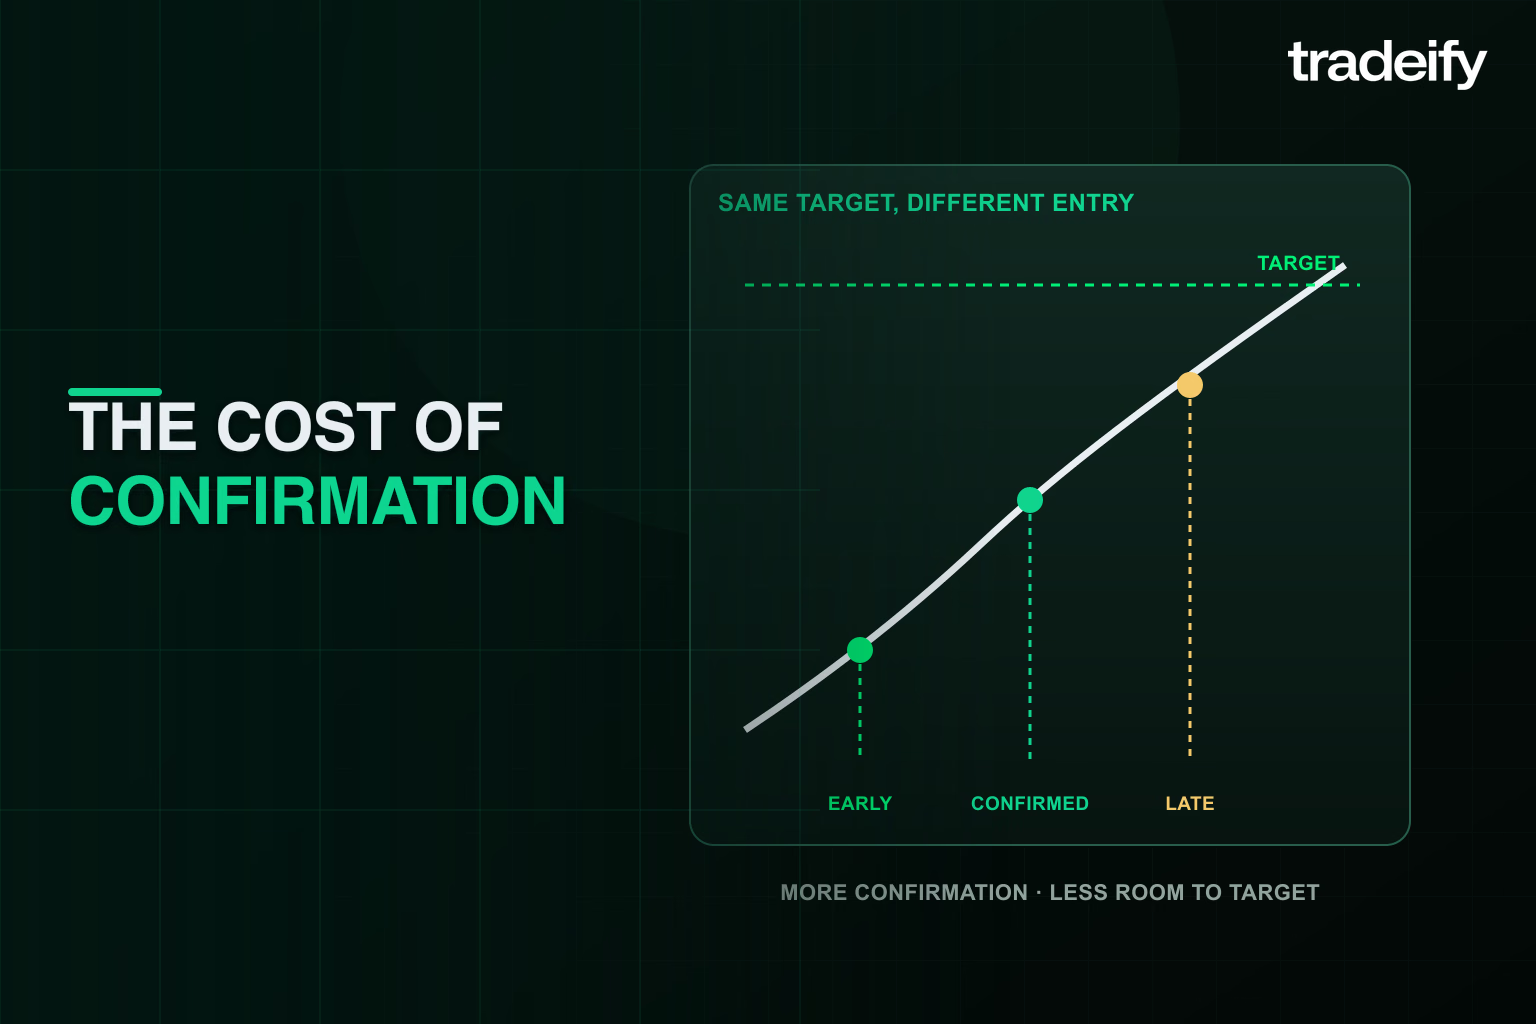
A lagging signal can make direction look clearer while making the actual trade worse. The signal may arrive after price has moved farther from invalidation and closer to the logical target. That delay is the cost of confirmation.
Before acting on the signal, write down four prices: your planned entry area, the confirmation entry, the invalidation level, and the logical target. Then compare:
- Risk distance: the absolute distance from the confirmation entry to invalidation
- Remaining reward: the absolute distance from the confirmation entry to the target
- Reward relative to risk: remaining reward divided by risk distance
If confirmation expands the risk distance beyond your loss cap or reduces the remaining reward below your tested minimum, the signal arrived too late for that setup. Do not move invalidation to rescue it. Skip the trade or wait for new structure.
A hypothetical futures confirmation example
Assume a long setup is invalid below 98 and has a logical target at 110. The prices below are hypothetical and exclude slippage, commissions, and contract value.
Entry condition | Entry | Risk distance | Remaining reward | Reward relative to risk |
|---|---|---|---|---|
Planned entry area | 102 | 4 points | 8 points | 2.0 to 1 |
First confirmation | 104 | 6 points | 6 points | 1.0 to 1 |
Late confirmation | 106 | 8 points | 4 points | 0.5 to 1 |
At 106, the indicator may be giving its strongest confirmation. The trade is still worse on the stated plan because the entry risks eight points to pursue four. A clearer trend does not automatically create a better entry.
Use a three-question confirmation gate
- Does the signal add information that is not already visible in price?
- Does the entry still fit your fixed risk cap without moving invalidation?
- Is enough reward still available under the minimum required by your tested plan?
If any answer is no, the indicator may still work as a trend label or review metric. It should not trigger that entry.
Common lagging indicator mistakes
Most indicator problems come from job confusion, not from a bad calculation.
Stacking lagging indicators that repeat price
An EMA crossover, MACD crossover, and another smoothed trend tool may look like three votes. If all three use the same price history, they may be variations of one vote.
Start by removing one. If the decision does not change, the removed tool was probably decoration.
Waiting until indicator confirmation ruins the trade
Confirmation can arrive after price has moved too far from a logical stop. Entering anyway turns a timing problem into a risk problem.
Do not widen invalidation to rescue a late signal. Skip the trade or wait for a new structure.
Changing indicator settings after every loss
A shorter lookback reduces lag but increases sensitivity. A longer lookback smooths more but reacts later. Constantly changing settings can fit the last few trades without improving the next decision.
Choose settings for a stated purpose, test them over a meaningful sample, and change them only when the evidence shows a consistent problem.
Treating lagging confirmation as certainty
A confirmed trend can end on the next bar. A crossover can fail. A strong historical pattern can stop working.
Confirmation should affect your decision process, not your respect for risk.
Using lagging outcomes to predict the next trade
A winning streak does not make the next setup safer. A losing streak does not guarantee a winner is due.
Use past results to evaluate behavior, market fit, and risk. Do not turn them into a reason to increase size.
How to choose a lagging indicator
There is no best lagging indicator for every trader, market, or timeframe.
Choose by question:
Question | Simple lagging tool | Main limitation |
|---|---|---|
What is the broader trend direction? | A single moving average or price relative to it | Turns after price and can flatten in ranges |
Has trend momentum shifted? | MACD line, signal, or zero-line condition | Can confirm late and cross repeatedly in chop |
Did my entry quality deteriorate? | Distance from the planned entry after each trade | Requires an honest planned level recorded in advance |
Is one mistake driving drawdown? | Losses grouped by rule deviation | Small samples can exaggerate a pattern |
Am I following the account process? | Completed checklist and violation rate | Measures compliance, not market edge |
Then apply four filters:
- Purpose: Give the indicator one job.
- Timing: Measure how late the signal appears relative to your invalidation level.
- Independence: Avoid multiple tools built from nearly identical inputs.
- Reviewability: Use a condition you can record as yes or no after the trade.
The best choice is often the one you can remove when it stops adding information.
A practical lagging indicator scorecard
A scorecard connects completed results to preventive actions. Keep it small enough to use every session.
Review question | Lagging metric | Leading action for the next session |
|---|---|---|
Did I enter too late? | Entries beyond the planned area | Record the acceptable entry area before the setup triggers |
Did losses exceed the plan? | Planned risk versus realized loss | Calculate size and place invalidation before entry |
Did emotion change my behavior? | Trades, size, or loss after the first setback | Define the session stop before the open |
Did the indicator add value? | Results with and without the confirmation | Test one condition at a time over a larger sample |
Did I respect account constraints? | Warnings, violations, or proximity to limits | Check current rules and remaining risk before each order |
Do not judge the scorecard only by profit and loss. A clean losing trade can follow the plan. A profitable rule break can still be a process failure.
The purpose is to make the next decision more controlled, not to make the past look better.
Frequently asked questions about lagging indicators
What are examples of leading and lagging indicators?
Business examples pair building permits, which lead construction activity, with revenue or downtime figures, which report completed outcomes. Trading examples pair a planned level, a volatility expansion, or a completed pre-trade checklist, which arrive before the trade, with a moving-average crossover, realized profit and loss, or a completed-session drawdown figure, which arrive after it.
How to tell leading vs lagging?
Ask when the measurement changes relative to the event you are trading. If it moves before the outcome is decided, it is being used as a leading input. If it can only be calculated after the outcome exists, it is lagging. Some tools work both ways, so the label depends on the question you ask, not on the tool alone.
Are all technical indicators lagging?
Most technical indicators use historical or current market data, so they lag price to some degree. Traders may still use a tool in a leading way when they treat it as an early warning. Focus on what the signal does in your process rather than arguing over a permanent label.
Is MACD a lagging indicator?
Yes. MACD is calculated from moving averages of historical prices, and its signal line is also a moving average. It is generally used to confirm trend momentum or a shift after the underlying prices have moved.
Is RSI a leading or lagging indicator?
The classification depends on use. RSI is calculated from past price changes, so the calculation follows price. Traders often use overbought, oversold, or divergence readings as leading-style warnings about a possible reversal. That warning can remain in place while a strong trend continues, so it is not a prediction.
Can lagging indicators predict future prices?
They can provide context for a trading decision, but they cannot predict a future price with certainty. Their primary strength is confirming and measuring what has already developed.
What is the best lagging indicator?
There is no universal best. Moving averages are simple for trend direction, while MACD adds a view of trend momentum. The better choice is the one that answers your defined question without forcing a late entry or duplicating another tool.
Use lagging indicators without trading late
Lagging indicators should make your process clearer, not your chart busier.
Define the setup. Require only the confirmation that matters. Keep invalidation tied to price. Size the trade before the order. Then use completed results to find the behavior that needs work.
You do not need an indicator to make the market certain. You need a process that keeps one uncertain trade from becoming a preventable drawdown problem.
.svg)
.svg)
.svg)
.svg)







.webp)