.svg)

.svg)
.svg)


TL;DR: Momentum trading strategies try to join a price move that is already showing strength, then exit before that strength fails. A usable futures strategy needs more than an RSI reading or moving-average crossover. Define the market, session, trend filter, entry trigger, invalidation point, stop, position size, exit, maximum attempts, and no-trade conditions before you enter. Breakouts, pullback continuations, moving-average or MACD setups, and relative-strength selection can all be tested, but none is universally best. Liquidity, slippage, news risk, market regime, and account drawdown rules can change the result. Test one complete rule set with realistic costs, then judge it by expectancy, drawdown, rule adherence, and consistency rather than a few winning trades.
Table of Contents
- How momentum trading strategies work
- Four momentum trading strategies to test
- Momentum indicators that improve decisions
- How to build momentum strategy rules
- The best timeframe for momentum trading
- Momentum trading under prop firm rules
- Use a momentum chase-distance test
- Common momentum trading mistakes
- How to test a momentum strategy
- Do momentum trading strategies work
- Build one momentum playbook
How momentum trading strategies work
The hard part of momentum trading is not finding a market that is moving. It is deciding whether you are early enough to join the move without buying the top, selling the bottom, or giving a late entry more risk than it deserves.
Momentum trading starts with a continuation hypothesis: recent directional strength may persist long enough to create a trade. A long setup looks for strength that can continue higher. A short setup looks for weakness that can continue lower. The trade ends when price reaches a planned objective, momentum weakens, or the original idea is invalidated.
That definition sounds simple. Execution is not. FINRA’s momentum overview notes that traders use price, volume, or open interest to judge whether movement may continue, while also warning that momentum can change quickly and indicators can give false signals.
For a futures trader, the setup has four parts:
- Direction: Which side currently controls price?
- Location: Is the entry near a meaningful breakout or pullback level, or is price already extended?
- Confirmation: What observable event shows that the move is continuing?
- Invalidation: What price action proves the idea wrong?
If one part is missing, the strategy is not complete. “The market looks strong” is an observation. “Buy the first five-minute close above the opening range when the higher-timeframe trend is up, then exit below the breakout level” is a testable rule.
Time-series and cross-sectional momentum
Two ideas share the momentum label.
Time-series momentum compares a market with its own past. If a futures contract has been rising over the selected lookback, the strategy treats that history as a possible long signal. Most discretionary breakout, trend, and pullback setups fit this general idea.
Cross-sectional momentum compares several markets with one another. A trader might rank a futures watchlist by recent performance, then focus on the strongest market for a long setup or the weakest for a short setup.
The distinction matters because academic evidence about a diversified, multi-month futures portfolio does not prove that a one-minute breakout rule has an edge. Same label, different signal, holding period, costs, and risk.
Momentum and trend following
Momentum and trend following overlap, but they are not identical.
Momentum usually emphasizes the speed or strength of a recent move. Trend following emphasizes sustained direction and often accepts later entries or longer holding periods. A fast breakout after a data release may be a momentum trade. A slower moving-average system that stays with a multiweek move is closer to trend following.
Mean reversion starts with the opposite hypothesis. It expects an extended move to retrace toward a reference such as an average or prior value area. Mixing the two ideas causes avoidable mistakes. An RSI reading above 70 can mean “too extended” to a mean-reversion trader, while a momentum trader may see strong demand that can persist. The entry and invalidation rules must reveal which hypothesis you are trading.
Four momentum trading strategies to test
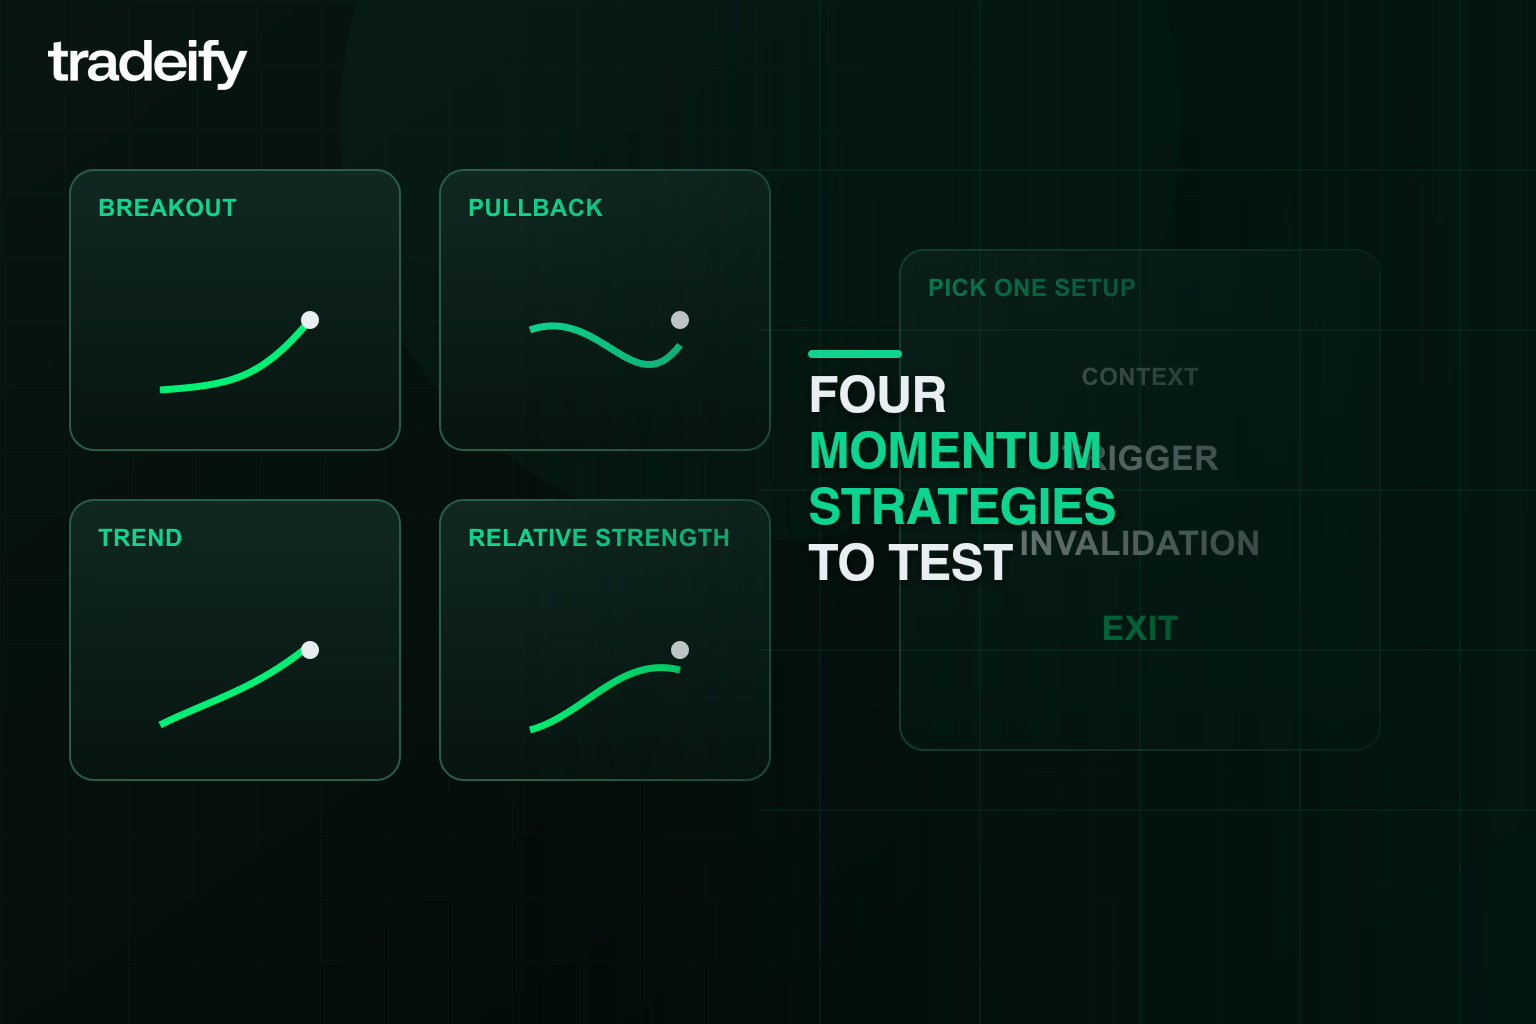
No setup is automatically best. Each strategy trades a different part of the move and creates a different risk profile.
Strategy | Core idea | Possible trigger | Main failure mode |
|---|---|---|---|
Breakout continuation | Price leaves a defined range with strength | Close or acceptance beyond resistance or support | False break and fast return into the range |
Pullback continuation | Price retraces within an established directional move | Rejection of a prior breakout, average, or structure level | Pullback becomes a full reversal |
Moving-average or MACD continuation | Trend and momentum align after a reset | Price reclaims an average or MACD turns with the trend | Repeated crosses in a range |
Relative-strength selection | Trade the strongest or weakest market in a watchlist | Leader resumes after confirmation | Leadership rotates after entry |
Breakout momentum strategy
A breakout strategy waits for price to move beyond a level that contained prior trading. Common references include an opening range, prior session high or low, consolidation boundary, or intraday swing.
A complete breakout plan answers:
- What defines the range?
- Must price trade beyond the level, close beyond it, or hold beyond it?
- Is higher volume or stronger order-book activity required?
- How far beyond the level is too extended to enter?
- Where is the trade invalidated?
- Will the exit use a fixed objective, trailing structure, or momentum failure?
The no-chase rule matters. A breakout that has already traveled most of its normal swing before your entry may offer poor reward relative to the stop. Missing the trade is cheaper than inventing a wider stop after the move has started.
Pullback momentum strategy
A pullback strategy waits for an established move to pause or retrace, then enters when the original direction resumes. It can offer a closer invalidation point than an extended breakout entry.
For a long setup, the sequence might be:
- Higher-timeframe price structure is rising.
- Price breaks a defined resistance area.
- The pullback holds above or near that area.
- Buyers regain control with a higher low, rejection candle, or break of the pullback structure.
- The trade is invalidated below the level that should have held.
Do not assume every dip in an uptrend is a pullback. The setup becomes a reversal when the market breaks the structure your continuation idea depends on. Widening the stop after that break changes the trade instead of managing it.
Moving-average and MACD momentum strategy
Moving averages can filter direction or mark a reset area. MACD compares moving averages to show changes in momentum. A trader might require price to remain above a selected average, wait for a pullback, and then use renewed momentum as confirmation.
This approach is easier to define than “strong price action,” but it is still vulnerable to lag. In a sideways market, price and indicator lines can cross repeatedly. A crossover without location or market-regime context can create a string of small losses.
Use the indicator to answer a specific question:
- Is the trend direction aligned with the trade?
- Did momentum strengthen after the pullback?
- Is the move losing strength near the target?
If the indicator does not change a decision, it is decoration.
Relative-strength momentum strategy
Relative-strength selection ranks markets by recent performance. A futures trader could compare a small group of equity-index, energy, metal, or rate contracts and direct attention toward the clearest leader or laggard.
Ranking is a selection tool, not an entry by itself. The strongest contract can still be overextended, illiquid during the selected session, or close to a scheduled event. Require the same location, trigger, and invalidation rules you would use on any other setup.
Do not size different futures contracts equally just because their charts look similar. Tick value, volatility, stop distance, and contract specifications determine the dollars at risk.
Momentum indicators that improve decisions
Indicators summarize price or activity. They do not remove uncertainty. Start with price structure, then add only the information needed to confirm or reject the setup.
Price structure and momentum
Price must show what your strategy defines as continuation. That might be:
- Higher highs and higher lows for a long setup
- Lower highs and lower lows for a short setup
- Acceptance beyond a prior range
- A pullback that holds the breakout area
- Expansion after a period of compression
The words must become rules. For example, define whether “acceptance” means one close, two closes, a retest, or a minimum amount of time beyond the level. Without a definition, a trader can reinterpret the chart after every result.
Volume, open interest, and liquidity
Volume can help show whether participation expanded with the move. Open interest can add context for some futures analyses, although it is not a real-time entry command. Neither proves continuation.
Liquidity affects whether the planned trade is executable. CME Group’s liquidity guide identifies volume, open interest, bid-offer spread, and order-book depth as common gauges. Thin conditions can increase slippage, turn a clean chart level into a poor fill, and make a small theoretical stop expensive in practice.
Check liquidity in the session you actually plan to trade. A contract can be active during its core hours and much thinner later.
MACD, RSI, and stochastic momentum
CME Group’s oscillator lesson explains three common tools:
- MACD estimates trend momentum through the relationship between shorter and longer moving averages.
- RSI compares the size of recent up moves with recent down moves on a scale from 0 to 100.
- Stochastics compares the recent close with the market’s recent range.
Traditional RSI readings above 70 or below 30 are often described as overbought or oversold. They are not automatic reversal signals. Strong trends can remain extended. MACD and stochastic signals can also lag or whipsaw.
A cleaner process gives each indicator one job. Use a moving average for direction, price structure for the trigger, and one momentum measure for confirmation. Adding five indicators built from the same price data can make the chart look more certain without adding independent evidence.
How to build momentum strategy rules
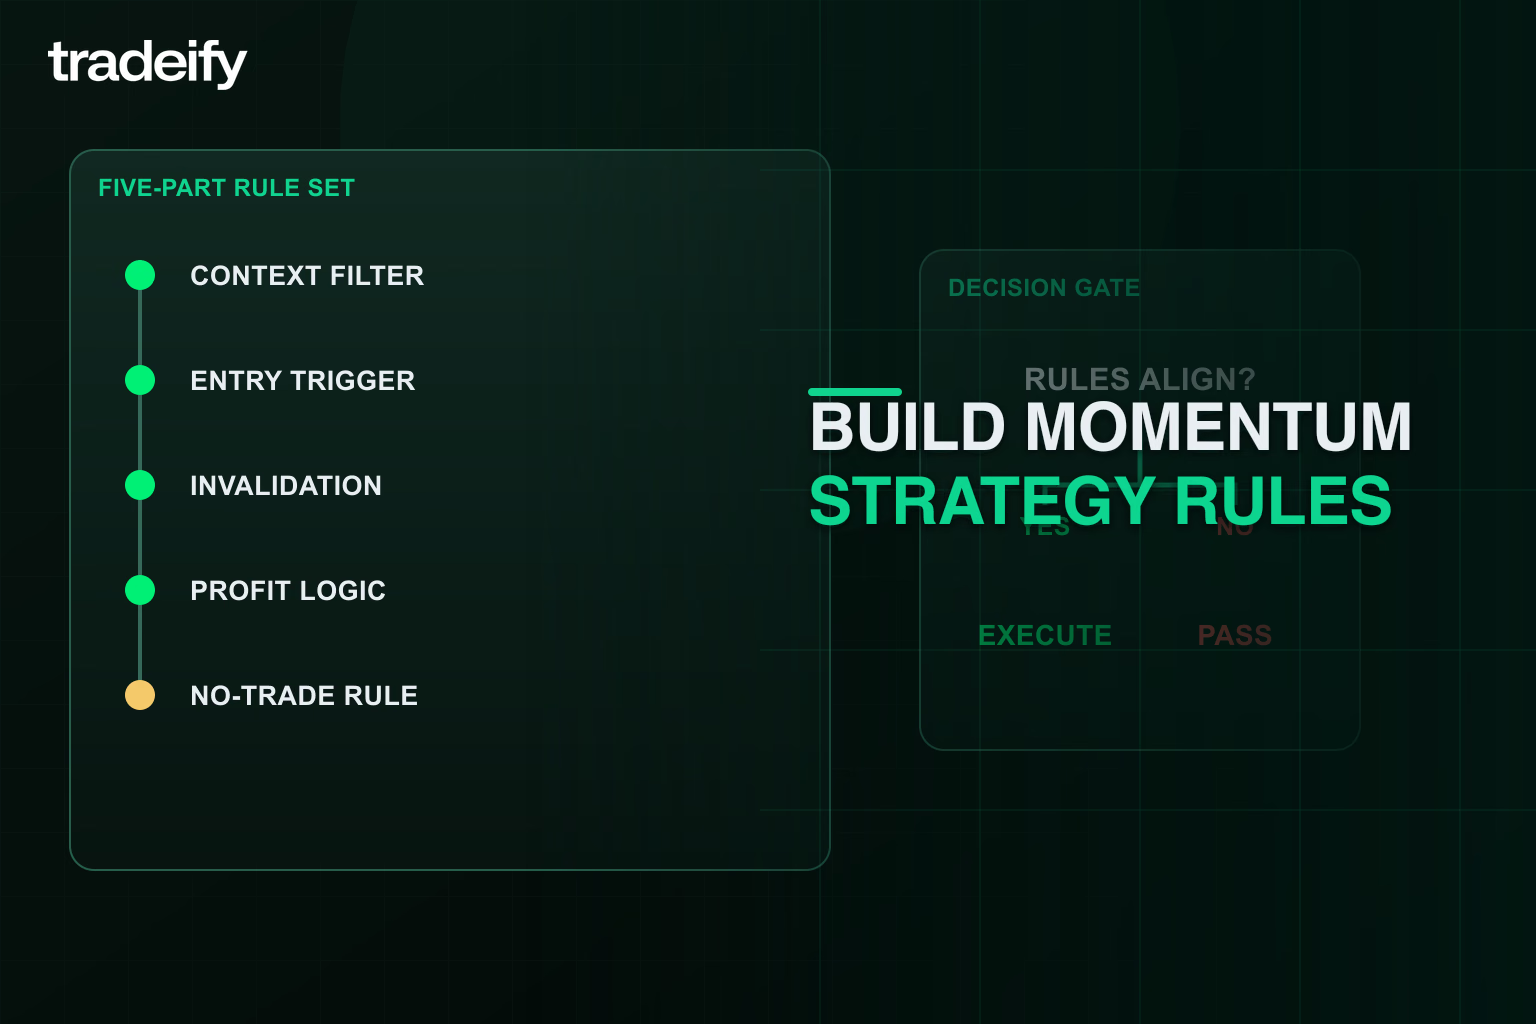
A strategy should be clear enough that another trader can mark the same valid and invalid setups from the same chart.
Define the market and session
Choose the contract, session, and days you will test. Record the tick value, normal liquidity window, scheduled reports that affect the market, and any time when you refuse new entries.
Define the directional filter
Use an observable condition, such as higher-timeframe structure, price relative to a moving average, or a breakout from a defined range. Avoid labels such as “bullish feel.”
Define the setup
State which strategy family you are trading. A breakout and a pullback continuation should not share a vague entry rule.
Define the trigger
Specify the event that authorizes entry. Examples include a bar close beyond a level, a retest that holds, or a break of the pullback’s last swing. Decide whether limit, stop, or market execution fits the rule and how much slippage makes the trade invalid.
Define invalidation and the stop
Place invalidation where the trade idea is wrong, not where the desired dollar loss produces a convenient chart point. Then calculate whether that structural stop fits the risk budget.
A stop order is a risk tool, not a guaranteed fill. Fast markets can execute beyond the stop price. That possibility belongs in both testing and position sizing.
Calculate position size
Use the planned account risk and the dollar value of the stop:
maximum contracts = planned dollar risk / risk per contract
Suppose the plan allows $150 of risk and the structural stop represents $60 per contract after estimated costs. The unrounded result is two and a half contracts, so the position rounds down to two. Planned risk is about $120, not including any slippage beyond the estimate.
If one contract exceeds the risk budget, skip the trade or use a smaller related contract when the account permits it. Moving the stop closer only to make the size fit can place the stop inside normal noise and change the tested setup.
Define the exit
Choose the exit before entry:
- Fixed reward relative to initial risk
- Prior high, low, or measured structure
- Partial exit plus a trailing stop
- Close below or above a continuation level
- Momentum failure confirmed by price
- Time stop when the expected expansion does not occur
Every exit has a tradeoff. A tight target can improve the hit rate but cut off larger moves. A trailing exit can capture trends but give back open profit. Test the complete entry and exit pair.
Define daily limits and no-trade conditions
Decide the maximum number of attempts, maximum daily loss, and conditions that end trading. No-trade conditions might include poor liquidity, an unusually wide spread, price already extended beyond the entry zone, a major scheduled release too close to the trigger, or a range that is too narrow to justify the expected costs.
The rule that keeps you out is part of the strategy.
The best timeframe for momentum trading
There is no universally best timeframe. The right choice depends on the signal, holding period, contract, session, costs, and risk limits.
A practical structure uses two timeframes:
- A higher timeframe for market direction, major levels, and regime
- A lower timeframe for the entry trigger and invalidation
The gap between them should not be so wide that they describe unrelated moves. A daily trend may offer useful context, but it does not automatically validate every one-minute breakout.
Shorter charts create more signals and more noise. They also make spread, slippage, latency, and rapid decision-making a larger part of the result. Longer charts reduce the number of decisions but often require wider stops and more tolerance for open equity swings.
Choose the timeframe that lets you execute the written rules without violating the risk budget. Then test it in the exact session you plan to trade.
Momentum trading under prop firm rules
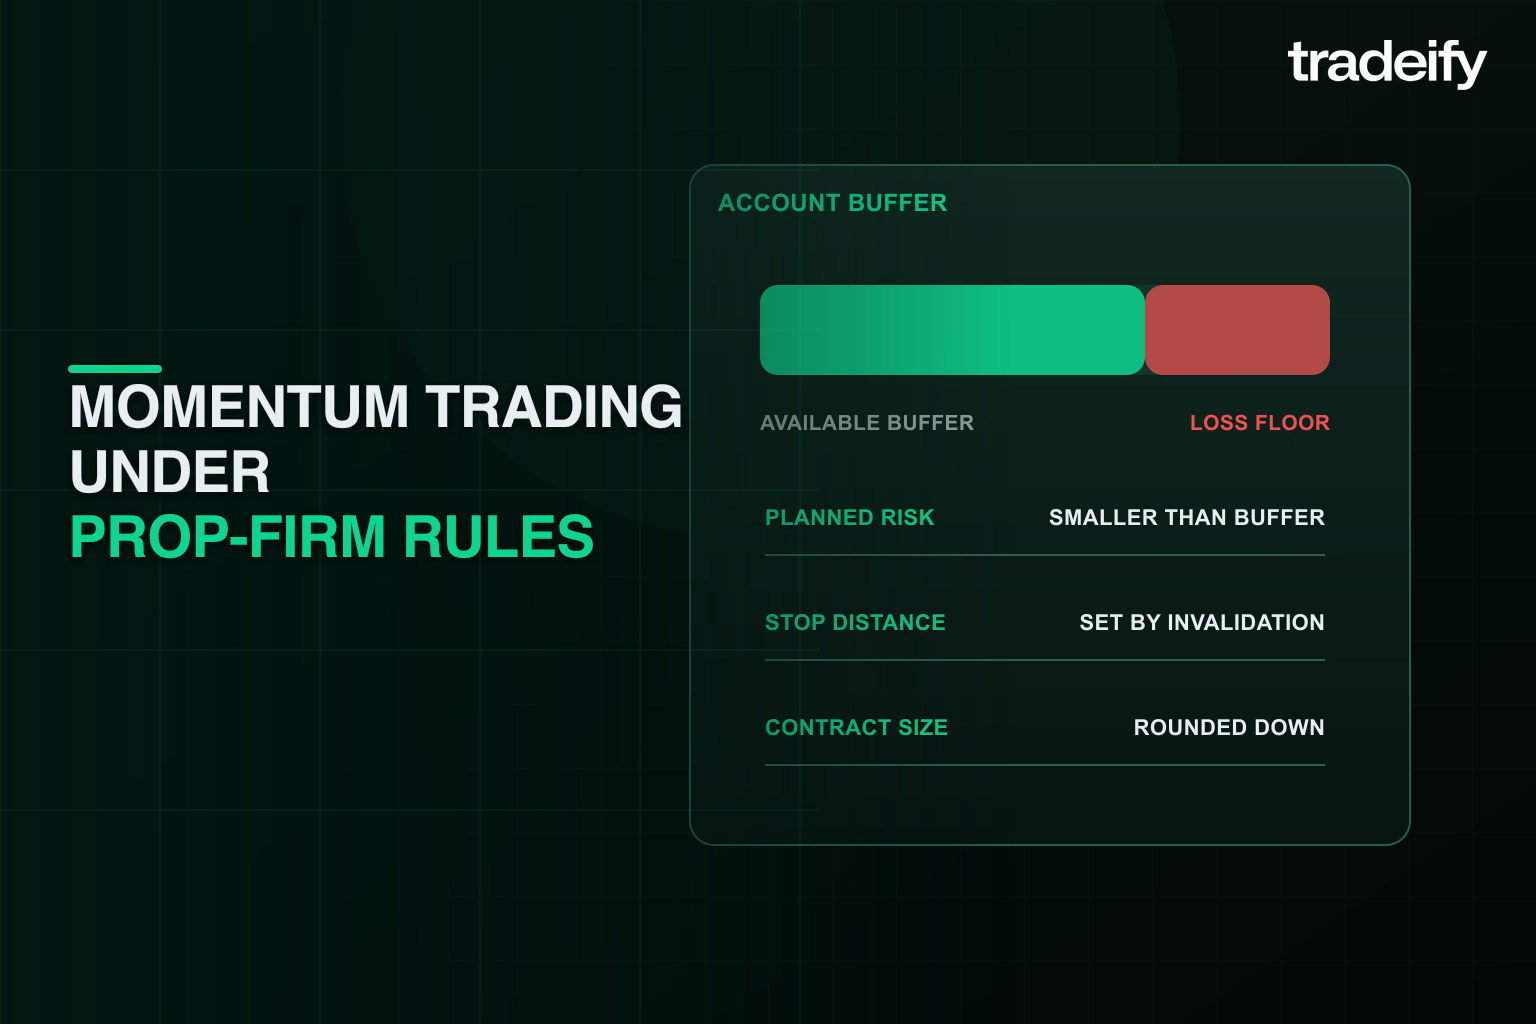
In a prop evaluation or funded-account setting, a profitable-looking chart setup can still be a poor account decision.
Drawdown changes position sizing
Start with the account’s current risk room, not the maximum position the platform allows. If the account uses a daily loss limit, maximum loss limit, or trailing drawdown, confirm how open and closed equity affect those rules before trading.
Momentum trades can reverse quickly. A position that is too large can use a meaningful share of the available drawdown before you have time to reassess. Size from the invalidation point and current account room, then round down.
Consistency changes trade selection
Trying to force a large day can lead to chasing, adding after extension, or taking a third and fourth version of the same failed breakout. Those decisions may create uneven results even when the original setup was reasonable.
A cleaner approach sets:
- Risk per trade
- Maximum attempts on one idea
- Maximum daily loss
- A rule for reducing size after a loss
- A stop-trading condition after an execution mistake
The goal is not to avoid every losing day. It is to keep one emotional sequence from controlling the account.
Simulated results need realistic expectations
When an evaluation or funded-account result is simulated, treat it as simulated. A backtest also applies rules to historical data. Neither form of result removes execution risk or proves future performance.
Treat the strategy as a process you must follow under pressure. Track whether you entered at the planned location, honored the stop, avoided prohibited times, and stopped when the daily rule required it. A positive result produced by broken rules is not clean evidence.
Use a momentum chase-distance test
A market can have strong momentum and still offer a bad entry. The test is not whether price is moving fast. It is whether the trade still has enough room after the move you already missed.
Recalculate three distances from the current price:
- Distance to invalidation. Keep the stop at the structure that proves the setup wrong. Do not pull it closer just to make a late entry look affordable.
- Distance to the next obstacle. Use the target or the nearest area where the move could reasonably stall, such as a prior extreme or major higher-timeframe level.
- Entry drift. Measure how far the current price has moved from the planned entry and compare it with the setup's normal adverse movement and volatility.
Then convert the current trade into risk units:
Available payoff in R = remaining distance to the obstacle ÷ current distance to invalidation
Suppose the planned entry offered 12 points to the next obstacle with a 4-point structural stop, or 3R before costs. Price runs 5 points without filling you. From the new entry, the same invalidation is now 9 points away and only 7 points remain to the obstacle. The trade has changed to about 0.78R before spread, commission, or slippage. The momentum improved while the entry deteriorated.
Current reading | What changed | Practical response |
|---|---|---|
Risk and remaining room still fit the tested plan | Entry drift is small | The setup may remain valid at recalculated size |
Structure still looks strong, but available R is below the plan | Most of the useful move may already be spent | Wait for a new base or pullback instead of chasing |
The only way to make size fit is to tighten the stop inside normal noise | The account budget and chart structure no longer agree | Use a smaller related contract if allowed or skip the trade |
The next obstacle has already been reached | The original trade path is complete | Require a completely new setup |
Set the minimum acceptable R and maximum entry drift from testing, not from one convenient example. The chase-distance test does not predict a reversal. It tells you when a valid momentum read no longer produces a valid trade.
Common momentum trading mistakes
Chasing extension
The trader sees a fast move, fears missing it, and enters far from the planned level. The stop then becomes too wide, too arbitrary, or both. Define the maximum entry distance before the move begins.
Treating an indicator as the trade
An RSI or MACD signal without price location, regime, and invalidation is incomplete. Indicators can confirm a decision, but they do not decide how much to risk.
Trading momentum in a range
Moving-average and oscillator signals can flip repeatedly when price has no sustained direction. Add a regime filter that distinguishes trend, breakout, and range conditions.
Moving the stop
Widening a stop after entry increases risk when the original evidence is weaker. If the market reaches invalidation, exit according to the plan and review the setup later.
Re-entering without a new setup
A stopped breakout does not make the next tick a fresh signal. Require price to rebuild the setup. Limit the number of attempts on the same idea.
Ignoring costs and fills
High turnover magnifies commissions, exchange fees, spread, and slippage. A strategy with a small average trade can look positive before costs and negative after them.
Using a winning streak as proof
A few favorable trades can occur by chance or during one unusually clean regime. Judge the strategy over enough varied observations to expose losses, ranges, news shocks, and changing volatility.
How to test a momentum strategy
Testing should try to disprove the rule, not protect it.
- Write the complete entry, invalidation, size, exit, and no-trade rules.
- Use data from the same contract, session, and timeframe you plan to trade.
- Include commissions, fees, bid-offer spread, and conservative slippage.
- For multi-contract futures history, document how the data handles contract rolls.
- Separate development data from out-of-sample data.
- Test trending, ranging, high-volatility, and quiet periods.
- Forward-test in simulation without changing rules after every loss.
- Record execution errors separately from valid strategy losses.
- Review expectancy, average win, average loss, drawdown, losing streaks, trade frequency, and rule adherence.
The CFTC’s advisory on hypothetical trading systems explains why simulated results can differ from actual trading. Historical fills may not reflect spreads, market impact, stop execution, consecutive-loss pressure, or the decisions a trader makes with real risk.
Avoid optimizing many parameters until the historical chart looks perfect. A rule that depends on one exact moving-average length, one exact minute, and one narrow volatility band may be fitting noise. Prefer a simple idea that remains understandable when reasonable parameters change.
Do momentum trading strategies work
Momentum has research support, but the answer depends on what “momentum” and “work” mean.
A 2012 Journal of Financial Economics study on time-series momentum found positive return persistence over one-to-12-month horizons across 58 liquid futures and forward instruments in its sample. That is evidence for a specific diversified, longer-horizon design.
The evidence is not unanimous. A 2020 Journal of Financial Economics paper reported weak asset-by-asset time-series predictability and questioned whether the strategy’s performance required the claimed predictive effect.
Neither paper validates a particular intraday breakout, RSI setting, or prop-account plan. A practical momentum strategy works only if its exact rules show a positive result after realistic costs and the trader can execute those rules within the account’s risk constraints. Even then, future results remain uncertain.
Build one momentum playbook
Choose one strategy family. Write the full rule sheet. Mark valid and invalid examples. Test it with realistic costs. Then forward-test without changing the plan every time the market produces a loss.
The setup does not need more excitement. It needs a clear trigger, a clear point of failure, and risk small enough that you can follow the next signal without trying to win back the last one.
Futures trading is complex and risky. No momentum strategy, indicator, backtest, evaluation result, or simulated result guarantees future performance.
.svg)
.svg)
.svg)
.svg)







.webp)