.svg)

.svg)
.svg)




TL;DR: Indices trading means taking a position on the movement of a market benchmark instead of a single company. You cannot buy an index itself, so traders use products such as futures, ETFs, CFDs, or options. For futures traders, contract specifications turn index points into real dollar risk: Micro E-mini S&P 500 futures use a $5 multiplier and a 0.25-point tick worth $1.25, while Micro E-mini Nasdaq-100 futures use a $2 multiplier and a 0.25-point tick worth $0.50. Choose the benchmark and contract size before the setup, calculate risk from the stop distance, and keep that risk inside both your trade plan and any evaluation or funded-account drawdown rules.
Indices trading table of contents
- What indices trading means
- How stock indices are built
- Ways to trade an index
- Major index futures for U.S. traders
- What moves index prices
- Run a three-layer index participation check
- How index futures work
- Index trading hours and liquidity
- How to size an index futures trade
- A practical indices trading process
- Common indices trading mistakes
- Indices trading questions
You see a clean breakout in the Nasdaq-100, click into a position, and then realize the contract is moving dollars faster than your plan can absorb. The problem was not the chart. It was treating “the index” as if it were one simple product.
Indices trading can make broad market exposure easier to read, but the instrument still decides your actual risk. A benchmark has constituents and a weighting method. A futures contract adds a multiplier, tick size, expiration, margin, and trading session. A prop-firm account adds another layer: the trade must fit inside account rules even if the setup looks valid.
This guide connects those layers so you can move from a market idea to a position size without guessing.
What indices trading means
An index is a calculated benchmark that tracks a defined group of securities. It may represent a broad market, a country, a company-size segment, or a sector. The S&P 500, Nasdaq-100, Russell 2000, and Dow Jones Industrial Average all measure different baskets and use different construction rules.
The index itself is not a share you can buy. It is a number produced from its methodology. To take a long or short position on that number, you need a tradable product linked to it, such as a futures contract, ETF, CFD, or option.
That distinction matters. Two products can reference the same benchmark but have different:
- trading hours;
- contract or share size;
- margin requirements;
- fees and financing costs;
- expiration and settlement rules;
- tax and regulatory treatment.
When a trader says, “I trade the S&P,” the next question should be, “With which product?”
How stock indices are built
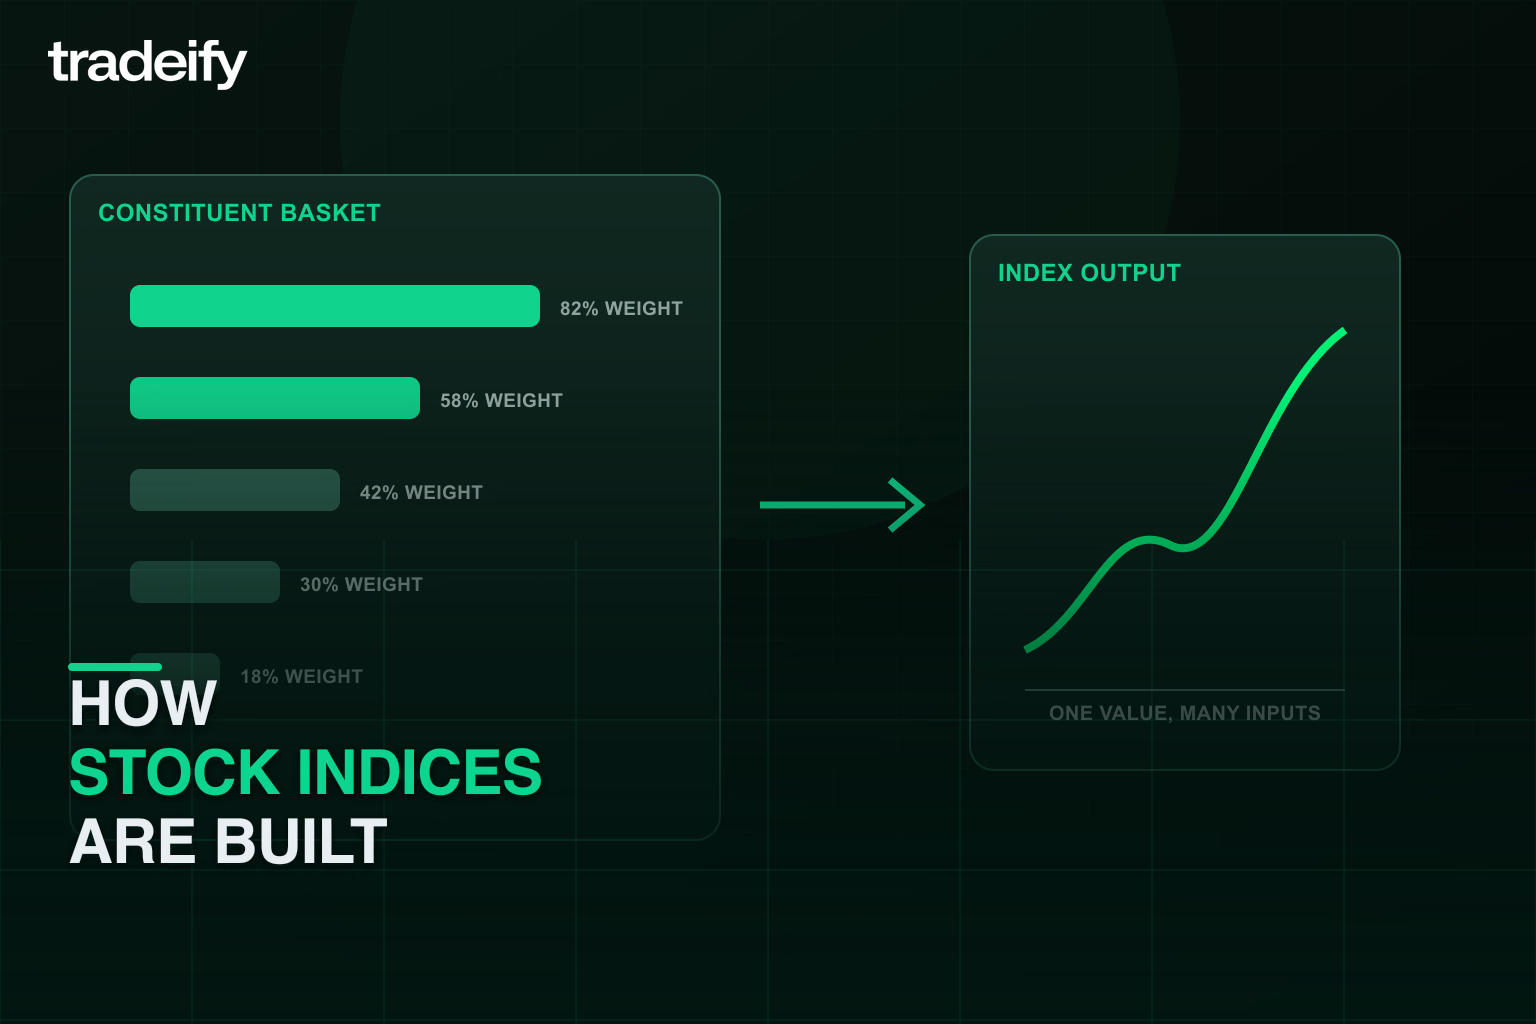
An index methodology defines which securities qualify, how they are weighted, how the index is calculated, and when its composition is reviewed. S&P Dow Jones Indices describes the methodology as the blueprint that determines an index’s characteristics.
Index weighting changes market behavior
The weighting method decides how much influence each constituent has.
- Market-cap weighted: Larger companies have more influence. Many broad equity indices use a float-adjusted version that excludes closely held shares not readily available for public trading.
- Price weighted: Higher-priced shares have more influence, regardless of the company’s total market value. The Dow Jones Industrial Average is a well-known example.
- Equal weighted: Every constituent receives the same weight at each rebalance.
- Fundamental or factor weighted: Weights depend on selected financial measures or characteristics.
This is not trivia. If a few large stocks carry heavy weights, their earnings, guidance, or sharp price moves can pull the index even when many other constituents are flat. A broad basket reduces single-company exposure, but it does not guarantee balanced influence.
Before trading a benchmark, read the index provider’s methodology explanation. Know what the index represents, what it excludes, and which constituents can move it most.
Ways to trade an index
You need a product that references the benchmark. The right product depends on your objective, holding period, jurisdiction, account type, and risk limits.
Product | What you trade | Typical use | Key tradeoff |
|---|---|---|---|
Futures | A standardized exchange-traded contract | Intraday trading, hedging, or directional exposure | Leverage, expiration, and mark-to-market require strict risk control |
ETF | Shares of a fund designed to track a benchmark | Investing or trading during the fund’s exchange session | Tracking error, fees, and stock-market hours |
CFD | An over-the-counter contract with a provider | Directional speculation where legally available | Provider terms, financing, regulation, and availability vary by jurisdiction |
Options | The right, but not the obligation, to buy or sell at defined terms | Defined-risk views, hedging, or volatility trades | Time decay and option pricing add complexity |
For a futures-focused prop trader, exchange-traded index futures are usually the relevant route. They provide standardized contract terms and allow both long and short positions. That does not make them low risk. The contract multiplier can turn a modest index move into a large account swing.
Major index futures for U.S. traders
CME Group lists E-mini and smaller Micro E-mini contracts tied to major U.S. equity benchmarks. Micro contracts use one-tenth the multiplier of their corresponding E-mini contracts, which gives traders a finer position-sizing tool.
Benchmark | E-mini | Micro E-mini | What it represents | E-mini contract value | Micro contract value |
|---|---|---|---|---|---|
S&P 500 | ES | MES | Large U.S. companies across major sectors | $50 per index point; 0.25-point tick equals $12.50 | $5 per index point; 0.25-point tick equals $1.25 |
Nasdaq-100 | NQ | MNQ | Large non-financial companies listed on Nasdaq | $20 per index point; 0.25-point tick equals $5.00 | $2 per index point; 0.25-point tick equals $0.50 |
Russell 2000 | RTY | M2K | Smaller U.S. companies | $50 per index point; 0.10-point tick equals $5.00 | $5 per index point; 0.10-point tick equals $0.50 |
Dow Jones Industrial Average | YM | MYM | 30 price-weighted U.S. blue-chip companies | $5 per index point; 1-point tick equals $5.00 | $0.50 per index point; 1-point tick equals $0.50 |
Do not choose by ticker popularity. Choose the market whose behavior you have studied and the contract whose dollar movement fits your risk budget. If the E-mini size forces you to risk too much, the Micro contract may allow a cleaner stop and more precise scaling.
Contract terms can change, so verify the current CME Group Micro E-mini specifications before trading.
What moves index prices
An equity index moves as its constituents move, but the cause is often broader than one company.
Macro drivers of index prices
Inflation reports, employment data, central-bank decisions, and growth indicators can change expectations for interest rates and corporate earnings. Index futures may reprice quickly when new information differs from what the market expected.
The release itself is only part of the risk. Liquidity can thin, spreads can widen, and stop orders can fill away from the trigger price in a fast market. If your plan does not define whether you trade through scheduled news, stepping aside is a valid risk decision.
Earnings and index concentration
A heavily weighted company can affect a market-cap-weighted index more than a small constituent. Earnings from several large companies in the same sector can create index-level movement even when the rest of the basket is quiet.
Check both the economic calendar and the earnings calendar. A position that looks like a broad market trade may still carry concentrated event risk.
Index breadth and sector rotation
An index can rise while many of its components fall if its largest constituents are strong enough. Market breadth, sector performance, and the behavior of related benchmarks can help you judge whether the move is broad or concentrated.
Breadth is context, not a trade signal by itself. Use it to test the story behind the move, then let your setup and invalidation decide the trade.
Index sessions and liquidity
The same chart can behave differently during the overnight session, the U.S. cash open, midday, and the closing period. Participation, volume, and the mix of market orders change through the day.
Build statistics for the session you actually trade. A setup tested around the cash open should not be assumed to behave the same way overnight.
Run a three-layer index participation check
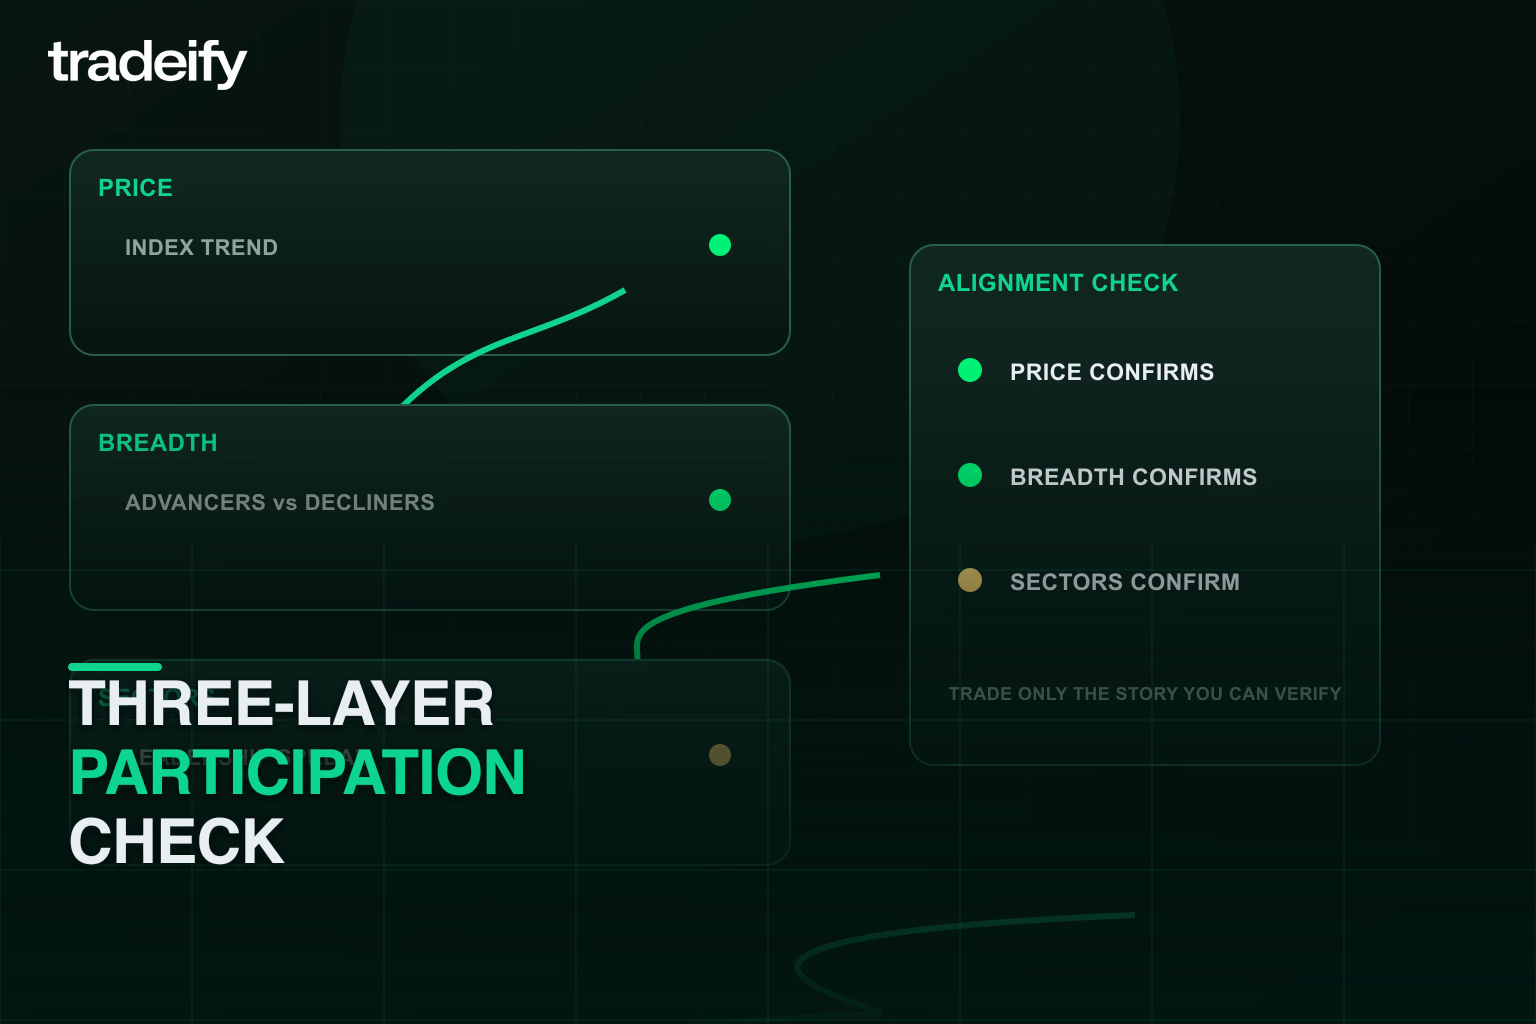
An index futures chart shows the result of the basket. It does not show how many stocks created that result. Before treating an index move as broad market conviction, check participation at three layers.
Layer | What to inspect | Question it answers |
|---|---|---|
Index price | Structure, range expansion, acceptance beyond a level, and the session being traded | Is the futures contract actually trending, breaking out, or rotating? |
Constituent participation | Advancing versus declining stocks, new highs versus new lows, or the share of components above a chosen reference | Are many stocks moving with the index, or is the headline move narrow? |
Weight and sector contribution | Largest constituents, leading sectors, and related index futures | Is one concentrated group carrying the move while the rest of the market disagrees? |
The three layers create useful combinations:
- Broad agreement: Price accepts beyond the level, participation expands, and several sectors or related benchmarks confirm. That does not guarantee continuation, but the move is not resting on one narrow source.
- Narrow leadership: The index advances while participation weakens and a few heavyweights do most of the work. The setup may still be valid, but a trader can demand cleaner price confirmation, reduce size, or avoid adding late.
- Cross-index conflict: One benchmark breaks out while related index futures remain inside their ranges. The difference may reflect index composition rather than a market-wide change.
- Participation improvement before price: Breadth or sector performance strengthens while the index remains trapped. Treat that as context to watch, not permission to enter before the price trigger.
Use the same measurements each session. Switching from one breadth statistic to another after the trade makes the explanation impossible to test. Record the three-layer reading at entry and again at exit, then compare it with follow-through over a meaningful sample.
This check is most useful when it changes a specific choice: take the setup, wait for confirmation, reduce size, or skip it. If the information never changes a decision, it is more screen clutter than edge.
How index futures work
Futures are standardized contracts traded on an exchange and cleared through a clearing house. The exchange defines the contract size, tick, listed months, last trading day, and settlement process.
Futures multiplier and notional value
The multiplier converts index points into dollars:
Notional value = futures price × contract multiplier
If MES trades at 6,000, one contract represents $30,000 of notional index exposure:
6,000 × $5 = $30,000
You do not pay the full notional value to open a futures position. You post margin. The CFTC describes futures margin as a performance bond, not a stock-style down payment. Positions are marked to market, so gains and losses change the account balance as the market moves.
Margin tells you what is required to carry the position. It does not tell you what the trade can lose. The National Futures Association’s investor best practices explain why futures traders should understand leverage, volatility, and the amount of risk capital they can afford to lose.
Futures ticks and dollar movement
The minimum price movement is the tick. For MES, a 0.25-point tick is worth $1.25. Four ticks equal one point, or $5 per contract. For MNQ, a 0.25-point tick is worth $0.50, so one full point equals $2 per contract.
Always translate the chart distance into dollars before entry:
Dollar risk = stop distance in points × point value × contracts
Futures expiration, rollover, and settlement
Equity-index futures expire. The main U.S. contracts follow a quarterly cycle, and active trading typically moves from the expiring contract to a later month before expiration.
That shift is called rollover. If you trade the wrong month, volume may be thinner and chart levels may not line up with the contract most participants are using. Check the symbol, expiration month, volume, and your platform’s continuous-contract settings.
Micro E-mini equity-index futures are cash settled. You are trading the contract’s price movement, not taking delivery of a basket of shares.
Index trading hours and liquidity
Major U.S. equity-index futures trade on CME Globex for nearly 23 hours on trading days, from Sunday evening through Friday, with a daily maintenance break. Holiday schedules can change the normal session.
Long hours do not mean equal liquidity. Many traders focus on the U.S. cash session because underlying stocks, ETFs, options, and institutional flows are active together. Overnight trading can still be liquid, but conditions may be thinner and more sensitive to global news.
Use three checks before trading outside your normal window:
- Confirm the contract is open and review the exchange’s holiday schedule.
- Check current spread, volume, and order-book conditions.
- Reduce size or stand aside if the stop required by the structure does not fit your risk budget.
How to size an index futures trade
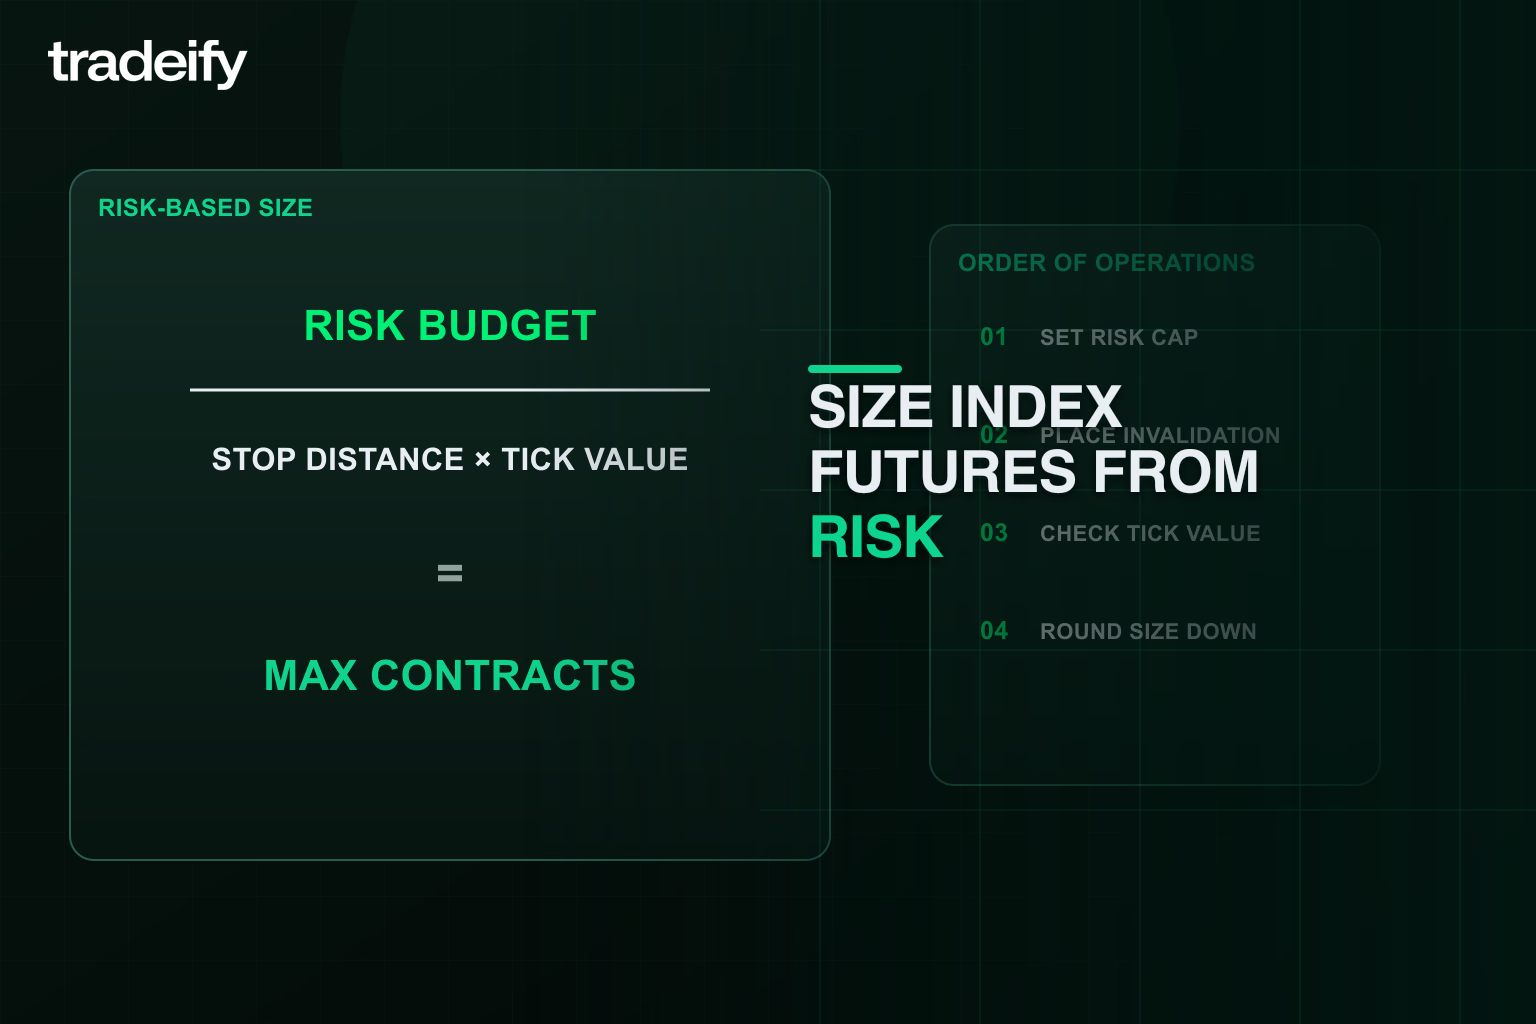
Position sizing starts with the invalidation point, not the maximum number of contracts your account permits.
Use this sequence:
- Define the price level that proves the setup wrong.
- Measure the stop distance in index points.
- Multiply that distance by the contract’s point value.
- Add a cushion for commissions and possible slippage.
- Divide the trade-risk budget by the risk per contract.
- Round down to a whole contract.
Suppose an MNQ setup needs a 20-point stop. MNQ is worth $2 per point, so the planned market risk is $40 per contract:
20 points × $2 = $40
If the trade-risk budget is $120, three contracts would use the full budget before commissions or slippage. Rounding down to two contracts leaves room for execution costs and a worse-than-planned fill.
Size index futures from the tighter constraint
In an evaluation or funded-account setting, your personal trade budget is not the only limit. Remaining daily-loss and drawdown room matter too.
Use the smaller of:
- your normal per-trade risk budget; or
- the amount of account-rule room you are willing to expose before your stop.
If the setup requires a wider stop than that amount can support at one Micro contract, skip the trade. Moving the stop closer only to make the size fit changes the setup. Increasing size because you are behind a target changes the risk.
A practical indices trading process
Choose one index benchmark and session
Learn how a single index responds during a specific window before adding more markets. Track average range, volume, spread, economic releases, and your own execution quality.
Write the index setup before the order
Your plan should state:
- the market and contract month;
- the session you trade;
- the setup conditions;
- the entry trigger;
- the price level that invalidates the trade;
- the maximum dollar risk;
- scheduled events that block new entries;
- the rule for stopping after losses or execution errors.
Check the futures contract and calendar
Before the session, confirm the active contract, rollover status, holiday hours, economic releases, and major constituent earnings. This takes less time than recovering from a trade placed in the wrong contract or into an event you forgot.
Execute the index risk you planned
Enter only after the trigger appears. Place the protective order according to the plan. Do not widen the stop because the market is “almost” turning, and do not add contracts simply because the first entry is losing.
Review index trading behavior
Journal the setup, session, planned risk, actual fill, maximum adverse movement, and whether you followed the rule. A green trade with broken rules is not clean execution. A controlled loss taken exactly as planned can still be useful data.
Common indices trading mistakes
Why an index basket is not automatically safe
An index spreads exposure across multiple companies, but that does not remove volatility, concentration, gap, or leverage risk. Diversification inside the benchmark is not the same as small account risk.
Why futures margin is not maximum loss
Margin is the amount required to support the position. Your loss depends on price movement, the multiplier, and contract count. A position can fit the available margin and still be too large for the plan.
When Micro index futures fit better
Bigger is not more professional. Use the contract size that lets the stop sit at a valid technical level while keeping the dollar risk acceptable.
Why index traders need the event calendar
Macro releases and major earnings can change volatility and execution quality quickly. Know the calendar and decide in advance whether you will trade, reduce size, or wait.
Why account pressure causes revenge trading
Drawdown pressure makes traders speed up when they should slow down. After a loss, recalculate the remaining rule room. Do not let a profit target or evaluation deadline turn the next setup into a rescue trade.
Indices trading questions
Is indices trading better than stock trading?
Neither is universally better. Indices reduce dependence on one company and can express a broad market view with one position. Stocks offer company-specific opportunities but carry earnings, management, and other single-name risks. Index futures add contract leverage, expiration, and near-continuous hours, so the better choice is the one whose risks and mechanics fit your plan.
Is indices trading suitable for beginners?
The benchmark concept is accessible, but futures mechanics are not optional. A beginner should understand multipliers, ticks, margin, order types, expiration, and loss limits before trading. Simulation can help you practice the process, but simulated results do not guarantee live performance.
Can you trade an index directly?
No. An index is a calculated benchmark. You take exposure through a linked product such as a futures contract, ETF, CFD, or option.
What does it mean to buy index futures?
Buying an index futures contract creates a long position whose value rises or falls with the contract price. You do not own the underlying shares. Your dollar gain or loss depends on the price change, contract multiplier, and number of contracts.
Can you sell index futures before expiration?
Yes. A trader normally exits a long futures position by selling an offsetting contract, or exits a short position by buying one. You do not need to hold the position until settlement. Confirm the active month and liquidity before entering or exiting.
Which index is best for day trading?
There is no universal best index. Compare liquidity during your session, typical volatility, contract point value, tick size, and how well the market fits your setup. The best choice is the one you can size and execute consistently without breaking your risk rules.
What should a futures trader check before entering?
Confirm the benchmark, contract symbol and month, point value, stop distance, total dollar risk, scheduled events, session conditions, and remaining account-rule room. If any one of those is unclear, the trade is not ready.
Indices trading gets simpler when you stop treating the index, the contract, and the account as the same thing. Read the benchmark, verify the contract, calculate the dollars, and protect the rule room first. The next setup will still be there.
.svg)
.svg)
.svg)
.svg)





.webp)