



TL;DR: Futures term structure compares prices for different delivery months of the same market at one point in time. An upward-sloping curve is commonly described as contango, while a downward-sloping curve is commonly described as backwardation. Storage, financing, dividends, supply conditions, and seasonality can shape the curve. VIX futures often slope upward in calmer periods and can invert during stress. It is not a guaranteed forecast of where the nearby contract will trade. A near-minus-far spread moving from -1.20 to -0.70 has strengthened by 0.50 whether both legs rose or fell. Use synchronized quotes, consistent contract specifications, and liquid expirations when comparing spreads. Spot versus futures is a different comparison from near versus far, and futures prices converge toward spot as a contract approaches expiry.
The nearby futures contract is trading at 75, while a later delivery month is at 77. That does not automatically mean the market expects the nearby contract to rise by two points.
Different expirations can carry different costs, supply pressures, and seasonal conditions. Futures term structure helps you examine those differences without confusing a curve across delivery months with a price chart through time.
For an intraday trader, the curve can provide context. For a trader researching calendar spreads or rolling exposure, understanding the curve is essential to interpreting the trade correctly.
What futures term structure shows
A term-structure chart places contract expirations along one axis and their prices along the other. Each point represents a different contract observed at the same time.
The Interactive Brokers term-structure definition describes this relationship across futures maturities. It is a cross-section, not the historical path of one contract.
A conventional price chart might show how the nearby contract changed from Monday to Friday. A term-structure chart shows how the nearby, next, and later expirations are priced now.
Keep that difference clear when comparing charts. A rising historical price and an upward-sloping futures curve describe different things and can occur independently.
Read contango and backwardation on the futures curve
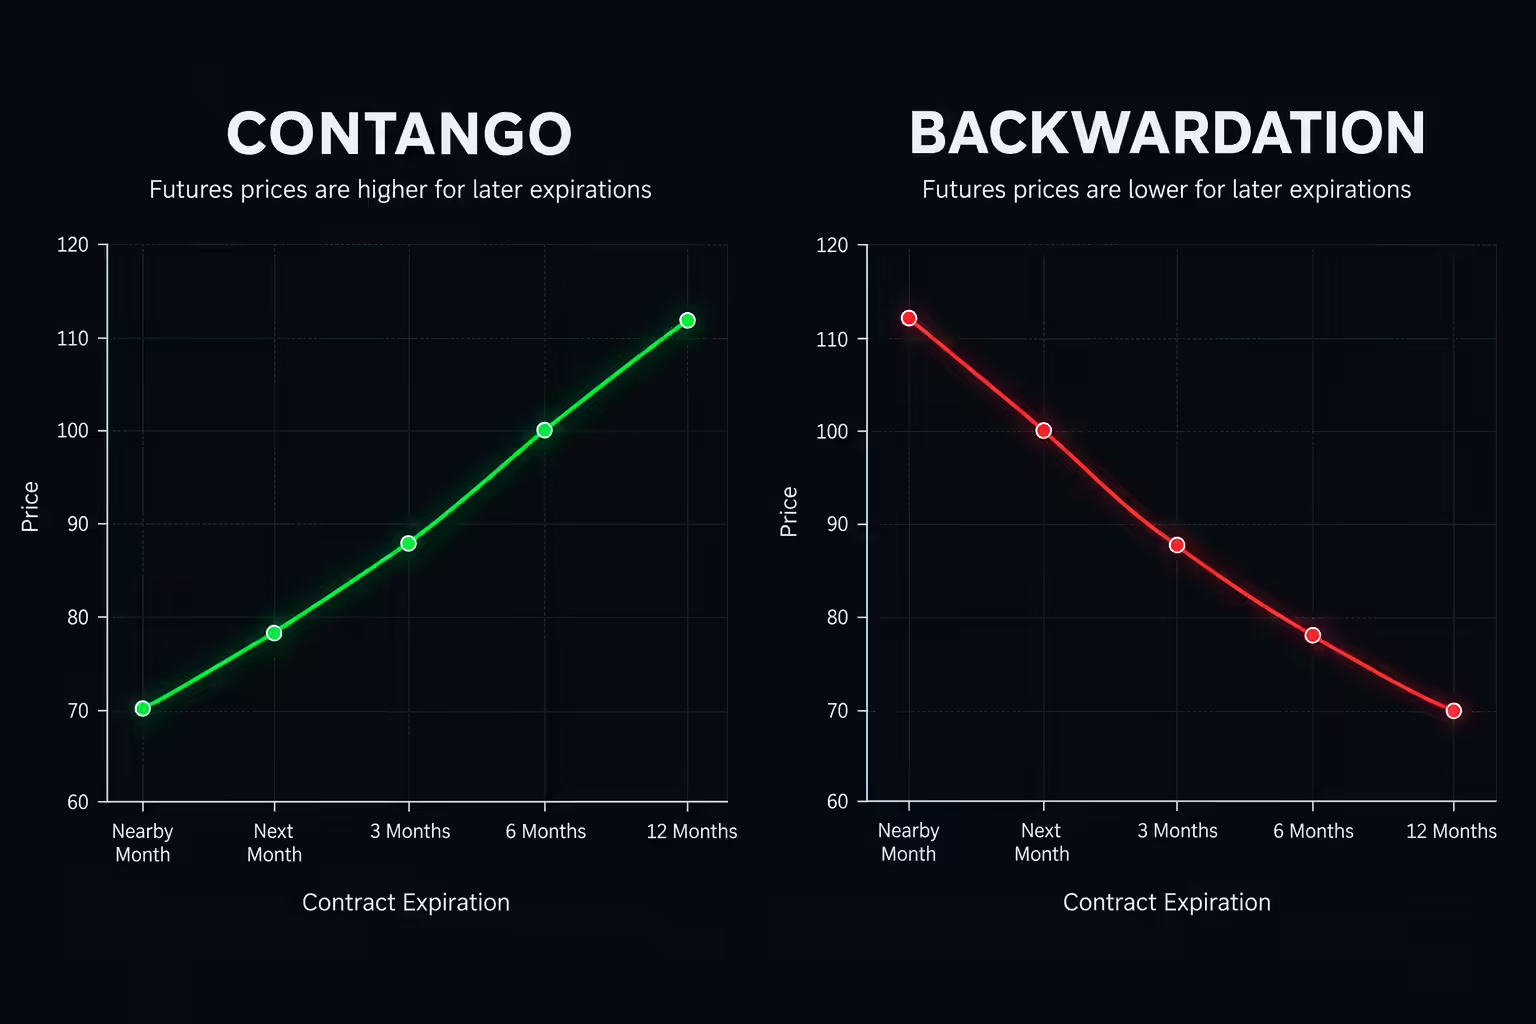
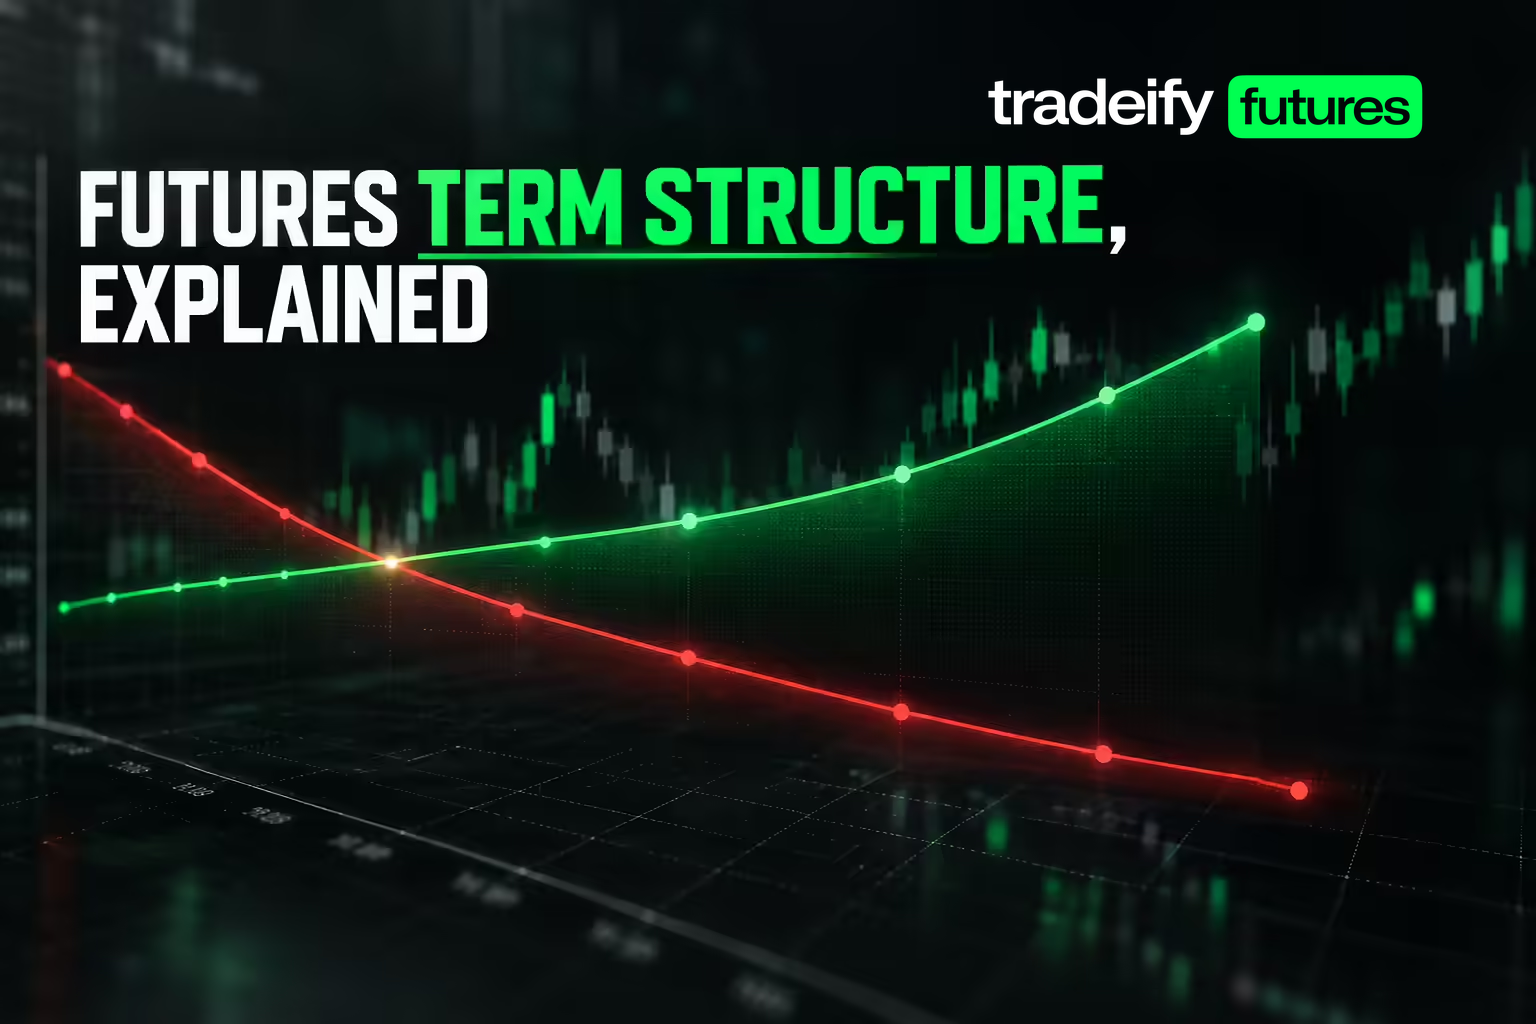
In a simple upward-sloping curve, later contracts cost more than earlier contracts. Traders commonly call that contango. In a downward-sloping curve, nearer contracts cost more than later ones, commonly called backwardation.
| Feature | Contango | Backwardation |
|---|---|---|
| Curve slope | Upward: later months priced above nearer months | Downward: nearer months priced above later months |
| Common drivers | Storage and financing costs, ample supply | Tight supply, high convenience yield, near-term demand |
| Near minus far spread | Negative | Positive |
| What it does not tell you | That prices will rise | That prices will fall |
These terms can also be used when comparing futures with spot prices. State which comparison you mean, especially when the curve is not uniformly sloped.
A spot price is the price for taking delivery now. A futures price is the price agreed for delivery at the contract’s expiration. The CME Group lesson on contango and backwardation defines both terms against spot rather than against another delivery month: a market is in contango when the forward price of a futures contract is higher than the spot price, and in backwardation when the forward price is lower than the spot price.
That spot comparison also explains what happens at the end of a contract’s life. As a futures contract approaches maturity, its price converges with the spot price. CME’s lesson is blunt about why: otherwise an arbitrage opportunity would exist. Deferred contracts can sit far from spot, but the expiring contract cannot, which is why the front of the curve behaves differently from the back.
Real curves can have humps and seasonal peaks. One section may slope upward while another slopes down. Labeling the entire curve with one word can hide the feature that matters to your trade.
CME Group’s discussion of energy calendar spreads connects curve shape with inventory, storage, and seasonal influences. Natural gas, for example, can have a seasonal structure that a single near-versus-far comparison does not fully capture.
Understand what shapes futures term structure
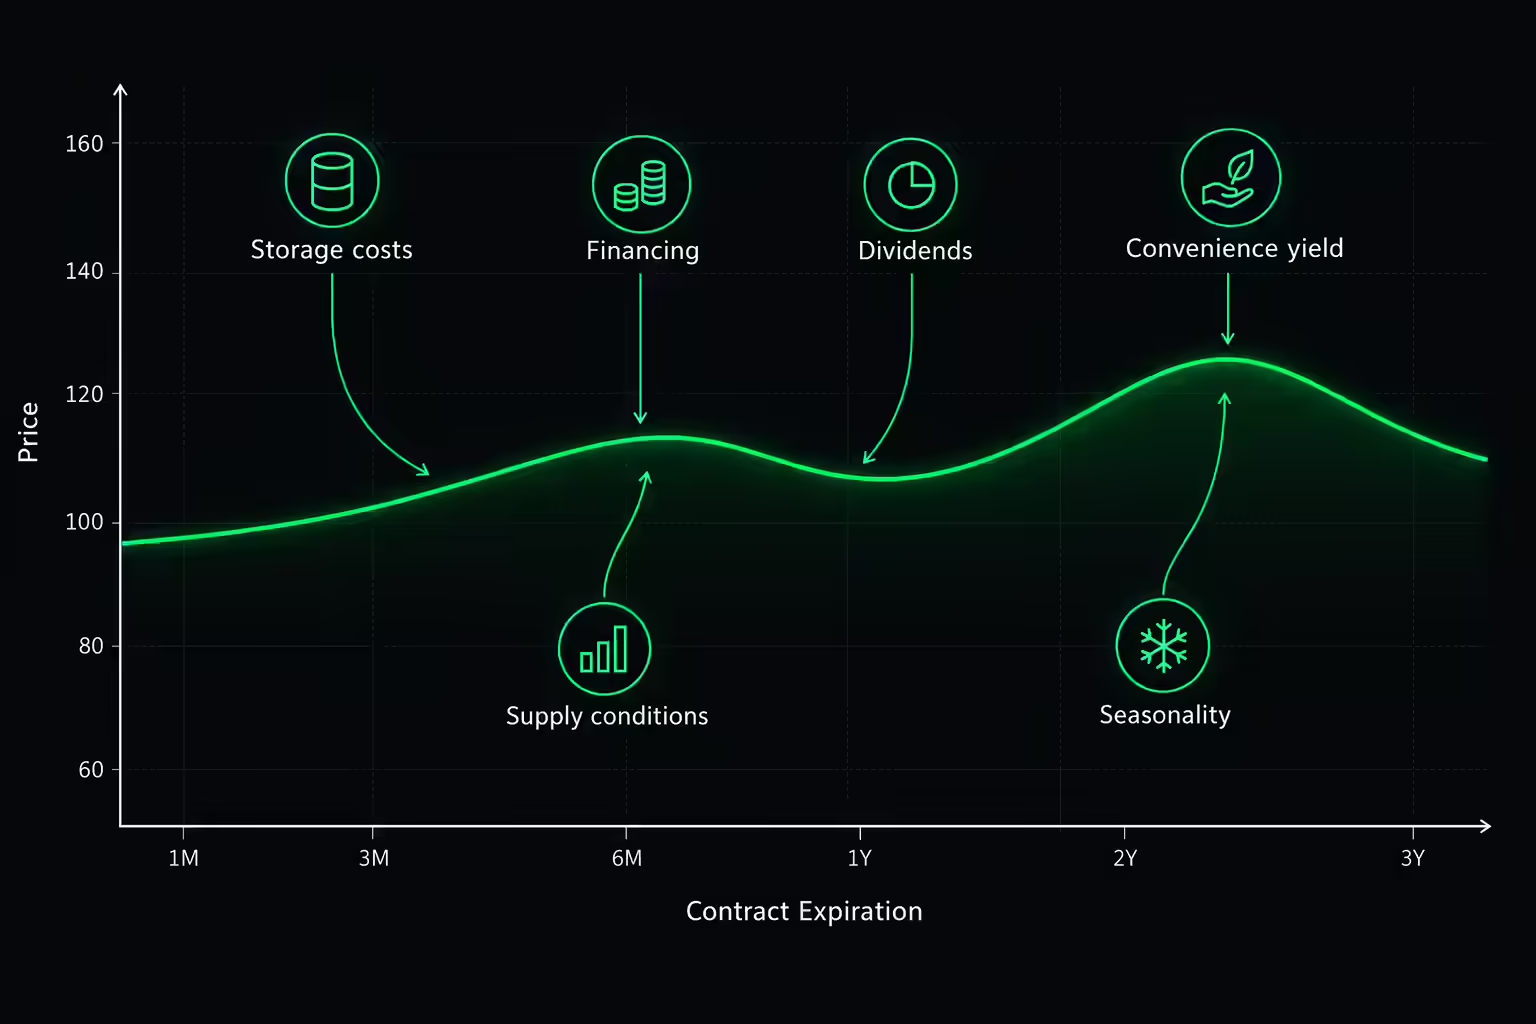
For storable commodities, financing and storage costs can affect deferred prices. The benefit of having physical inventory available, often called convenience yield, can work in the opposite direction. CME’s base metals lesson describes convenience yield as an implied return on warehouse inventory, and it is inversely related to inventory levels: when stocks are high the convenience yield is low, and when stocks are low the yield is high.
Supply disruptions can make immediate delivery more valuable relative to later delivery. Seasonal demand can make a particular month more expensive than the contracts around it.
Equity-index futures have different mechanics. Financing and expected dividends help explain the relationship between spot and futures prices. You should not apply an oil-inventory explanation directly to an equity-index curve.
The practical question is which economic mechanism is relevant to this product. Start there before assigning a bullish or bearish interpretation to the slope.
What the curve shape means for hedgers and speculators
Crude oil is where these terms earn their keep. Measuring the front-month contract against contracts six months further out, CME Group’s economic research found the crude oil market has spent roughly 42% of the time in contango and 58% in backwardation since 1985, with backwardation dominating from 1985 to 2008 and contango more common since. Neither shape is permanent, and the oil market has alternated between them for decades.
The 2026 supply disruption gave a live example. CME’s research group noted that WTI futures for December 2026 delivery traded as much as $40 below contracts for May and June delivery during the crunch, a steep backwardation that said the market priced the disruption as short-lived rather than expecting spot prices to stay at their crisis level.
How hedgers use the curve
A hedger - an airline covering future fuel costs, a producer selling future output - is trading the curve whether they intend to or not. The delivery month they choose sets the price they lock: in a backwardated curve, deferred months lock below the nearby price, and in contango they lock above it. CME’s energy calendar spread options whitepaper describes instruments that exist specifically for hedging shifts in the forward curve and spread volatility, because commercial firms need to manage the shape of the curve, not just its level.
For a consumer hedging a physical purchase, steep backwardation cuts both ways: deferred hedges lock prices below the current spot price, but the shape itself signals the market expects nearby prices to fall. The hedging decision is which of those risks to hold, not simply which month looks cheapest.
How speculators use the curve
A speculator who never intends to take delivery still pays the curve at every roll. CME’s research is direct about the mechanics: a positively sloped curve produces a negative roll yield for a rolled long position, while backwardation produces a positive roll yield. Rolling a long through contango means buying each successive contract at a premium to the one it exits, which drags on returns even when the outright direction is right.
The same research attaches the caveat that belongs next to any rule like this: there are plenty of examples of rising prices during contango and falling prices during backwardation. Curve shape is context for how you manage a position - roll timing, month selection, which spread you are actually trading - not a standalone signal to be long or short. If you trade micro crude oil contracts through a prop firm, the roll spread between expirations is a real line item in your math.
Read the VIX futures term structure
VIX futures apply the same curve idea to expected volatility rather than a storable commodity. Storage costs and convenience yield do not apply, so the slope reflects how the market prices near-term versus longer-term volatility.
During calmer periods, the VIX futures curve often sits in contango, with later months above the nearby contract. During sharp market stress, near-term volatility expectations can jump and the curve can invert into backwardation.
Treat that inversion as context about current risk pricing, not as a timing signal. The curve can stay inverted, flatten, or return to contango at a pace that does not match your trade plan.
Calculate a futures calendar spread
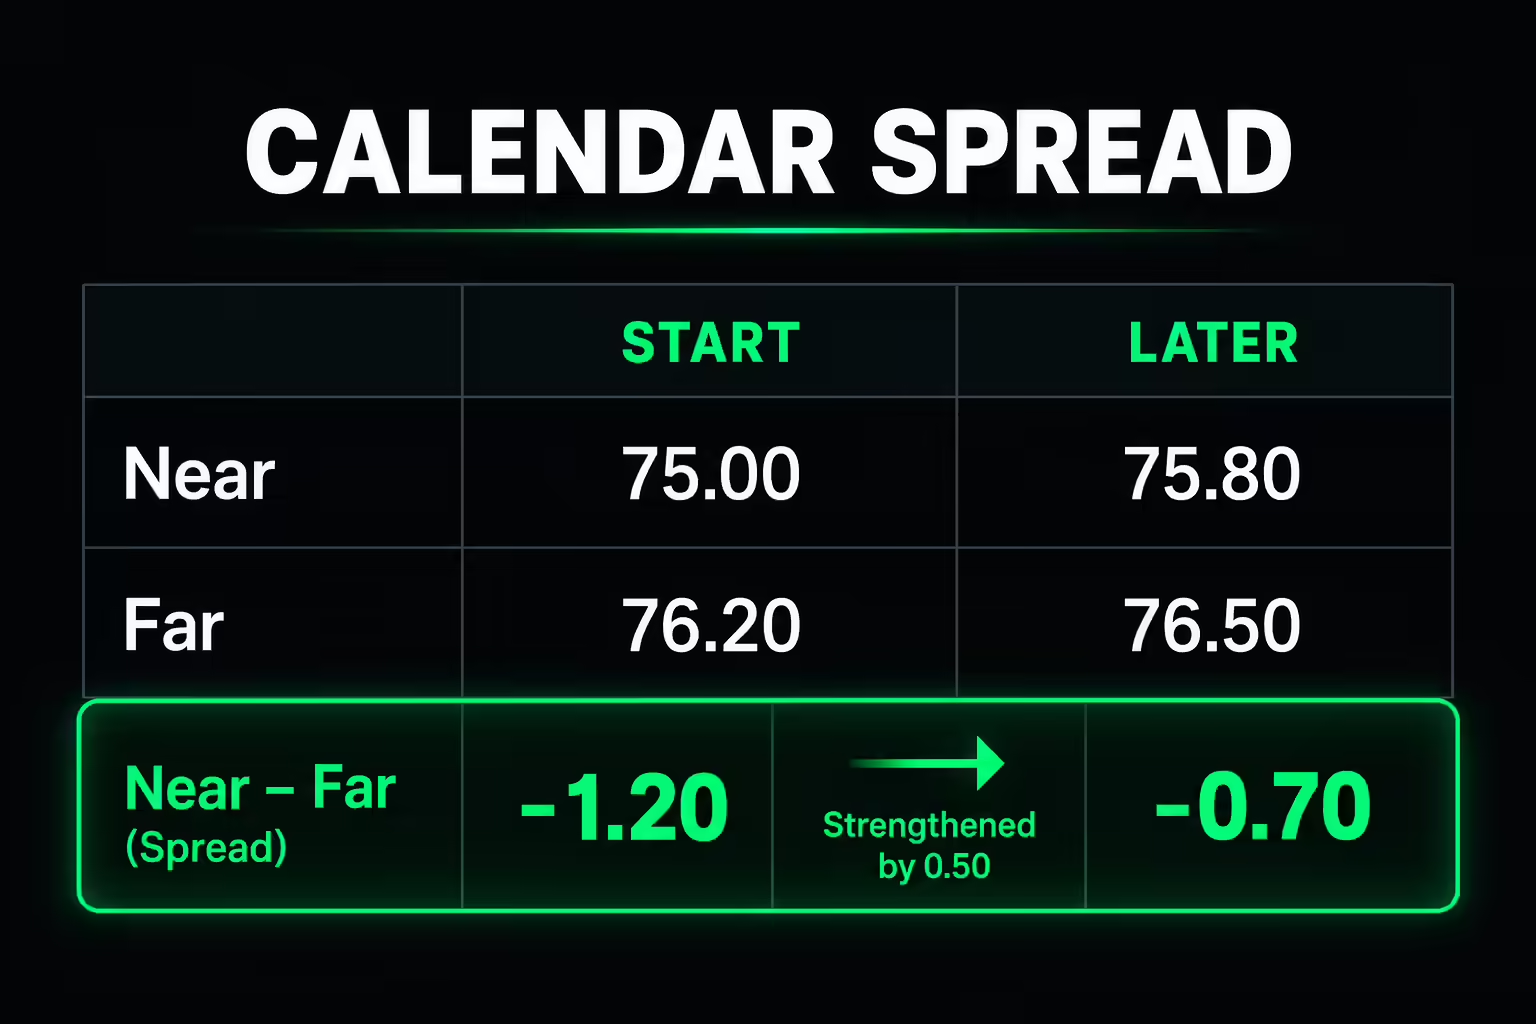
Define the order of subtraction before reading a spread chart. Near minus far and far minus near produce opposite signs for the same prices.
Suppose a hypothetical nearby contract trades at 75.00 and the next contract trades at 76.20. The near-minus-far spread is -1.20.
Later, the nearby rises to 75.80 and the next rises to 76.50. The spread is now -0.70. It strengthened by 0.50 even though both outright prices increased.
If the nearby instead fell to 74.80 while the next fell to 75.50, the spread would also be -0.70. A similar spread change can occur with a different outright direction.
That is why a calendar-spread position cannot be evaluated solely by whether the market rose or fell. The relative movement of both legs matters, along with their contract multipliers and trading costs.
Avoid treating the futures curve as a forecast
A deferred contract price is a tradable price for that maturity, influenced by the market’s pricing relationships. It is not a promise of the eventual spot price.
As time passes, supply, demand, financing, and expectations can all change. The curve may shift, flatten, steepen, or change shape.
Likewise, rolling from a lower-priced contract into a higher-priced one does not create an immediate cash loss equal to the price difference in the way a simple chart comparison might imply. Futures exposure, basis changes, convergence, and the strategy’s accounting need to be considered together.
Do not describe contango as automatic loss or backwardation as automatic profit. The realized result depends on the path and the position.
Check futures curve data quality
Use comparable prices. A settlement price for one expiration and a live last trade for another may produce an artificial slope.
Check whether thinly traded deferred contracts have stale quotes. A last price can look precise while reflecting activity from much earlier in the session.
For a repeatable review, record:
- The contract family and exact expirations.
- The observation time or settlement date.
- Whether prices are bid, ask, midpoint, last, or settlement.
- Volume and open interest where available.
- The spread’s subtraction convention.
Use actual contract prices for term-structure comparisons. A back-adjusted continuous series is designed for a different purpose and can obscure the relationship you are trying to measure.
Compare today’s curve with an earlier snapshot
Start with actual expirations and one consistent price convention. Interactive Brokers’ term-structure lesson demonstrates comparing the current curve with historical snapshots. The same analytical question applies on other platforms: did prices rise together, or did the relationship between delivery months change?
Suppose three hypothetical contracts are priced at 75, 76, and 77. A later snapshot of 77, 78, and 79 is a parallel two-point increase; the adjacent spreads are unchanged. A snapshot of 77, 77.50, and 78 is different: the nearby contract strengthened relative to the later months, flattening that part of the curve.
For a long-near, short-far spread with equal hypothetical multipliers of $1,000 per price point, a 0.50-point increase in near minus far produces $500 gross for one matched pair. Reverse the legs and the sign reverses. Costs, unequal specifications, and execution of each leg still matter; a spread is not risk-free because it has both a long and a short.
Apply futures term structure to your trading process
For an intraday outright strategy, the curve may explain context without changing the entry rules. A supply-driven curve shift does not establish where a five-minute reversal will happen.
For spread research, test both legs with realistic liquidity and costs. Correlated legs can still create substantial risk, particularly when one market becomes difficult to execute.
If you trade through a prop firm, confirm that the intended positions and products are permitted. Do not assume a spread used in institutional markets is allowed under a retail evaluation’s account rules.
Start by saving the same set of expirations at the same time each day. Describe whether the curve shifted overall or changed shape. That distinction will make your review more useful than labeling every upward slope bullish.
Frequently asked questions
What is futures term structure?
Futures term structure is the set of prices for different delivery months of the same market, observed at one point in time. Plotting those prices by expiration shows whether the curve slopes upward, slopes downward, or has humps. It is a cross-section across maturities, not a price chart through time.
What is the difference between contango and backwardation?
In contango, later contracts are priced above nearer contracts, so the curve slopes upward. In backwardation, nearer contracts are priced above later ones, so the curve slopes downward. Real curves can mix both shapes across different sections.
Does contango mean futures prices will rise?
No. A deferred contract price is a tradable price for that maturity, not a forecast of the eventual spot price. Supply, demand, financing, and expectations can all change before expiration, so the curve can shift or change shape.
How do you calculate a futures calendar spread?
Choose a subtraction order first, such as near minus far. With a nearby contract at 75.00 and the next contract at 76.20, the near-minus-far spread is -1.20. If the spread moves to -0.70, it has strengthened by 0.50 regardless of whether both outright prices rose or fell.
What does the VIX futures term structure show?
The VIX futures curve compares expected volatility priced for different expiration months. It often slopes upward in calmer periods and can invert into backwardation during market stress. The shape describes current risk pricing and is not a reliable timing signal on its own.
Are oil prices in backwardation or contango?
It shifts over time. Measuring the front-month contract against contracts six months further out, CME Group’s economic research found crude oil spent roughly 42% of the time in contango and 58% in backwardation from 1985 onward, and during the 2026 supply disruption the WTI curve traded in steep backwardation. Neither state is permanent, so check a current curve snapshot rather than assuming either one.
Why is it called contango?
The word dates to nineteenth-century England, where a contango was a fee a buyer paid a seller on the London Stock Exchange to postpone settling an agreed trade. It is believed to be a corruption of continuation or continue, and it now names the market condition in which futures prices sit above the current spot price.
What is the difference between spot price and futures price?
The spot price is the price for taking delivery of the asset now, while a futures price is the price agreed for delivery at the contract’s expiration. As expiration approaches, the futures price converges with the spot price. If the two did not converge, an arbitrage opportunity would exist.