
TL;DR Successful prop firm trading requires mastering intraday futures volatility. Data confirms a liquidity sequence: Gold (08:20 ET) → Oil (09:00 ET) → Equities (09:30 ET). Traders must avoid the "Dead Zone" (11:30-13:30 ET) where intraday futures volatility drops 40%, increasing false breakout risks. Prop candidates should favor the S&P 500 (ES) over the Nasdaq-100 (NQ), as NQ exhibits 7x the volatility range, endangering drawdown limits.
Key Takeaways on Intraday Futures Volatility
- Timing Protects Drawdown: Understanding intraday futures volatility allows prop traders to avoid low-liquidity periods that cause "chop" and unnecessary losses. Trading the wrong asset at the wrong time (e.g., NQ during the midday lull) statistically increases failure rates.
- The Liquidity Sequence: Intraday futures volatility arrives in waves: Gold (GC) at 8:20 AM ET, Crude Oil (CL) at 9:00 AM ET, followed by the Equity Indices (ES/NQ) at 9:30 AM ET.
- Asset Selection: The Nasdaq-100 (NQ) has an extreme intraday futures volatility profile compared to the S&P 500 (ES). NQ requires distinct risk management strategies for evaluation accounts.
- The Dead Zone: Volume and intraday futures volatility drop significant between 11:30 AM and 1:30 PM ET, a high-risk zone for trend-following strategies due to a 60% probability of false breakouts.
Introduction to Intraday Futures Volatility Cycles
"Market timing" is a survival skill for passing prop firm evaluations. If you trade during the wrong intraday futures volatility cycle, you increase the probability of hitting your daily loss limit.
Global markets do not move linearly. They have distinct "heartbeats" pulsing with liquidity. This report analyzes 13 years of data to map intraday futures volatility for the Nasdaq-100 (NQ), S&P 500 (ES), Crude Oil (CL), and Gold (GC), helping Tradeify candidates align their execution with institutional flow.
Methodology for Quantifying Intraday Futures Volatility
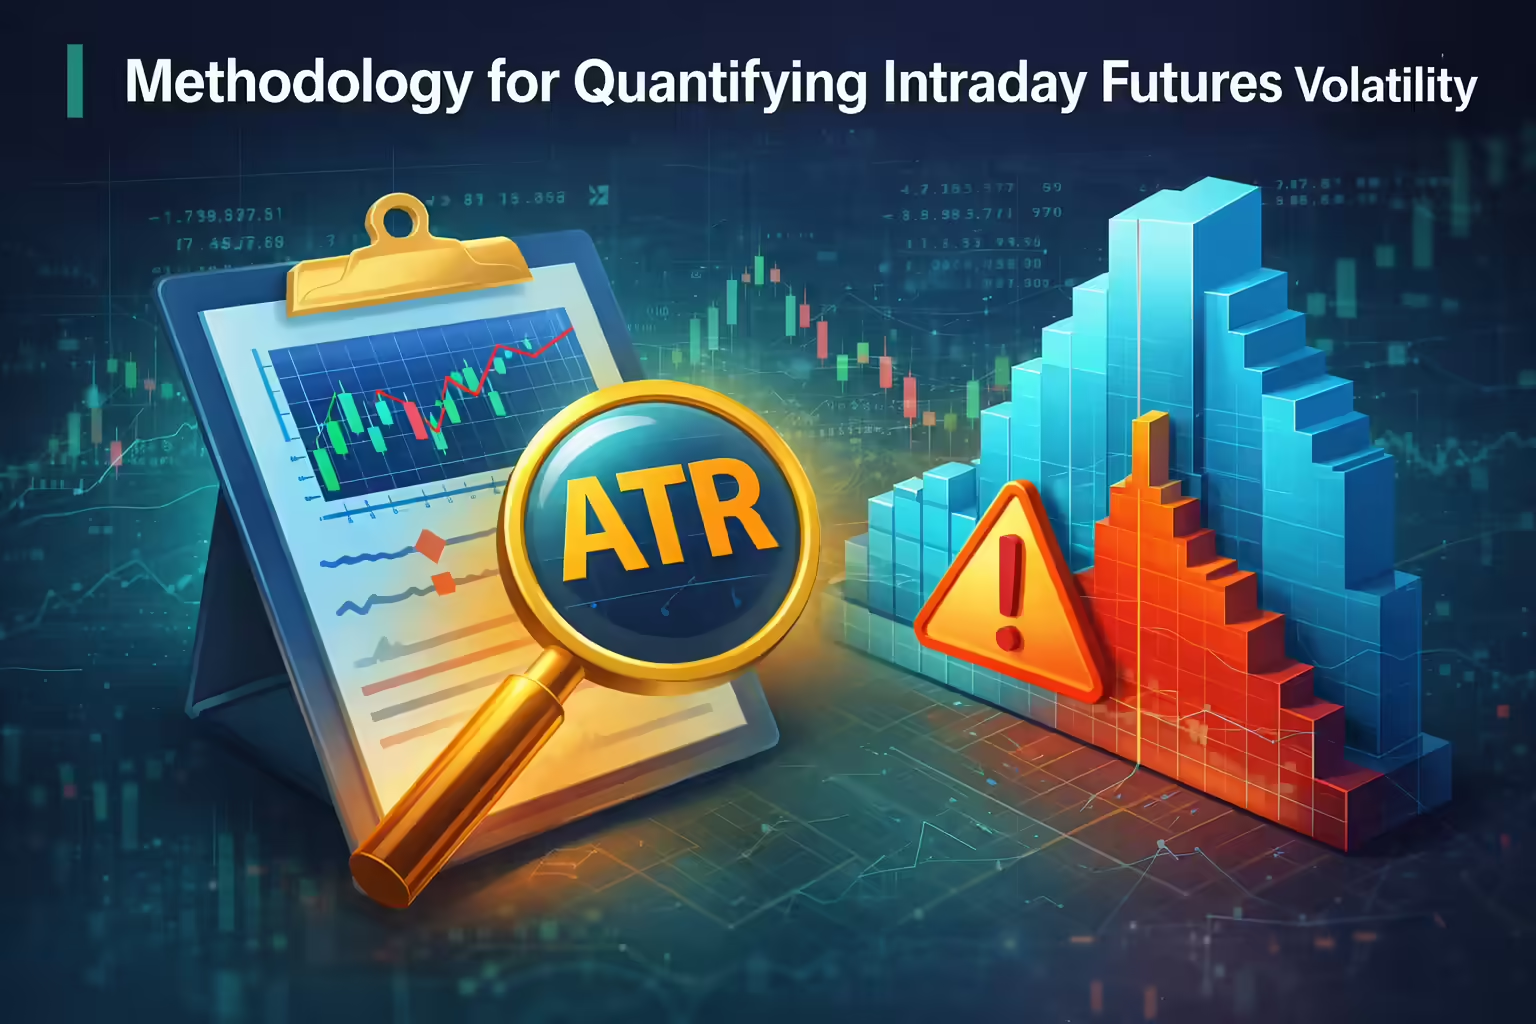
To establish authority, we define how intraday futures volatility is measured in the context of risk management and opportunity cost.
Average True Range (ATR) and Volatility
Standard deviation measures dispersion, but for the prop trader, the ATR is the best metric for intraday futures volatility. It measures the "tradable space" of a contract, helping you calculate stop-loss width relative to your account size. We analyze hourly ATR to determine expected ranges.
Volume Profile Analysis
Volatility without volume is dangerous. It leads to slippage. We cross-reference intraday futures volatility spikes with Volume Profiles to distinguish between "healthy volatility" (trend potential) and "thin volatility" (stop runs) often found in the Dead Zone.
The Baton Pass: Morning Intraday Futures Volatility Sequence
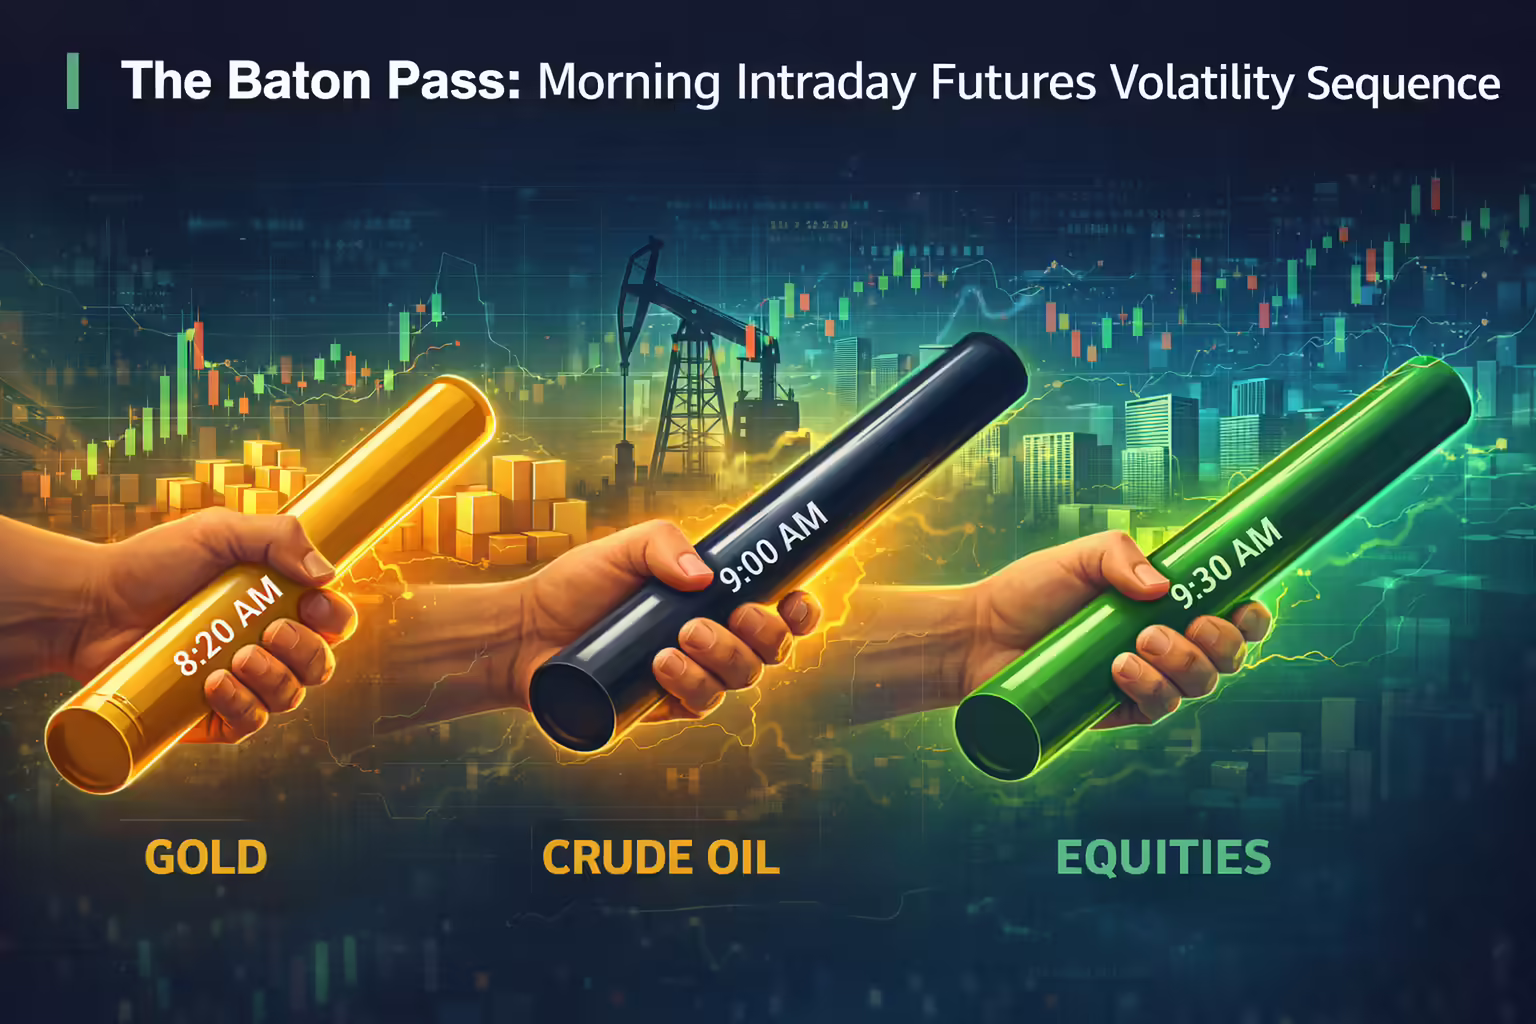
Liquidity arrives in a sequence. Understanding this "Baton Pass" of intraday futures volatility helps traders rotate their focus to the most active asset.
Gold (GC): Early Intraday Futures Volatility at 8:20 AM ET
The session begins with the COMEX open. A spike in intraday futures volatility here often acts as a leading indicator for broader market sentiment. Strategic Insight: The 8:20 AM to 9:00 AM window offers a "clean" look at risk sentiment without equity noise.
Crude Oil (CL): Energy Sector Volatility at 9:00 AM ET
As Gold stabilizes, Crude Oil intraday futures volatility ignites at the NYMEX open. This is the ideal time to shift focus from metals to energy.
Warning: Be aware of WTI Inventories on Wednesdays at 10:30 AM ET, a massive volatility event.
Equity Indices: Peak Intraday Futures Volatility at 9:30 AM ET
The NYSE open triggers the highest intraday futures volatility of the day. For prop traders, this "Amateur Hour" (9:30-10:00 AM) is dangerous due to erratic whipsaws. A volatility spillover often occurs here; if equities gap down, expect instant reaction in Gold and Oil.
Intraday Futures Volatility Profiles: NQ vs. ES
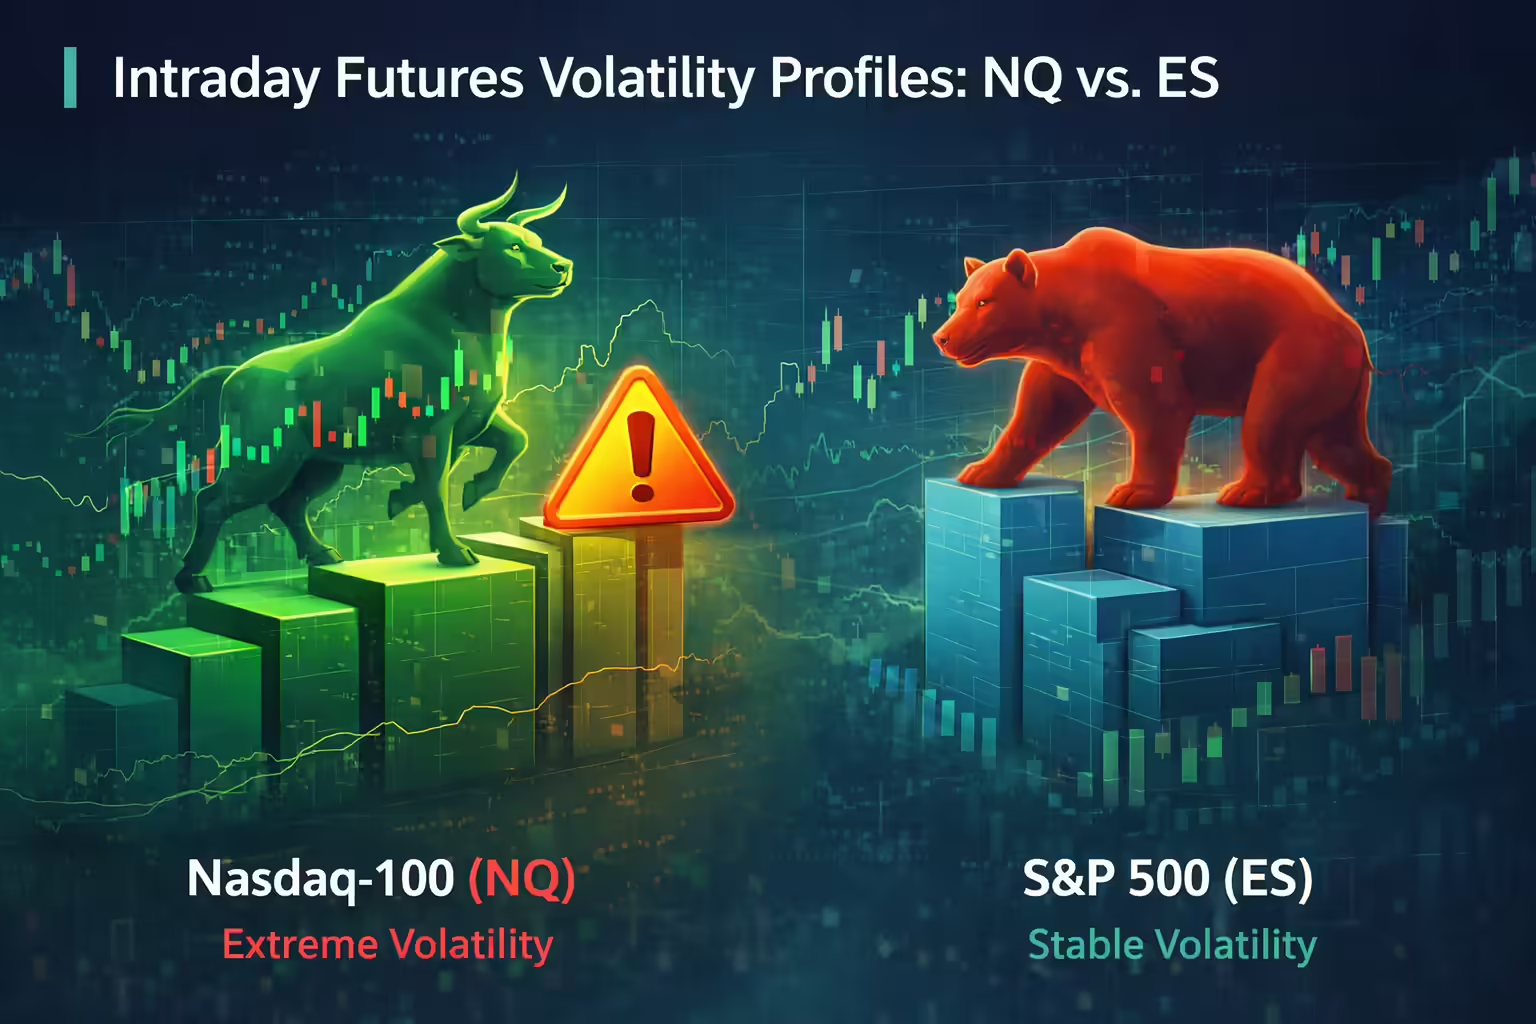
Choosing between NQ and ES is a choice between two distinct intraday futures volatility profiles, directly impacting your evaluation's trailing drawdown.
The Drawdown Danger Zone
- Nasdaq-100 (NQ): Extreme intraday futures volatility. Data shows it moves ~7x the point range of ES. A standard move can trigger a $500+ swing in seconds, endangering daily loss limits.
- S&P 500 (ES): Stable intraday futures volatility. "Thicker" liquidity makes it safer for holding trades without violating risk rules.
Comparison of Intraday Futures Volatility Ranges
| Asset | Symbol | Tick Value | Avg Daily Range (Points) | Avg Daily Range ($ Value) | Volatility Profile |
|---|---|---|---|---|---|
| Nasdaq-100 | NQ | $5.00 | ~250 - 350 | $5,000 - $7,000 | Extreme / Whipsaw |
| S&P 500 | ES | $12.50 | ~40 - 60 | $2,000 - $3,000 | High / Stable |
| Crude Oil | CL | $10.00 | ~1.50 - 2.50 | $1,500 - $2,500 | High / Event-Driven |
| Gold | GC | $10.00 | ~20 - 30 | $2,000 - $3,000 | Moderate / Trending |
Strategic Recommendation: If you are struggling with drawdown management, switch to ES. The NQ's $5,000+ daily range requires reduced contract sizing to survive its aggressive intraday futures volatility.
The Dead Zone in Intraday Futures Volatility
Over-trading during low intraday futures volatility is a primary cause of failure. The period between 11:30 AM and 1:30 PM ET is known as the "Dead Zone."
The Drop in Intraday Futures Volatility
- Volume Drop: Intraday futures volatility and volume drop 30-40% as institutional desks break for lunch.
- Prop Firm Risk: Breakouts fail frequently here (False Breakouts > 60%). Trading this zone statistically increases the chance of "death by a thousand cuts" (small accumulated losses).
- The Rule: Protect your morning gains. Flatten positions or reduce risk significantly during this window.
The Power Hour and Closing Intraday Futures Volatility
As the low-volume midday session concludes around 2:00 PM ET, institutional desks return. Intraday futures volatility spikes into the close (3:00 PM - 4:00 PM ET) as Mutual funds execute "market-on-close" (MOC) orders. Interestingly, volatility in the opening hour (9:30) often predicts the intensity of this closing hour.
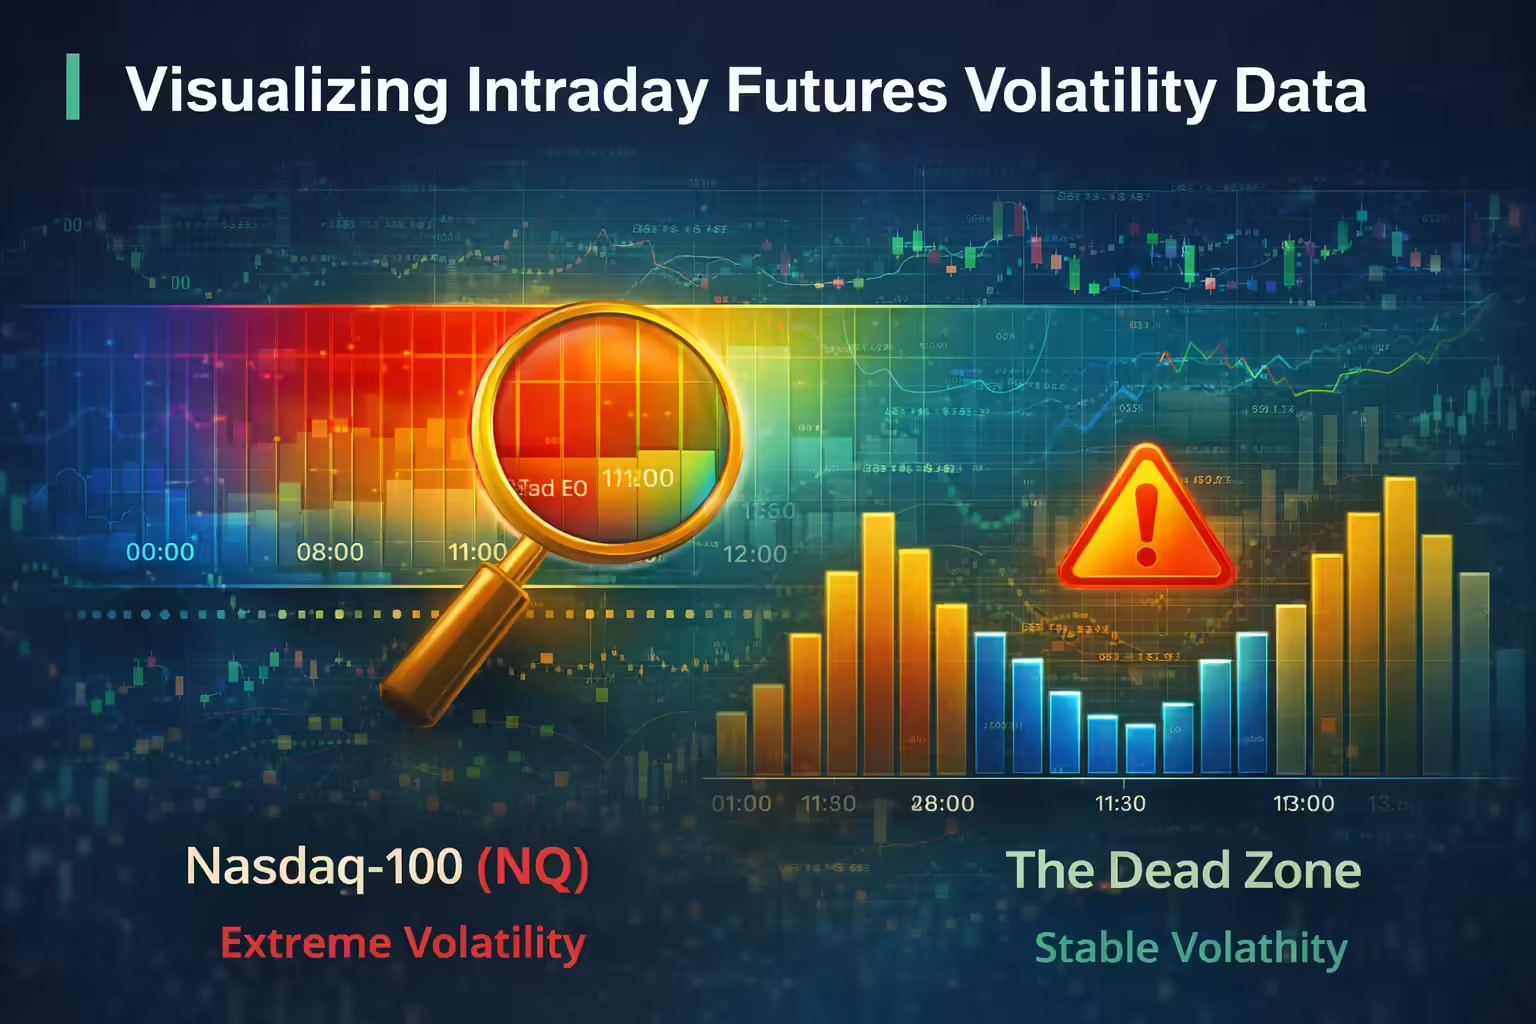
Visualizing Intraday Futures Volatility Data
(Note for Designer: Create the following to accompany this report)
The Heat Map for Intraday Volatility
- Visual: A color-coded timeline (00:00 – 24:00 EST).
- Data: Highlight the overlap of GC, CL, and ES opens (08:20-11:00 AM) in Red (High Volatility) vs the Lunch Lull in Blue (Low Volatility).
The Dead Zone Bar Chart
- Visual: Vertical bars representing hourly volume showing a "U-shape" valley midday.
- Insight: Visually proves the drop in intraday futures volatility that leads to false breakouts.
Applying Intraday Futures Volatility to Prop Strategies
To pass your Tradeify evaluation, use this intraday futures volatility analysis to create strict rules:
Avoid the Dead Zone: Stop trading when intraday futures volatility drops at 11:30 AM ET.
Size for Volatility: If trading NQ, reduce size to account for its higher intraday futures volatility ($ value per range).
Respect the Sequence: Don't force NQ trades at 8:30 AM; liquidity is in Gold. Rotate your watch list.
Wait for the Setup: Let the initial 9:30 AM intraday futures volatility settle (Amateur Hour) before entering trend positions.
Final Thoughts on Intraday Futures Volatility Analysis
By respecting the natural cycles of intraday futures volatility, you transform market movement from a risk into an edge. Use this data to protect your capital and pass your evaluation.
.svg)
.svg)
.svg)

.webp)

