




TL;DR: The abandoned baby candlestick pattern is a three-candle reversal where a doji is cut off by price gaps on both sides. The trade decision is whether the gaps are real on your chart and whether the stop under the doji fits your risk budget. Bulkowski's tests show 69% to 70% reversal rates, but only 293 bullish cases in 4.7 million candles, from perfect trades. Confirm it with location, volume and a close beyond the pattern, and size from the stop, not the name.
The abandoned baby candlestick pattern shows up on a chart less often than almost any other named candle setup, which is exactly why traders tend to overrate it when they finally see one. A clean formation looks decisive. The harder questions are whether it actually meets the definition, where the trade is wrong, and whether the stop it demands fits your account.
This guide covers the anatomy of the pattern, both directions, how it differs from the star patterns it gets confused with, what the published tests do and do not say, and an illustrative Micro E-mini S&P 500 example priced through three entries that share one stop and one target.
What Is the Abandoned Baby Candlestick Pattern
The abandoned baby candlestick pattern is a three-candle reversal signal built around a doji (a candle whose open and close are nearly the same price) that is separated from the candles on both sides by price gaps. The doji is "abandoned" because no trade on the neighboring candles touches its range.
It comes in two versions:
- Bullish abandoned baby. It forms after a decline. A down candle is followed by a doji that gaps below it, then an up candle that gaps back above the doji.
- Bearish abandoned baby. It forms after a rise. An up candle is followed by a doji that gaps above it, then a down candle that gaps back below the doji.
The name comes from traditional usage among Japanese rice traders, and Investopedia credits Steve Nison with first publishing it in the popular press in 1991. The shape is close to the bar-chart island reversal, where a cluster of bars is left stranded by a gap on each side. The abandoned baby is the same idea compressed into a single candle.
That compression is the whole point. One session where price went nowhere, isolated by two gaps, records a trend that stalled and a market that then left in the opposite direction. Whether it keeps going is a separate question the pattern cannot answer.
Anatomy of an Abandoned Baby Candle by Candle
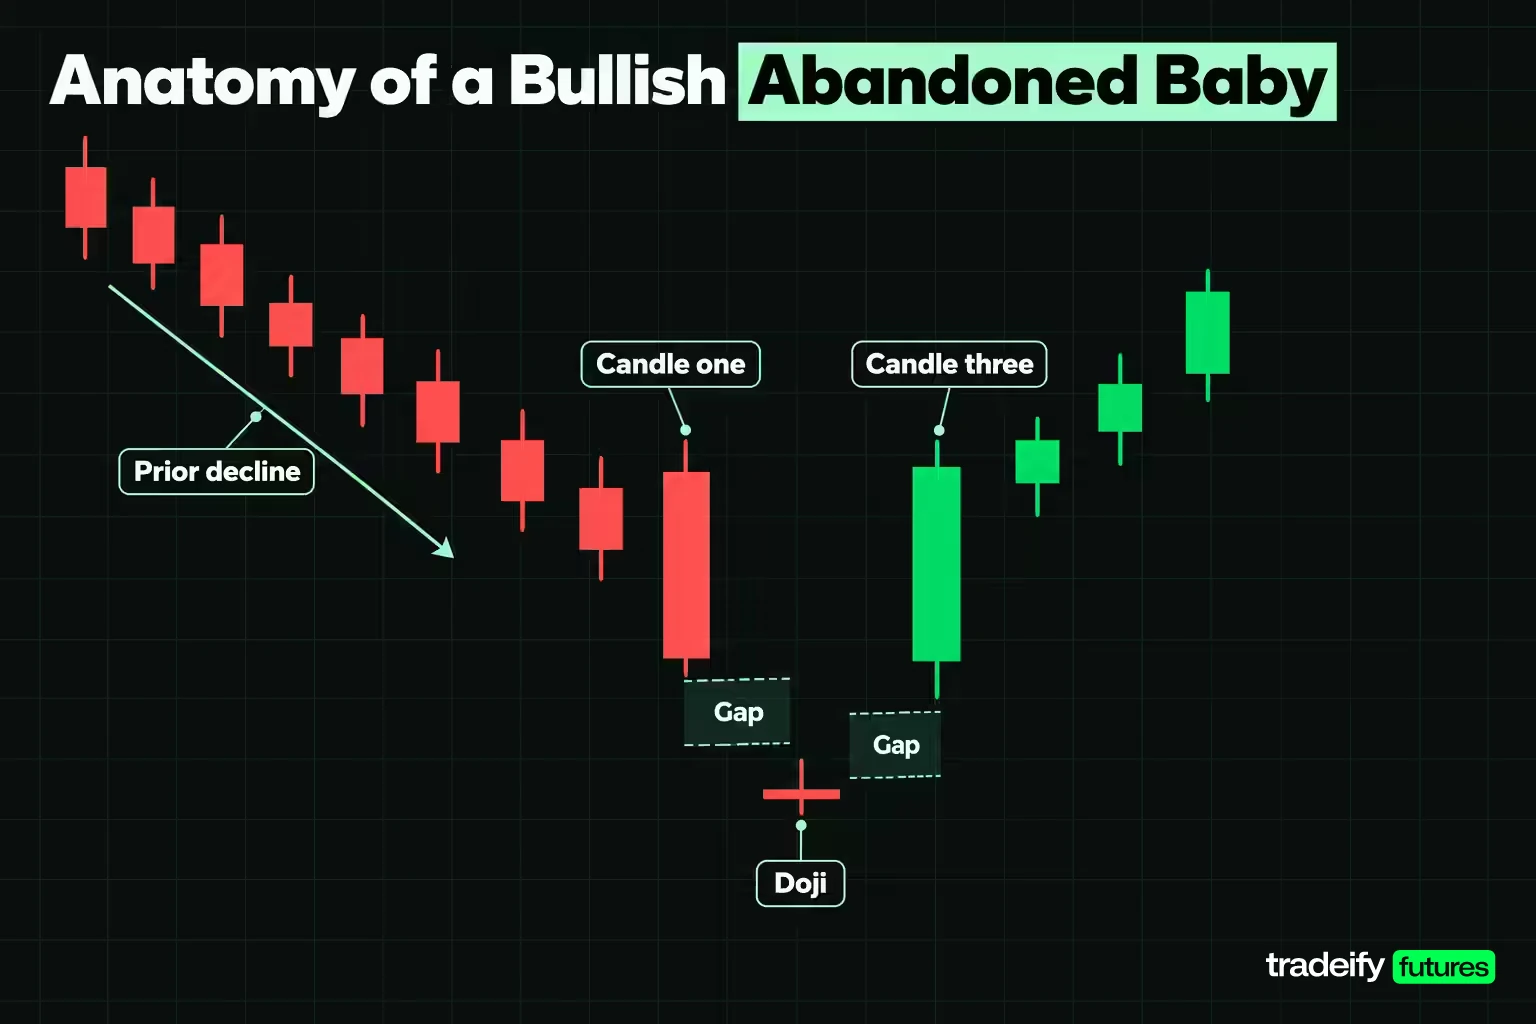
An abandoned baby is easiest to judge when you break it into four parts and test each one separately, rather than recognizing the overall shape.
- The prior trend. The pattern has to interrupt something. A bullish abandoned baby needs a decline into it, and a bearish one needs a rise. Without a trend there is nothing to reverse.
- Candle one. A candle in the direction of the trend, showing the side in control is still pushing. Sources differ on its size. Thomas Bulkowski's guidelines say the first candle can be "of any shape", while scanner definitions such as the thinkorswim pattern library require a long candle, meaning its body is larger than the average body over a set lookback.
- The doji. The middle candle opens and closes at almost the same price, and its whole range sits beyond candle one's range, with a gap between them.
- Candle three. A candle in the opposite direction that gaps away from the doji, so the doji ends up isolated on both sides.
The thinkorswim definition makes the arithmetic plain. It exposes two inputs: "length", the number of candles used to calculate the average body height, and "trend setup", the number of preceding candles checked for a trend. If a scanner needs those two numbers, so does your own definition.
Strict and Loose Abandoned Baby Gap Rules
The word "gap" means different things in different abandoned baby definitions, and the version you pick changes how often you will find the pattern.
- Shadow gap (strict). Bulkowski's bullish guideline asks for a doji that gaps below the shadows of both adjacent candles, and a third candle whose lower shadow stays above the top of the doji. Nothing on either neighbor trades inside the doji's range.
- No overlap of bodies or shadows. TradingSim states the rule as no overlap between bars one and two, or between bars two and three, which amounts to the same strict test.
- Body gap (loose). Some charting conventions only require the doji's body to gap away from the neighboring bodies. That is the morning doji star or evening doji star definition, not the abandoned baby, even though the shapes look alike.
Pick one rule, write it down, and apply it to every chart. If you switch to the looser rule only when a setup looks attractive, your sample is no longer measuring one pattern.
Market Psychology Behind the Abandoned Baby
The abandoned baby is worth reading as a record of who held control in each session, not as a forecast.
Take the bullish version. Candle one is sellers in full control, closing near the low. The next session opens below that low, which is the moment sellers look strongest: price has gapped away from the prior day's entire range. Then nothing happens. The doji closes almost where it opened, so the session that should have extended the decline delivers no follow-through. Sellers had the gap and could not do anything with it.
Candle three is the shift. It opens above the doji's high, which means anyone who sold during the doji session is immediately underwater, and it closes higher. Buyers are not just defending a level here. They are forcing late sellers to cover.
Investopedia lists the common drivers for the bearish version as profit-taking after a long rise, bearish news, technical resistance and a lack of buying support. The bullish version mirrors those. None of them is visible on the chart itself, which is why the pattern describes a shift in control without explaining it.
The practical reading follows from the psychology. If the reversal story is true, price should not trade back through the doji. A move back below the doji's low on a bullish abandoned baby says the buyers who took over in candle three did not hold, and that is where the idea is wrong.
The Bullish Abandoned Baby
The bullish abandoned baby is a bottom reversal signal that forms at the end of a decline. Bulkowski's testing found it acting as a bullish reversal 70% of the time, and he notes these patterns tend to form at the end of short downtrends and perform best when the candles are tall.
What each candle needs to show:
- A down candle that continues the decline and closes near its low.
- A doji whose entire range sits below that candle's low.
- An up candle whose low stays above the doji's high and that closes strongly, ideally above the midpoint of candle one's body.
Checking an Illustrative Bullish Abandoned Baby
Here is a constructed formation on daily Micro E-mini S&P 500 (MES) bars. MES is $5 per index point with a minimum tick of 0.25 index points, worth $1.25. Every price below is a round illustrative level, not market data.
Price has made five lower closes from an illustrative swing high at 7,720.00, and the illustrative 20-session average range is 40.00 points.
- Candle one opens 7,660.00, highs at 7,664.00, lows at 7,610.00 and closes 7,614.00.
- The doji opens 7,596.00, highs at 7,602.00, lows at 7,588.00 and closes 7,596.50.
- Candle three opens 7,612.00, highs at 7,652.00, lows at 7,609.00 and closes 7,648.00.
| Check | Rule used | Measured value |
|---|---|---|
| Prior trend | Decline into the pattern | Five lower closes from 7,720.00 |
| Candle one | Long down candle | Body 46.00 points, 85.19% of its range; range 1.35 times the average |
| Doji body | Body tiny against its own range | Body 0.50 points, 3.57% of a 14.00-point range |
| Gap above the doji | Candle one's low above the doji's high | 8.00 points clear (7,610.00 vs 7,602.00) |
| Gap below candle three | Candle three's low above the doji's high | 7.00 points clear (7,609.00 vs 7,602.00) |
| Candle three close | Strong close, past candle one's midpoint | Closes 90.70% up its range, above the 7,637.00 midpoint |
Every check passes, so this counts as an abandoned baby under the strict shadow-gap rule. Candles one and three overlap each other, and that is fine. The isolation rule applies to the doji.
The pattern's low is the doji's low at 7,588.00 and its high is candle one's high at 7,664.00, a height of 76.00 points. Those two levels drive the stop and the target in the trading section.
The Bearish Abandoned Baby
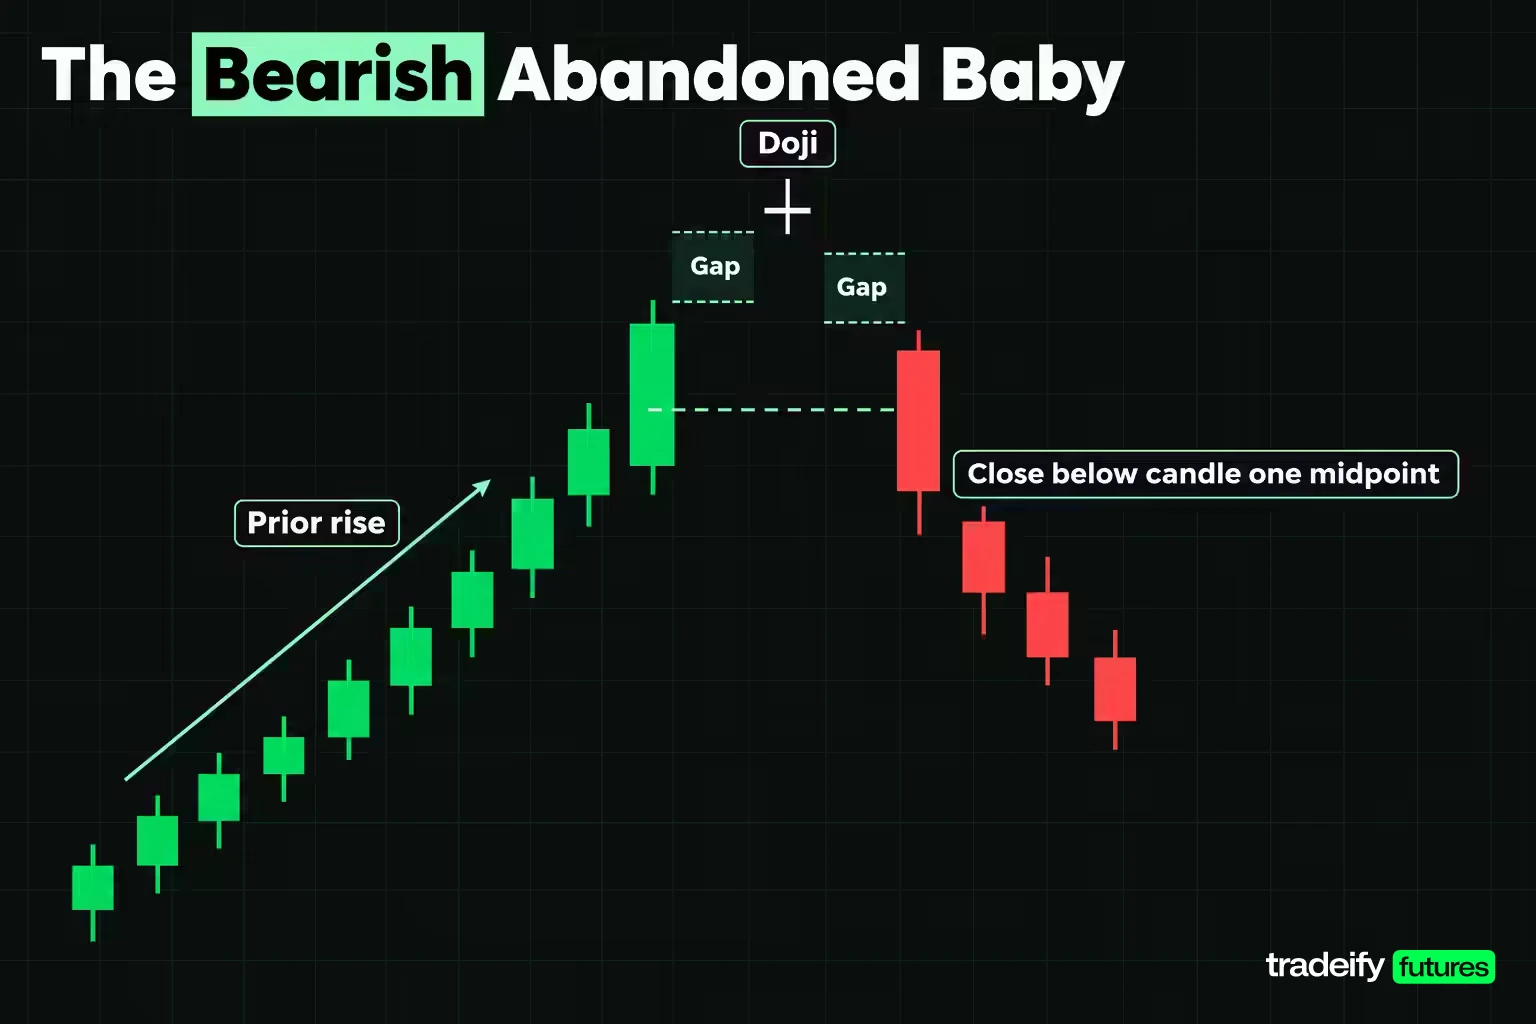
The bearish abandoned baby is the top reversal version, forming after a rise. Bulkowski's guideline asks for a white candle in an uptrend, then a doji whose lower shadow stays above that candle's high, then a black candle whose upper shadow stays below the doji's low.
An illustrative MES version:
- Candle one opens 7,700.00, highs at 7,742.00, lows at 7,696.00 and closes 7,738.00, a 38.00-point body on a 46.00-point range.
- The doji opens 7,756.00, highs at 7,764.00, lows at 7,750.00 and closes 7,755.75, a 0.25-point body on a 14.00-point range, sitting 8.00 points clear above candle one's high.
- Candle three opens 7,744.00, highs at 7,746.00, lows at 7,704.00 and closes 7,708.00, leaving 4.00 points clear below the doji's low and closing below candle one's body midpoint at 7,719.00.
The invalidation sits one tick above the doji's high at 7,764.25. A short at the close of 7,708.00 risks 56.25 points, which is $281.25 per MES contract. Against an illustrative target at 7,640.00, the reward is 68.00 points, about 1.21 to 1, so the trade needs to win more than 45.27% of the time to break even before costs.
The bearish half has a weaker tested record than its bullish twin. Bulkowski found it acting as a bearish reversal 69% of the time, but its overall performance rank is 64 out of 103 patterns, which he calls "lousy", because the moves after downward breakouts were mediocre. His best average 10-day result for the pattern was a 5.34% rise after an upward breakout, the opposite direction to the pattern's name. A bearish abandoned baby that does break down may not travel far, so a target far below the pattern deserves suspicion.
Abandoned Baby vs Morning Star and Evening Star
The abandoned baby is a stricter member of the star family, and the comparison explains both its appeal and its rarity. Bulkowski notes that the morning doji star is similar to the bullish abandoned baby, and that removing the doji requirement leaves a plain morning star. The bearish side follows the same ladder with the evening star. The reversal rates and frequency ranks below are Bulkowski's tested figures from his pattern pages.
| Pattern | Middle candle | Isolation rule | Tested reversal rate | Frequency rank of 103 |
|---|---|---|---|---|
| Bullish abandoned baby | Doji | Doji range gapped clear of both neighbors' shadows | 70% | 92 |
| Bearish abandoned baby | Doji | Doji range gapped clear of both neighbors' shadows | 69% | 96 |
| Morning doji star | Doji | Doji body gaps below the prior body | 76% | 78 |
| Evening doji star | Doji | Doji body gaps above both neighboring bodies | 71% | 81 |
| Morning star | Small body, any color | Body gaps below the prior body | 78% | 66 |
| Evening star | Small body, any color | Body gaps above both neighboring bodies | 72% | 71 |
Reading down the isolation column, each step from star to doji star to abandoned baby adds a condition and removes candles from the sample. A higher frequency rank number means a rarer pattern, so both abandoned baby versions are the rarest in the table.
Notice what the extra strictness does not buy. In Bulkowski's tests, the abandoned baby's reversal rates are not higher than the plain morning star's 78% or the evening star's 72%. Investopedia makes the structural point directly: the morning and evening star do not require the middle candle to be a doji, or to have gaps on either side. The abandoned baby asks for more and, on this evidence, delivers a similar reversal rate.
Related lesson: Morning star and evening star patterns
Abandoned Baby vs Doji Star
A doji star is a two-candle pattern: a long candle followed by a doji that gaps away from its body. The bullish doji star has a tall black candle and then a doji gapping below the prior body, and the shadows are allowed to overlap.
The abandoned baby is a doji star plus a third candle that gaps back the other way, with no shadow overlap anywhere around the doji. That third candle matters. Bulkowski's testing found the bullish doji star acting as a bearish continuation 64% of the time and the bearish doji star as a bullish continuation 69% of the time. On its own the doji star more often marked a pause in the trend than a turn. The reversal case only comes from the candle that follows.
How Rare the Abandoned Baby Pattern Is
The abandoned baby pattern is rare enough that the counts say more than any adjective.
- Bulkowski located 293 bullish abandoned babies in 4.7 million candle lines. That is about one per 16,041 candles, or 0.062 per 1,000 bars.
- Investopedia reports the bearish version appearing approximately 50 times over two decades across S&P 500 stocks.
- On Bulkowski's frequency ranking, the bullish version ranks 92 and the bearish version 96 out of 103 candle types, where 1 is the most common.
To put the first figure in screen-time terms, imagine a watchlist of 50 symbols checked on daily bars for an illustrative 20-session month. That is 1,000 bars a month, so at Bulkowski's rate you would expect one bullish abandoned baby roughly every 16 months across the whole list.
Rarity has two practical consequences. The first is that most formations you see that look like an abandoned baby will be morning stars or doji stars that fail the isolation test. The second is that you cannot build a meaningful personal sample of this pattern quickly, so any judgement about how it performs for you will rest on very few trades for a long time.
How to Trade the Abandoned Baby Candlestick Pattern
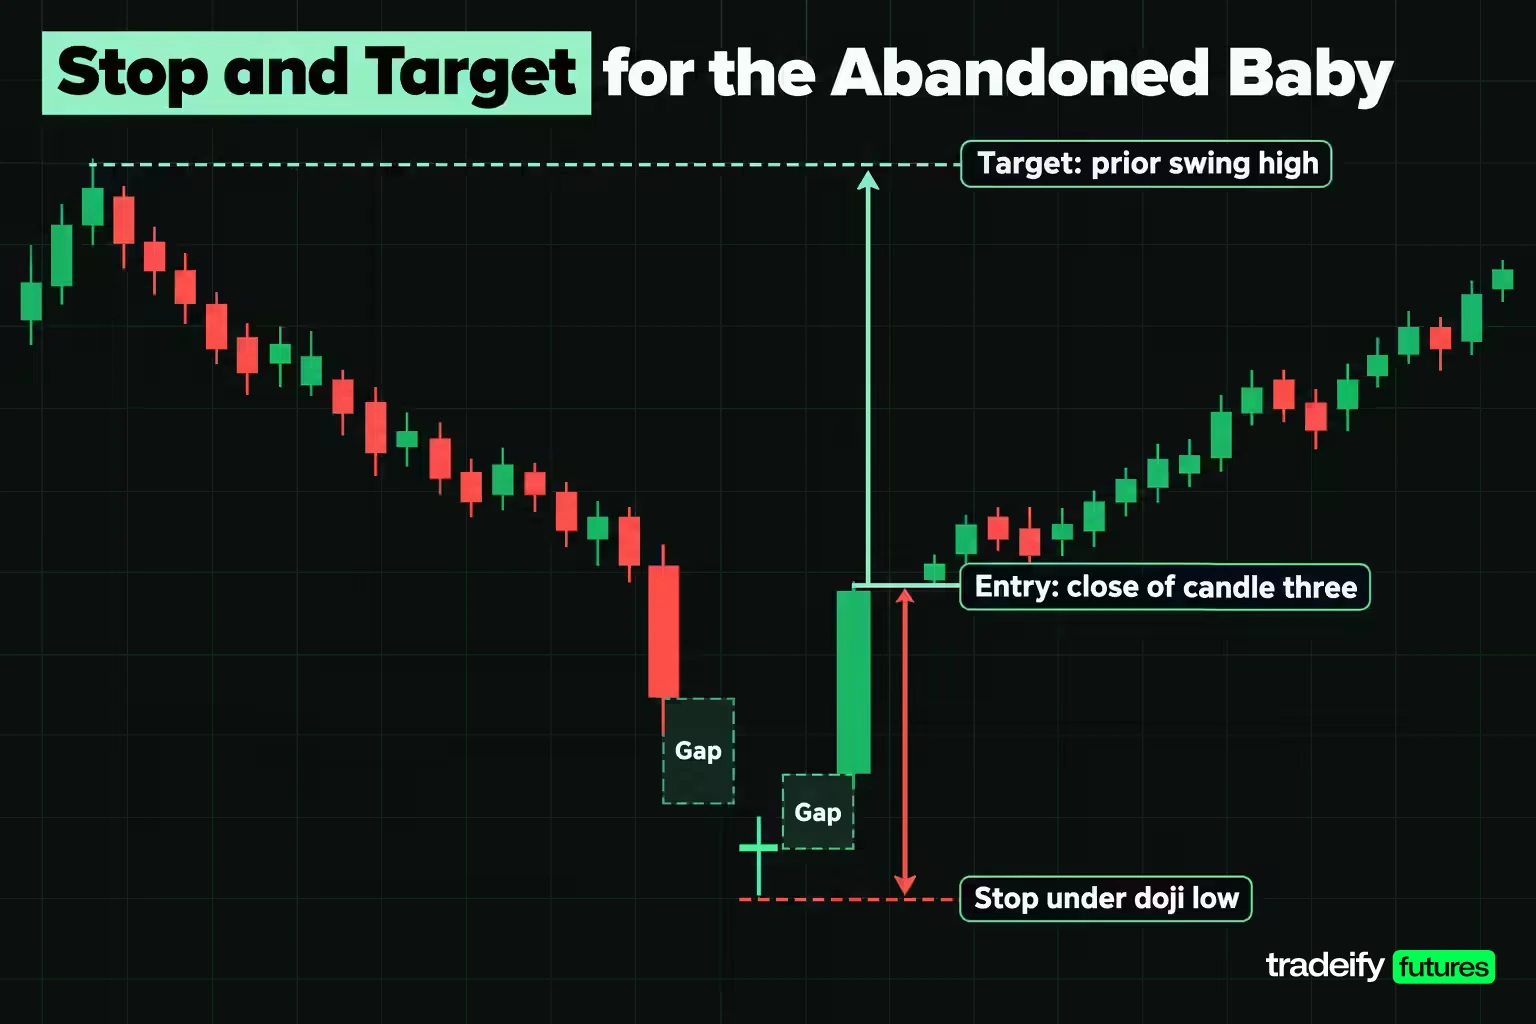
Trading the abandoned baby candlestick pattern comes down to three decisions made before any order goes in: where the idea is wrong, where you will take profit, and which entry you will use. The levels here come from an illustrative bullish abandoned baby on daily Micro E-mini S&P 500 (MES) bars, at $5 per index point. Its first candle highs at 7,664.00, the doji lows at 7,588.00, and the third candle highs at 7,652.00, lows at 7,609.00 and closes at 7,648.00, after a decline from a swing high at 7,720.00.
- Stop. The convention is one tick beyond the pattern's extreme. For the bullish example that is one tick under the doji's low, at 7,587.75. A trade back below the doji says the reversal failed.
- Target. The illustrative swing high at 7,720.00, where the decline started. A measured move (the 76.00-point pattern height added to the pattern high) is the other common choice.
- Entry trigger. Either the close of candle three, a trade above candle three's high in the next session, or a pullback into candle three's body.
The distance from stop to target is fixed at 132.25 points, or $661.25 per MES contract, whichever entry you choose. What the entry changes is how much of that distance you put at risk.
Comparing Three Abandoned Baby Entries on One Stop
| Entry route | Entry price | Risk in points | Risk per MES | Reward to risk | Break-even win rate | Break-even with $1.50 round turn |
|---|---|---|---|---|---|---|
| Close of candle three | 7,648.00 | 60.25 | $301.25 | 1.20 to 1 | 45.56% | 45.78% |
| One tick above candle three's high | 7,652.25 | 64.50 | $322.50 | 1.05 to 1 | 48.77% | 49.00% |
| Pullback into candle three's body | 7,630.00 | 42.25 | $211.25 | 2.13 to 1 | 31.95% | 32.17% |
The $1.50 round turn is an illustrative cost, not a published fee schedule.
Waiting for a break above candle three's high is often described as the safe choice. Here it is the most expensive route, because it moves the entry 4.25 points further from the stop and 4.25 points closer to the target, pushing the break-even rate from 45.56% to 48.77%. You buy extra confirmation with a worse price. That can still be the right call, but it should be a decision you price, not a habit you assume is free.
The pullback route looks best on paper, with a break-even rate of 31.95%. The catch is that it only fills if price comes back 18.00 points from candle three's close, and the strongest reversals are often the ones that never offer that pullback. A route that rarely fills is not cheap, it is just unfilled.
Sizing an Abandoned Baby Trade From the Stop
Daily-chart abandoned babies come with wide stops, which makes position size the real constraint. At 1% of an illustrative $50,000 account, the risk budget is $500.
- Close entry: $301.25 per MES, so 1 contract.
- Break entry: $322.50 per MES, so 1 contract.
- Pullback entry: $211.25 per MES, so 2 contracts, $422.50 at risk.
- Full-size E-mini S&P 500 (ES): the close entry would risk $3,012.50 per contract, so the budget supports 0 ES on every route.
Cut the budget to 0.5% ($250) and the close and break routes floor to 0 MES. That is an honest answer: the setup does not fit the account, and the right size is no trade.
It is tempting to shrink the risk with a tighter stop one tick under candle three's low, at 7,608.75. From the close entry that cuts the risk to 39.25 points, or $196.25 per MES, and the break-even rate to 35.28%. The problem is that 7,608.75 sits inside the 7.00-point gap, where no trades printed. If the next session opens down through the gap, the stop can fill far below its price. A tighter stop is not automatically a smaller loss.
Related lesson: Position sizing
Confirming an Abandoned Baby With Volume, Levels and Indicators
An abandoned baby is a candle pattern, and candle patterns work best as evidence alongside other evidence rather than as a standalone trigger. These are the confirmation checks most worth writing into a rule.
- Location. A bullish abandoned baby at a prior support zone or after an extended decline means more than one in the middle of a range. Bulkowski's notes say bullish abandoned babies within a third of the yearly low performed best after upward breakouts, though he flags the sample as small.
- The confirming close. Bulkowski defines an upward breakout as a close above the top of the pattern and a downward breakout as a close below the bottom. Take an illustrative bullish abandoned baby on MES whose first candle highs at 7,664.00 and whose third candle closes at 7,648.00. Under that definition, the breakout is confirmed only by a later close above 7,664.00, which candle three has not delivered yet.
- Volume on the doji. TradingSim suggests checking the doji bar's volume against its 20-bar average rather than just the two neighboring candles. Heavy volume on a session that went nowhere suggests a lot of effort met a lot of opposing orders.
- Higher timeframe structure. A daily reversal pattern pointing into a weekly downtrend has more to prove than one aligned with the bigger trend.
- Momentum indicators. An oversold reading or a bullish divergence can support the case, but it adds context rather than proof. If the pattern fails your structural tests, an indicator should not rescue it.
The useful discipline is to decide in advance which of these checks are required and which are optional. A confirmation list that grows only when a setup looks tempting is a way of talking yourself into a trade.
Related lesson: Support and resistance
Abandoned Baby Reliability and Failure Scenarios
The abandoned baby is usually promoted on a single number, so it is worth being precise about what the published figures measure.
Bulkowski's tested results put the bullish abandoned baby as a bullish reversal 70% of the time, with an overall performance rank of 9 out of 103 candle types, and the bearish version as a bearish reversal 69% of the time, with an overall rank of 64. Three caveats travel with those figures:
- They are breakout-direction rates, not win rates. They say which way price broke out, not whether a trade with a stop, target and costs made money.
- They come from perfect trades. Bulkowski's figures assume ideal execution with no cost model.
- The samples are thin. Bulkowski states that his bear-market statistics for both versions use fewer than 20 samples. The bullish pattern's headline performance rank leans on a 10.31% average 10-day drop after downward breakouts in a bear market, based on just 14 candle patterns, and he says himself that it is unreliable and likely to change.
Investopedia offers a different kind of statistic. When the bearish version appeared across S&P 500 stocks, price trended lower over the next 20 days about 65% of the time, with a median return of -3.00%. That is a forward-return figure without an entry, stop or cost model, so it describes the tendency, not a tradable rule.
Academic Tests of Three-Candle Reversals Like the Abandoned Baby
Peer-reviewed studies test candlestick patterns as families, so they are evidence about candlestick rules in general, not a verdict on the abandoned baby specifically.
- Caginalp and Laurent (1998) tested three-day reversal patterns on daily prices of all S&P 500 stocks from 1992 to 1996 and found out-of-sample significance of 36 standard deviations, with a profit of almost 1% over a two-day holding period.
- Marshall, Young and Rose (2006) found no profits from candlestick patterns on Dow Jones Industrial Average stocks over 1992 to 2002.
- Duvinage, Mazza and Petitjean (2013) used 5-minute data on the 30 Dow constituents and found that after costs and a data-snooping correction, no single rule beat buy-and-hold.
- Lu, Chen and Hsu (2015) found eight three-day reversal patterns profitable on Dow components at a 0.5% transaction cost when held with the Caginalp and Laurent exit method, but not with a fixed-date exit.
- Tharavanij and colleagues (2017) tested SET50 stocks in Thailand from 2006 to 2016 and concluded that candlestick patterns cannot reliably predict market direction.
The pattern of results is consistent: whether a candlestick rule shows an edge depends heavily on the market, the period, the exit rule and the costs. The only test that applies to your rule is a logged sample of your own trades.
Related lesson: Backtesting a trading strategy
Common Abandoned Baby Failure Modes
| Failure mode | Why it happens | Rule that catches it |
|---|---|---|
| Trading a doji star or morning star as an abandoned baby | The looser patterns are far more common and look almost identical | Require measured space between the doji's range and both neighbors before the setup counts |
| Finding the pattern on charts that rarely gap | Near-continuous sessions produce overlap, not gaps | Use one written definition and the chart type it suits; never switch rules mid-sample |
| Stop placed inside the gap | The gap makes a tight stop look cheap | Put the stop beyond the pattern extreme, or treat the gap as fill risk |
| Sizing up because the pattern is called reliable | Headline rates are breakout rates from perfect trades on small samples | Size from the stop distance and a fixed account risk only |
| Judging the pattern on three or four trades | The pattern is too rare to produce a quick sample | Review at a preset count, such as 20 logged instances |
| Bearish target set too far away | Tested downside follow-through after bearish abandoned babies was weak | Use a nearby level as the first target and reassess |
Advantages and Limitations of the Abandoned Baby
The abandoned baby has real strengths as a pattern, and limits that matter more than most guides admit.
Advantages
- Objective structure. The gap test either passes or fails. You can measure it in points instead of judging it by eye.
- Built-in invalidation. The doji's extreme is a natural stop level with a clear meaning.
- A clear story. A stalled trend, a session of indecision and a gap in the opposite direction is one of the more readable shifts in control a chart can show.
- Solid tested reversal rates. Bulkowski's 69% and 70% figures put both versions well above a coin flip on breakout direction.
Limitations
- Rarity. At about one per 16,041 candles, you may wait a long time between setups and will rarely build a personal sample.
- Wide stops. The stop sits beyond the doji, so on daily bars the risk per contract can be large. In the illustrative MES example the close entry risks $301.25 per contract.
- Gap dependence. The pattern needs session gaps, so it barely exists on charts that trade almost around the clock.
- Small, idealised samples. The published figures rest on few cases and perfect trades with no costs.
- No size or duration signal. The pattern says control shifted. It does not say how far price will travel, and Bulkowski notes the upward trend after a bullish abandoned baby often does not last long.
Abandoned Baby Gaps on Daily, Futures and Intraday Charts
Every abandoned baby definition depends on gaps, and a gap is a property of how a chart's sessions are built, not of price itself. That makes the timeframe and the instrument decide whether the pattern can appear at all.
Daily stock charts. NYSE's core trading session runs 9:30 AM to 4:00 PM ET, so each daily bar starts after a long closed period. News lands overnight, the next session opens somewhere else, and gaps are routine. That is why the classic abandoned baby examples come from stock charts.
Daily futures charts. E-mini S&P 500 futures trade on CME Globex from Sunday 6:00 PM to Friday 5:00 PM ET, with a daily maintenance period from 5:00 PM to 6:00 PM ET. The only daily break is that one hour, so true gaps between daily futures bars are much less common than on stocks. Many futures traders use a chart limited to regular cash-market hours to get session gaps closer to the stock version, which is a chart setting, not a different market.
Intraday charts. On 5-minute or 15-minute bars of a near-continuous market, consecutive bars almost always share prices. TradingSim makes the same point: true gaps on both sides of the doji do not show up often intraday. Intraday traders who want to use the idea usually relax it to a no-overlap rule on the doji's range, which should be stated in writing as a modified definition.
The timeframe also changes the money. A daily-chart pattern produces a daily-sized stop, like the 60.25 points in the MES example. A trader who only trades within one session may use a daily abandoned baby as context for intraday entries rather than holding the daily trade itself.
Related lesson: Gaps and gap analysis
Abandoned Baby Checklist Before Taking a Trade
Run the same abandoned baby routine on every chart, in this order, and log the results whether or not you trade.
- Confirm the prior trend with a written rule before looking at the three candles.
- Record the open, high, low and close of all three candles.
- Test the doji: a tiny body against its own range, and measured clear space to both neighbors under your chosen gap rule.
- Test candle three: opposite color, a gap away from the doji, and a strong close.
- Mark the stop one tick beyond the pattern extreme, then the first target.
- Choose the entry route and calculate the break-even win rate before placing an order.
- Size from the stop distance and a fixed account risk, and accept zero contracts if the setup does not fit.
- Log entry, stop, size and exit for every instance, and review at a preset count rather than after each trade.
On our accounts, every position is closed by 4:45 PM ET on regular trading days, and there are no overnight, weekend or swing holds. That means a daily abandoned baby can only serve as a reference level for a trade opened and closed within one session; a trade that needs the daily-chart stop held for days does not fit those rules. Size still comes from the contract limits, for example 4 minis or 40 micros on a 50K account, and WealthCharts Chart Replay lets you practice spotting the pattern on historical data. Evaluation and funded accounts are simulated.
Related lesson: How to keep a trading journal
Abandoned Baby FAQ
Is the abandoned baby pattern bullish or bearish?
It can be either. The bullish abandoned baby forms after a decline and points to a move up, while the bearish version forms after a rise and points to a move down. Bulkowski's testing found both acting as reversals about 70% and 69% of the time.
What is a Doji star candlestick pattern?
A doji star is a two-candle pattern where a long candle is followed by a doji that gaps away from its body. Unlike the abandoned baby, the shadows may overlap and there is no third confirming candle. In Bulkowski's testing, both doji star versions more often acted as continuations than reversals.
What is the bearish engulfing pattern?
A bearish engulfing pattern is a two-candle top reversal in an uptrend. A white candle is followed by a taller black candle whose body overlaps the white body. Bulkowski found it acting as a bearish reversal 79% of the time, and it is far more common than the abandoned baby.
What is a rejection candle?
A rejection candle is an informal name for a candle with a long shadow showing price moved to a level and was pushed back. A hammer is a common example, with a lower shadow at least two or three times the height of its body. It records rejection of lower prices, not a confirmed reversal.
Can a dragonfly doji be bearish?
Yes, it can be followed by a move down. A dragonfly doji has a long lower shadow and closes at the top of its range, and Bulkowski's testing found it acting as a reversal only 50% of the time. He treats it as indecision, so its direction depends on what follows.
Does an abandoned baby need a gap on futures charts?
Under the strict definition, yes. Because index futures trade nearly around the clock, true gaps are uncommon, so traders either use regular-hours charts or apply a written no-overlap rule to the doji's range.
Abandoned Baby Trading Risk
This article is general education about how a candlestick pattern is read and how the risk around a trade is calculated. It is not investment advice or a recommendation to trade any product. Futures are leveraged, losses can exceed what you expect, and a stop order can fill well beyond its price when the market gaps. All prices, account sizes and costs in the examples are illustrative. Evaluation and funded accounts at prop firms are simulated, and simulated results do not guarantee live results.


