



TL;DR: Gap trading means deciding whether to fade or follow the open when price jumps past the prior session's close. Classify the gap with prices you have at the open, and save labels like breakaway or exhaustion for the debrief. No universal fill rate exists, so price both plans before you pick one. In the worked E-mini S&P 500 example, a 36.00-point gap faded with a half-gap stop breaks even at a 33.33% win rate before costs.
Gap trading is the work of deciding what to do when a market opens away from where it last traded. The chart shows empty space between one bar and the next, and you have a few minutes to decide whether that space is going to close or stretch further.
The temptation is to act on the first strong candle. A gap up looks like strength, a gap down looks like panic, and both feel urgent. Most of the damage comes from treating that moment as a feeling instead of a decision.
This guide turns it into a routine: what a gap is, why it formed, which mechanical type it is, what volume says, and what each possible trade costs in points, ticks and dollars before you place it.
What Gap Trading Means and What Counts as a Gap
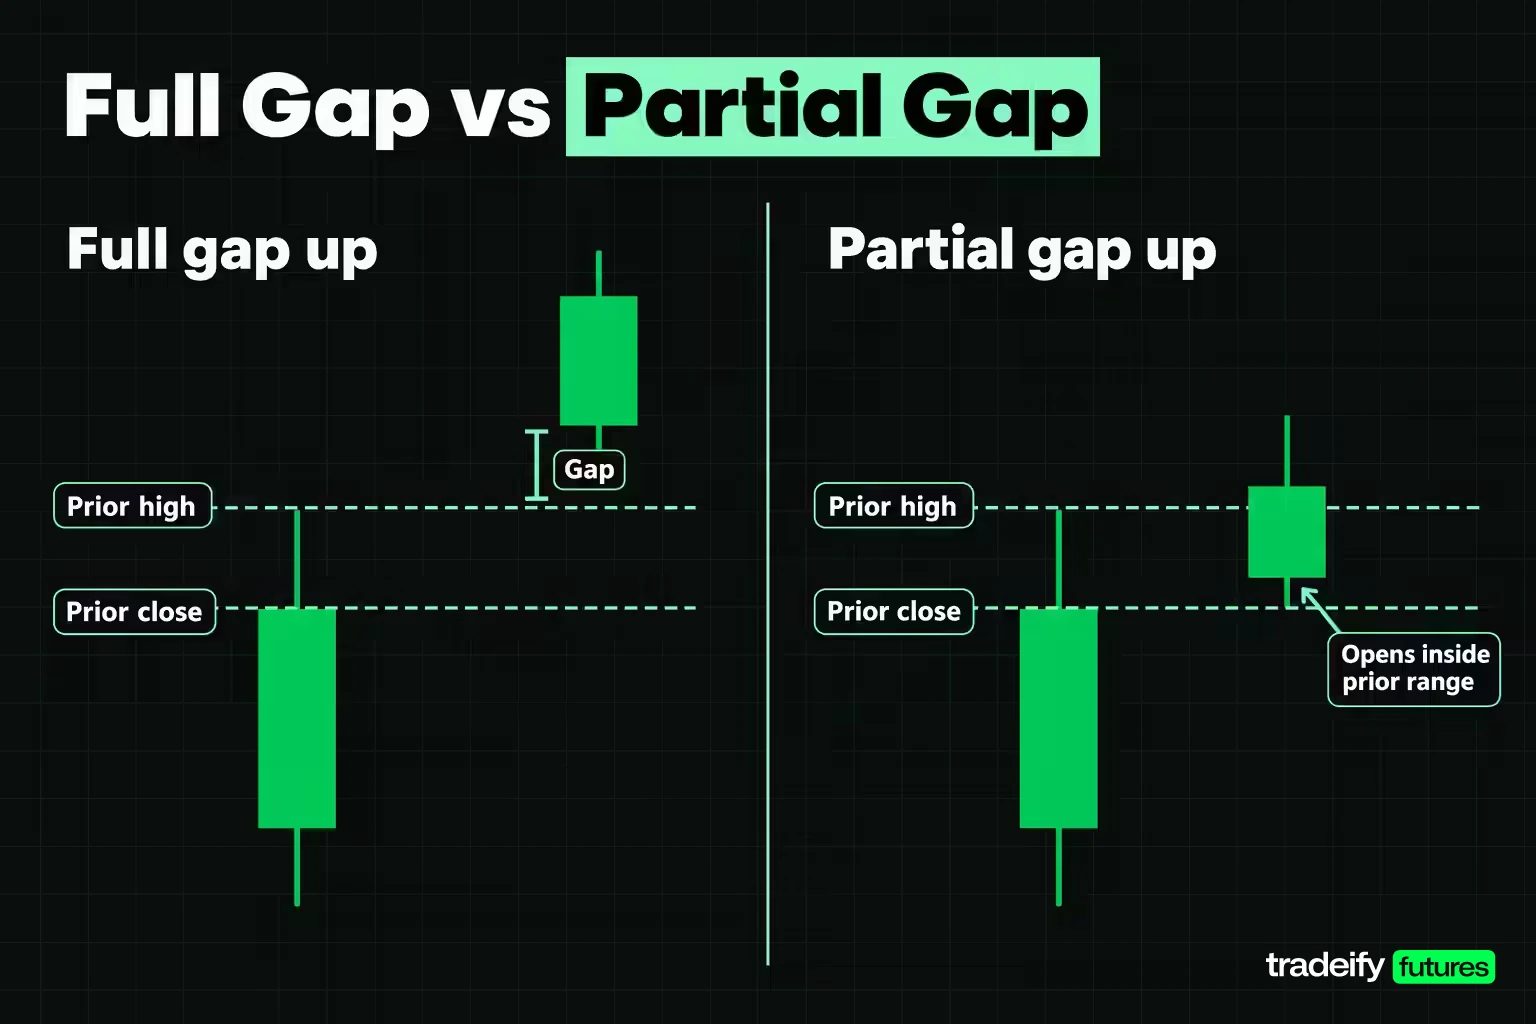
A price gap is a stretch of the chart where no trades happened. On a bar or candlestick chart it shows as empty space between the high of one bar and the low of the next (a gap up), or between the low of one bar and the high of the next (a gap down).
Gap trading is any plan built around that space. Some traders bet the gap keeps going. Others bet price comes back to close it. Both camps start from the same three reference prices: the prior session's high, low and close (or settlement for futures). If you don't have those three numbers written down, you aren't trading the gap yet, you're trading the candle.
Gap Up, Gap Down and Partial Gaps
Two definitions are in common use, and mixing them up causes most beginner confusion.
- Loose definition. A gap up is any open above the previous close. A gap down is any open below it.
- Strict definition. A full gap up opens above the previous session's high. A full gap down opens below the previous session's low.
- Partial gap. The open is beyond the previous close but still inside the previous session's range.
The strict version is more useful for trading because two people applying it to the same chart get the same answer. A partial gap is closer to a strong open than to a true jump, since buyers and sellers already traded at that price the day before.
A stock gap is the same idea applied to a single share. A company reports after the close, and the next morning the stock opens at a price that reflects the news. That jump is the gap.
Why Markets Gap Between Sessions
Markets gap because orders keep arriving while trading is shut. When the session reopens, the first trade clears wherever buyers and sellers now agree, which may be well away from the last print.
The usual causes:
- Company news. Earnings, guidance changes, mergers and legal rulings, often released outside regular hours.
- Scheduled economic data. Releases such as CPI and payrolls land at 8:30 AM ET, before the NYSE opens at 9:30 AM ET.
- Overnight and weekend events. Moves in Asian and European markets, policy decisions, geopolitical news.
- Order imbalance. A cluster of pre-open orders on one side can push the opening price on its own, even without a headline.
How Futures Gaps Differ From Stock Gaps
The cause of a gap depends on whether the market was actually closed. US stocks trade a core session from 9:30 AM to 4:00 PM ET, so the 16-plus hours between sessions are a real halt for most participants and the open often reprices across it.
Equity index futures are different. CME Globex trades the E-mini S&P 500 from Sunday 6:00 PM to Friday 5:00 PM ET, with a daily maintenance break from 5:00 PM to 6:00 PM ET. A contract that trades about 23 hours a day rarely gaps at the stock market open, because it was trading all night. Its real gaps sit at the Sunday reopen, after the daily break, and after holiday closures.
That changes how you read a futures chart, and it's an easy one to miss. If a chart built on regular-hours bars shows a gap at 9:30 AM ET, the "gap" is a choice in the chart settings, not empty space in the market. Plenty of traders still trade that regular-hours gap on futures, and that is fine, as long as they know the overnight session already traded through most of it.
Related lesson: Futures trading sessions
The Four Types of Gaps and Their Hindsight Problem
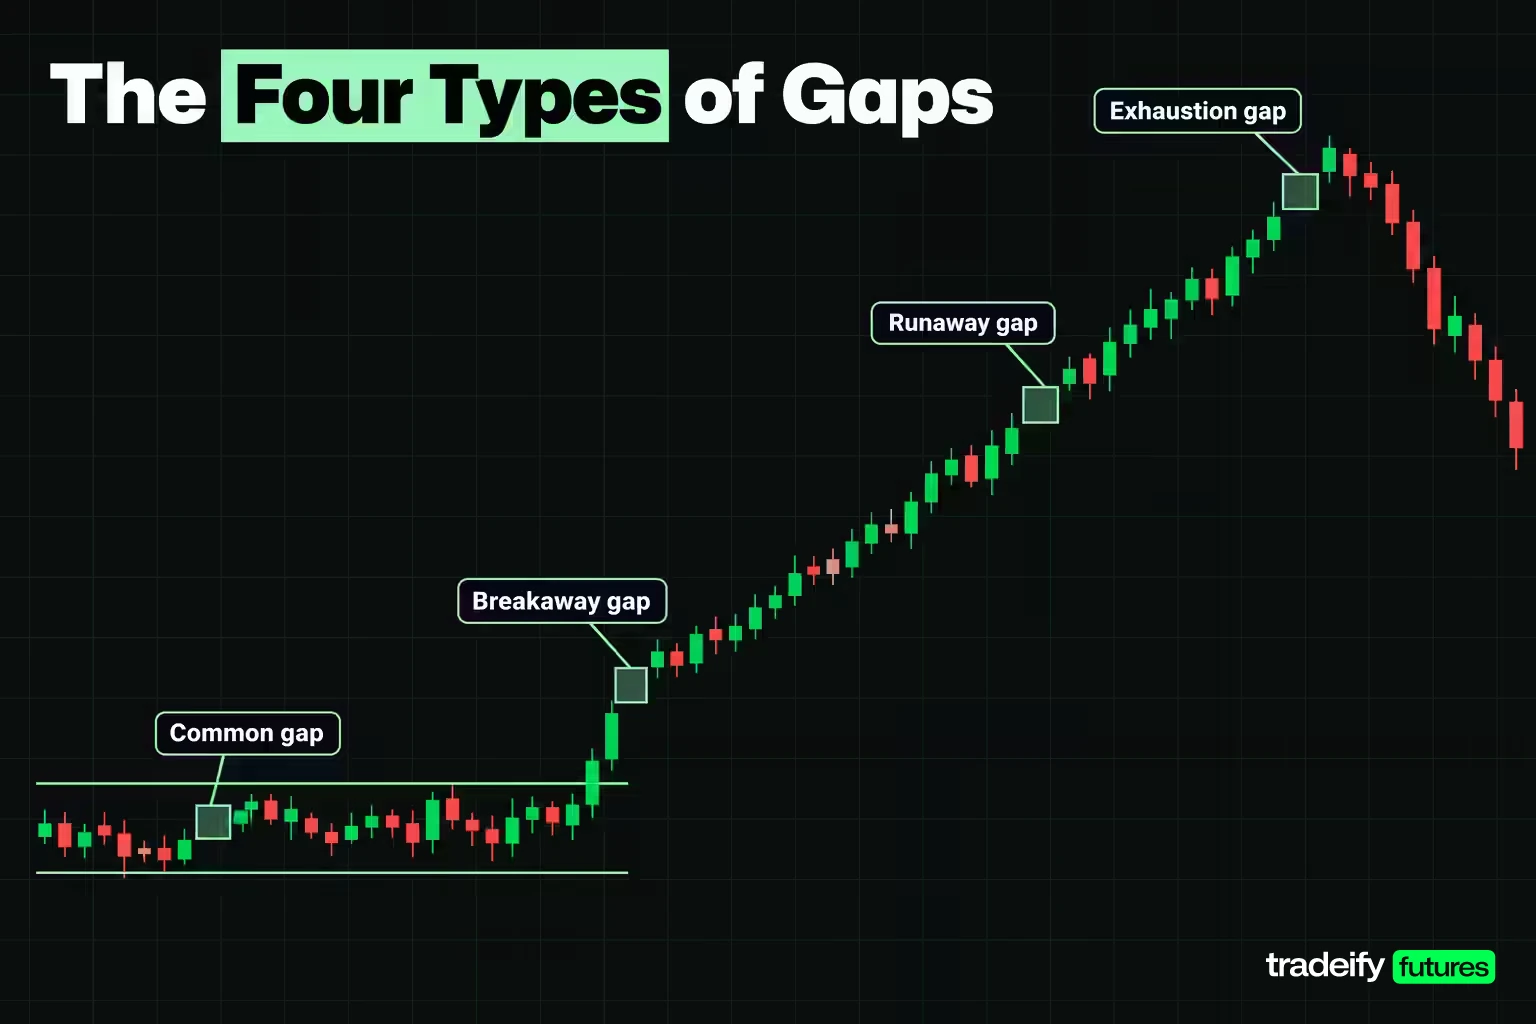
Four gap names appear in almost every reference: common, breakaway, runaway and exhaustion. They are useful vocabulary. They are also the biggest source of false confidence in gap trading, because each one describes where a gap sat in a move, and you only know that once the move is over.
| Gap type | Where it sits in the move | What you can check at the open | How it misleads |
|---|---|---|---|
| Common gap | Inside a sideways range | Opens beyond the prior close but inside the prior range | Most likely to fill and least likely to pay, because price is still boxed in |
| Breakaway gap | As price leaves a consolidation | Opens beyond the prior high or low after narrow ranges, often on heavy volume | The name gets applied after the trend shows up; at the open you only have a breakout attempt |
| Runaway gap, also called a measuring gap | Mid-trend, in the direction of travel | Opens with the trend while the swing structure is intact | Least likely to fill, so a fade that worked last week can fail without warning |
| Exhaustion gap | Late in an extended move | Opens with the trend after several large range days, often on thinner participation | Looks identical to a runaway gap at the open; only the next sessions separate them |
The practical rule is simple. Use the mechanical definitions (full or partial, up or down) to describe what happened at the open. Use the four type names in your debrief.
"This was a breakaway gap" is a statement about history. "This opened above yesterday's high on heavy volume, so I am treating it as a continuation candidate with this stop" is something you can act on.
Related lesson: Market structure highs lows and trends
Market Conditions That Make Gaps More Likely
Gaps cluster around information, which is why gap trading is busiest in some weeks and nearly idle in others. The more news that lands while a market is shut, the larger and more frequent the gaps tend to be.
Conditions where gaps are more common:
- Earnings season. Individual stocks gap most around their own reports, and index futures can gap when several large companies report in the same week.
- Scheduled macro releases. Inflation, jobs and central bank decisions can reprice everything at once.
- Weekends and holidays. Two or three days of news meet one opening print.
- High-volatility regimes. When daily ranges are already wide, opening jumps tend to scale with them.
- Sentiment extremes. After a long one-sided run, crowded positioning can produce a sharp opening move in either direction.
Conditions where gaps matter less: quiet, range-bound weeks where small common gaps form and close inside the same range. Those gaps are mostly noise. Trading every one of them is how a filter quietly becomes a habit, and a habit is not an edge.
Exchanges also cap how far some markets can move. For US equity index futures, CME sets a 7% upside and downside limit overnight (6:00 PM to 9:30 AM ET) and uses dynamic circuit breakers with a 3.5% width: a move beyond 3.5% within an hour pauses trading for two minutes. In an extreme gap the market can stop trading before it reaches your stop price.
Related lesson: Price limits and limit moves
Gap Fill Analysis and What the Research Shows
A gap is filled when price trades back to the level it gapped away from: the prior close or settlement for a loose gap, the prior high or low for a strict one. A fill on the same day is often called fading the gap.
The claim on most pages about gap trading is that "gaps always fill." The research is more careful than that.
- A study by Plastun, Sibande, Gupta and Wohar in the North American Journal of Economics and Finance (2020) looked at the Dow, the S&P 500 and the Nasdaq from 1928 to 2018. It found prices tended to move in the direction of the gap on the gap day, and its results ran contrary to the idea that gaps tend to get filled.
- A paper by Liu, Wang, Jiang, Chen and Li (Springer, 2021) compared real Chinese and US stock data with detrended and randomly shuffled versions. It concluded only that a gap-filling tendency may exist, and that the overall trend slows the refilling.
Neither result gives you a fill rate for the market you trade, which matters for gap trading because the fade is usually sized as if a fill were likely. Fill behavior changes by instrument, timeframe and sample period. A rate quoted for one index over one decade does not transfer to another.
So treat "this gap will fill" as a hypothesis with an invalidation level, not as a probability you can size from. Some gaps fill within minutes, some fill weeks later, and some never fill at all. If a fade only works when you ignore the gaps that didn't fill, the sample is lying to you.
What Makes a Gap Fill More or Less Likely
Practitioners watch a few conditions that tilt the odds without settling them:
- Location. A common gap inside a range is a fill candidate; a breakaway gap out of a long base is where fades get run over.
- Size against range. A gap that is a fraction of the average daily range is easier to retrace than one larger than a full day's range.
- Volume. A gap on light participation is easier to push back than one on heavy volume.
- Catalyst. A gap on a genuine change in information (a guidance cut, a surprise policy decision) has less reason to retrace than a gap on overnight drift.
Volume and Liquidity Behind a Gap
In gap trading, volume tells you how many participants agreed with the opening price. A gap on heavy early volume says many traders acted on the new information. A gap on light volume says the move may rest on a handful of orders.
Traders usually measure this as relative volume: the current period's volume compared with the average for the same time of day over recent sessions. Comparing the first 15 or 30 minutes against a full-day average makes every open look heavy, so match like with like.
How volume changes the read:
- Heavy volume, price holding beyond the prior high or low. Supports a continuation plan.
- Heavy volume, price reversing back into the prior range. Often marks a failed gap and supports a fade.
- Light volume, price drifting. No conclusion. This is the case where doing nothing is a valid decision, even though it rarely feels like one at the open.
Liquidity is the other half. Spreads are often wider and the order book thinner at a reopen than in the middle of a regular session, so a market order at the open can fill several ticks away from the price on screen. Inside the gap itself there are no prior trades, which means no volume-based support or resistance until the market builds some.
Related lesson: What is volume
Technical Analysis for Gap Trading
Technical analysis for gap trading starts with a few reference levels and one scaling number. Indicators come later, as confirmation.
Prior Session Levels That Frame a Price Gap
- Prior session high, low and close. These decide whether the gap is full or partial and where the fill sits.
- The larger-timeframe structure. A gap out of a multi-week range is a different event from a gap in the middle of a strong trend.
- Nearby support and resistance. A gap that opens just under a well-tested level has less room to run.
- Average true range (ATR). Dividing the gap by ATR tells you whether it is small or large for that market, which points alone cannot.
A Gap Classification Checklist
Work through these in order before you place any order. Each step produces a fact rather than an opinion.
- Record the prior session's high, low and close, plus the current open.
- Measure the gap in points, as a percent of the prior close, and as a multiple of ATR.
- Mark it full or partial by comparing the open with the prior high or low.
- Check the larger chart for location: range, breakout or extended trend.
- Note the catalyst and the session the gap formed in.
- Write a fade plan and a continuation plan, each with entry, stop, target and invalidation.
If you cannot write both plans, you have picked a side rather than classified a gap.
Related lesson: Average true range ATR
Indicators for Confirming Gaps
Indicators don't find gaps, but a few help judge them once the session opens.
- VWAP. Price holding above the session VWAP after a gap up suggests buyers are defending the move; losing it suggests the gap is being sold.
- Moving averages. A gap that clears a widely watched daily average carries more weight than one that stalls under it.
- RSI. An extreme reading into an extended move can flag a possible exhaustion gap, but overbought markets can stay overbought.
- On-balance volume. A gap that OBV confirms is better supported than one where OBV diverges.
Use one or two of these as filters on a gap plan you already wrote, not as triggers on their own. Stacking five indicators on an open mostly gives you five reasons to talk yourself into the trade you already wanted.
Gap Trading Strategies From Gap and Go to the Gap Fade
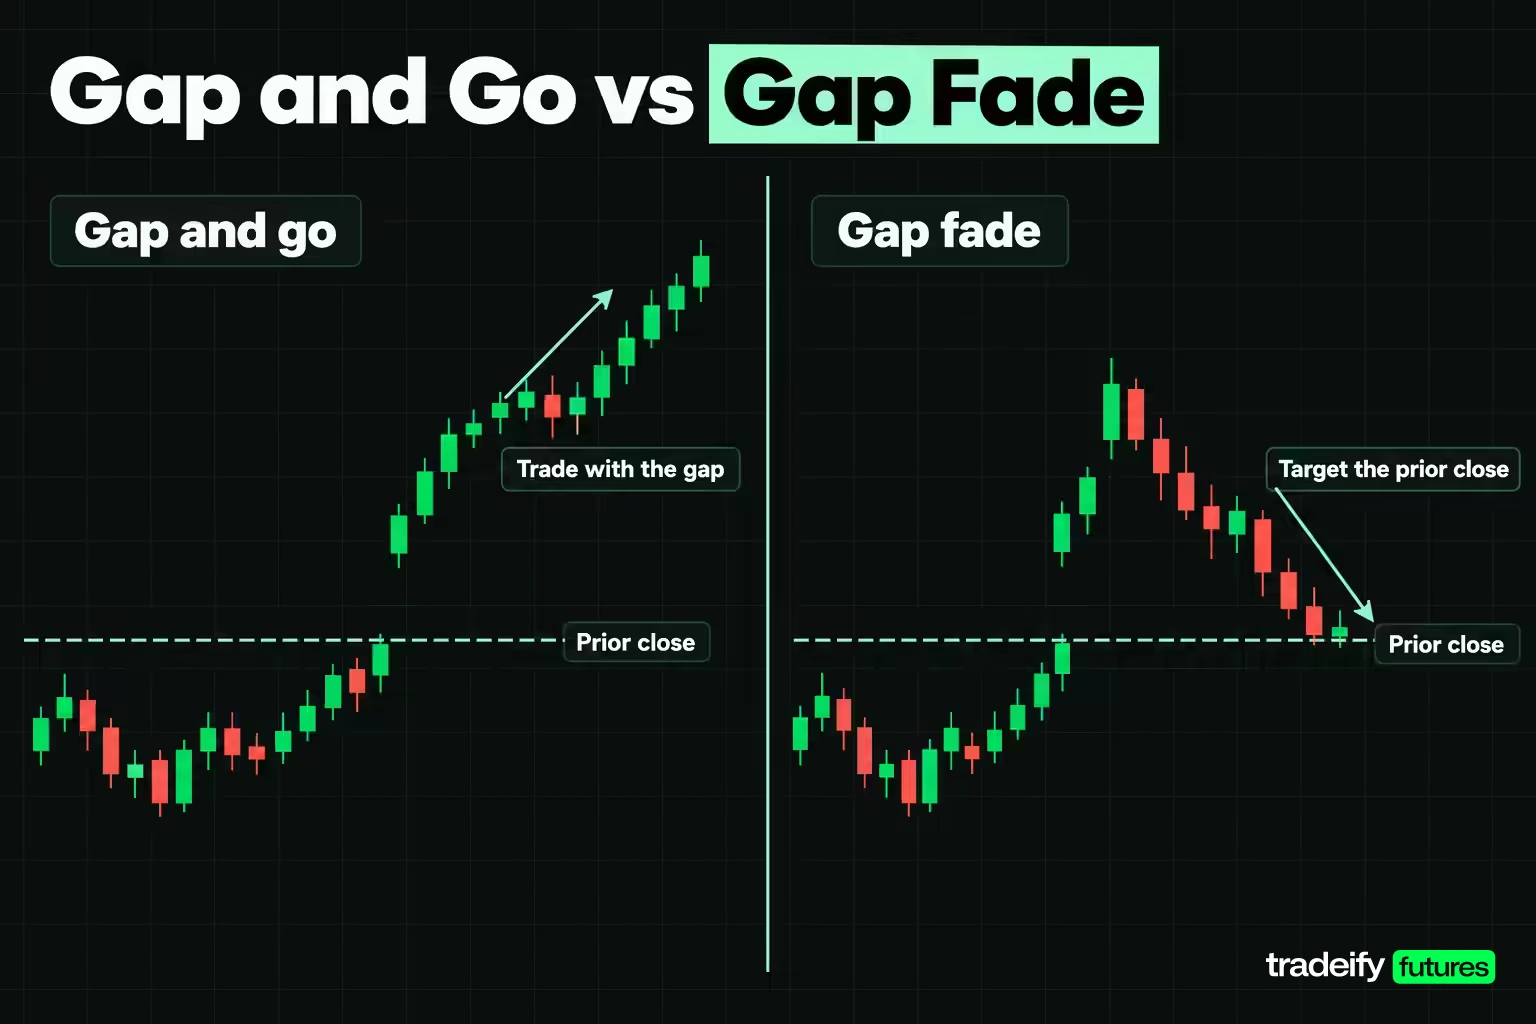
Gap trading strategies fall into two families: trade with the gap or trade against it. Each has a common form and a clear failure mode.
Gap and Go
Gap and go means buying a gap up (or selling a gap down) at or shortly after the open, expecting continuation. It suits full gaps on heavy relative volume with a real catalyst. Many traders wait for the first pullback or the break of the first few minutes' high instead of buying the very first print. Its weakness is a gap that opens strong and stalls. There is no nearby fill level to aim for, and the reversal back into the prior range tends to be fast because everyone who chased the open is now trapped.
Gap Fade and Gap Fill
A gap fade takes the other side, selling a gap up or buying a gap down and targeting the prior close. It suits partial gaps, common gaps inside a range, and gaps on light volume without a clear catalyst. Its weakness is the breakaway gap, where the previous balance has stopped working and the fade keeps losing as the trend extends.
Opening Range Breakout on a Gap Day
An opening range strategy waits for the first 5, 15 or 30 minutes to set a high and low, then trades the break of one side. On a gap day it lets the market show which way it is leaning before you commit, at the cost of a worse entry than the open.
Trading Earnings Gaps in Individual Stocks
Earnings gaps are the largest single-stock gaps most traders see, and they are where gap trading in stocks gets most of its attention. Imagine a stock that closes at $100.00 after a prior-day high of $101.50, reports after the bell, and opens at $108.00. That is an $8.00 gap, 8.00% of the close, $6.50 above the prior high, and 3.33 times a 20-day ATR of $2.40 (all illustrative). A gap that size on a guidance change is a different trade from the same gap on a one-off beat, so read the release before you read the chart.
Some traders run gap rules through automated systems that scan pre-market prices and place orders at the open. Automation removes hesitation but not the core question: the rule still needs a tested edge and the same stop logic as a manual plan.
Related lesson: Gap trading strategies
A Worked Gap Trading Example on the E-mini S&P 500
This worked gap trading example uses illustrative round numbers so the arithmetic stays visible. It does not describe a real session.
The contract terms are published by CME. The E-mini S&P 500 (ES) pays $50 per index point, with a minimum tick of 0.25 points worth $12.50. The Micro E-mini S&P 500 (MES) is one tenth the size at $5 per point, with the same 0.25-point tick worth $1.25.
The setup: Thursday settles at 6,000.00. Friday trades between 6,000.00 and 6,060.00 and settles at 6,050.00, a 50.00-point advance. The daily ATR is 48.00 points. Globex reopens on Sunday at 6:00 PM ET and the first print is 6,086.00.
Measuring the Gap
| Measure | Value | How it is derived |
|---|---|---|
| Gap in index points | 36.00 | 6,086.00 minus 6,050.00 |
| Gap in ticks | 144 | 36.00 divided by 0.25 |
| Gap as percent of settle | 0.60% | 36.00 divided by 6,050.00 |
| Gap as a multiple of ATR | 0.75 | 36.00 divided by 48.00 |
| Gap in dollars per ES | $1,800 | 36.00 times $50 |
| Gap in dollars per MES | $180 | 36.00 times $5 |
| Distance above Friday high | 26.00 points | 6,086.00 minus 6,060.00 |
The open sits 26.00 points (0.43%) above Friday's 6,060.00 high, so this is a full gap up, not a partial one. It is also smaller than one day's average range, which keeps both a fill and a continuation plausible.
Pricing the Fade and the Continuation
| Plan | Entry | Stop | Target | Risk per ES | Reward per ES | Break-even win rate |
|---|---|---|---|---|---|---|
| Fade to the fill | Short 6,086.00 | 6,104.00 | 6,050.00 | $900 | $1,800 | 33.33% |
| Continuation | Long 6,086.00 | 6,068.00 | 6,122.00 | $900 | $1,800 | 33.33% |
| Continuation to measured move | Long 6,086.00 | 6,068.00 | 6,120.00 | $900 | $1,700 | 34.62% |
Both main plans risk half the gap (18.00 points) to make the whole gap (36.00 points), a 2 to 1 ratio. Each breaks even at 33.33% before costs. Add an illustrative $5 round-turn cost per ES and the fade's break-even rises to 33.52% ($905 divided by $2,700). On MES the same fade risks $90 per contract.
The half-gap stop has a logic of its own. A gap that retraces halfway and then continues has not filled, so the fade has failed by then.
The measured move projects Friday's 60.00-point range above the 6,060.00 high to 6,120.00. That is 34.00 points above the open, 1.89 to 1 against the 18.00-point risk, and just 2.00 points below the one-gap target. Two methods landing close together is not confirmation. Targets are levels you choose, not levels the market owes you.
One more check: if you normally risk half an ATR on this market, that is 24.00 points or $1,200 per ES. The 36.00-point gap is 1.50 times that stop, which is a signal to size down, not to widen the stop.
The table says what each plan pays and what it has to be right about. It does not say which one wins. That symmetry is the honest starting point at most opens, and it's why the choice between them should come from your written classification, not from the color of the first candle.
Related lesson: Tick size and tick value
Gap Trading Risk Management
Gap trading risk management comes down to three rules: size from the stop, keep the stop away from the crowd, and accept that a gap can jump your stop.
Size From the Stop, Not the Gap
Decide the dollar risk first, then divide by the stop distance. With an illustrative $500 risk budget on MES, an 18.00-point stop costs $90 per contract, so 5 contracts risks $450. A 9.00-point stop costs $45 per contract, so 11 contracts risks $495. Same budget, very different size. Trading the same size on every gap, whatever the stop, is how one bad open turns into a bad week.
Keep the Stop Away From the Fill Level
The prior close is the level every gap trader is watching. Research on currency orders by Carol Osler (Federal Reserve Bank of New York, published in the Journal of Finance in 2003) found take-profit orders cluster at round numbers while stop-loss orders cluster just beyond them, and that stop orders tend to speed a move once triggered. A stop placed just beyond an obvious level sits in that cluster. Defining the stop from the open, such as half the gap, keeps it off the most crowded price.
Gaps Can Move Past Stops
A stop order becomes a market order when triggered. If price jumps through it at the open, the fill comes at the next available price, which can be far worse. Limit conditions can stop trading entirely before your level. The defence is size: reduce the position before a known event rather than widening the stop after the open.
Finally, pick one plan per gap and keep it for a full sample. The urge to flip is strongest right after the first stop: you were wrong about the fade, so the continuation must be right. Fading the open, getting stopped, then chasing the other way leaves you with two untested plans instead of one tested one.
Related lesson: Stop-loss orders and placement
Gap Trading Limitations and Common Mistakes
Gap trading has real structural limits: no reliable fill rate, thin liquidity at the open, slippage on stops, and labels that only work in hindsight. Most losses around gaps still come from a short list of ordinary mistakes.
| Mistake | What it looks like | Why it costs | The fix |
|---|---|---|---|
| Naming the type at the open | Calling a gap a breakaway or exhaustion before the session trades | Both labels depend on what happens next | Record full or partial at the open; name the type in the debrief |
| Sizing from habit | Same size on a 36-point gap as on a 9-point gap | Dollar risk changes while size does not | Fix dollar risk first, then divide by the stop distance |
| Stopping on the fill level | Fade stop just beyond the prior close | That price is where everyone else is active | Place the stop from the open, such as half the gap |
| Treating the reopen like the cash open | Full size into a thin overnight print | Wider spreads make real risk larger than planned risk | Cut size or wait for deeper liquidity |
| Assuming the stop fills at its price | Stop resting just past a level before a data release | A gap can skip the stop price entirely | Reduce size before the event |
| Flipping plans on one gap | Fade, stop out, then chase the other way | Neither plan gets tested | One plan per gap for a full sample |
None of these needs a crash. A label applied too early, a stop on a popular price and a size picked from habit are enough to turn a reasonable read into a red day.
Preparing for a Gap Before the Open
Gap preparation happens before the open, because once the bell rings you are reacting, not deciding. A short routine:
- Scan. List the markets or stocks opening beyond their prior high or low, with gap size in points, percent and ATR.
- Check the catalyst. Earnings, a data release, a rating change, or nothing. A gap with no catalyst behaves differently from a gap on a guidance cut.
- Mark the levels. Prior high, low and close, plus the nearest larger-timeframe level in the gap's direction.
- Write both plans. Entry, stop, target and invalidation for the fade and for the continuation, before the bell.
- Log the result. Record the classification, the plan you chose and the outcome. Thirty entries will tell you more about your own gap trading than any general claim about fill rates.
On our accounts every position is closed by 4:45 PM ET and nothing is held overnight or over the weekend, so a Sunday reopen or a 9:30 AM ET gap is never something you sit through with a position on. It is an entry you can take or skip. News trading is allowed at your own risk, and the Help Center is clear that the daily loss limit is not a stop; a fast open can slip past it.
Related lesson: Multiple timeframe analysis
Gap Trading FAQ
Is gap trading profitable
Gap trading can be profitable for some traders and plans, but there is no universal answer. Long-run studies of US stock indexes disagree with the popular claim that gaps tend to fill, and results change by market and period. What you can measure is your plan's arithmetic: a 2 to 1 plan must win more than 33.33% of trades before costs.
What is gap up and gap down
A gap up is an open above the previous close; in the stricter version, above the previous session's high. A gap down is the mirror image. The strict version is more useful because anyone applying it gets the same answer.
What is a stock gap in trading
A stock gap is a jump between one session's close and the next session's open, usually after news released outside market hours. Earnings reports are the most common cause. The stock opens at a new price without trading the levels in between.
Can you make $200 per day in day trading
Some days a trader might, and many days they will lose instead. For scale, $200 is 4 points on one ES contract or 40 points on one MES contract. The useful question is what you risk each day to try for it.
What is the 3-5-7 rule in trading
The 3-5-7 rule is an informal risk heuristic, not a regulatory rule. A common version says risk no more than 3% on one trade, keep total open risk at or under 5%, and aim for winners at least 7% larger than losers. Versions differ, so treat it as a starting point.
Do gaps always fill
No, some fill within minutes, some weeks later and some never. Treat a fill as a hypothesis with a defined invalidation level, not a certainty.
Trading futures and other leveraged products carries a substantial risk of loss, and gaps can move price past a stop so losses exceed what you planned. Funded and evaluation accounts are simulated, every price in the worked example is illustrative, and this article is education, not investment advice.


