



TL;DR: The accumulation distribution indicator weights each session's volume by where the close landed in that session's range. Read its slope, never its level, and treat a divergence as a question rather than a signal. Across 251 ES and NQ sessions, bearish divergences leaned lower and bullish ones failed more often than they worked. Three checks (price side, volume side, confirmation) decide whether a divergence deserves a trade plan.
ES is pressing a new high and the volume line under it is sliding. Do you tighten up, look for a short, or ignore it? That is the decision the accumulation distribution line is supposed to help with, and it only helps if you know exactly what it counts.
This guide builds the line from the formula, walks a real six-session calculation on E-mini S&P 500 futures, and then tests what its divergences were worth over a full year of ES and NQ data. The answer is less tidy than most explanations suggest, which is why the article ends with three checks instead of a buy and sell rule.
What the Accumulation Distribution Indicator Measures
The accumulation distribution indicator is a running total of volume, where each session's volume is scaled by how close the price finished to that session's high or low. A close near the high adds most of the session's volume to the line. A close near the low subtracts most of it. A close in the middle barely moves it.
Marc Chaikin developed the line to measure the cumulative flow of money into and out of a market, and he originally called it the Cumulative Money Flow Line. StockCharts' ChartSchool still describes it that way. TradingView notes that it sits in the same family as two of Chaikin's later tools, the Chaikin Oscillator and Chaikin Money Flow, which are both built on the same close-location idea.
That gives the line one narrow job. It answers a single question about each completed session: did buyers or sellers own the close, and how much volume stood behind it? It does not measure how far price traveled, it does not compare today's close with yesterday's, and it does not identify who was trading.
Who Created the Accumulation Distribution Line
The line comes from Marc Chaikin, whom TradingView describes as a famed stock analyst. His original name for it, the Cumulative Money Flow Line, explains the design better than the later one: it is a cumulative total of money flow. Chaikin then built two tools on top of it. ChartSchool describes the Chaikin Oscillator as the difference between the three-day and 10-day exponential moving averages of the A/D line, an indicator of an indicator. Chaikin Money Flow uses the same Money Flow Volume but sums it over a fixed look-back, typically 20 or 21 days, and divides by that period's volume instead of keeping a running total.
The idea it improved on is older. Joe Granville's On Balance Volume counts a session's whole volume as buying or selling depending only on whether the close was up or down. Chaikin's version asks where the close landed inside the session's range, so a session that closes slightly up but near its low counts as selling.
One naming trap is worth knowing before you open a platform. The thinkorswim study library has a study called Accumulation/Distribution that is a different indicator entirely. It was created by Domenico D'Errico to spot range compression by comparing the current high-low range (or average true range) with a past value of that range. If your numbers look nothing like the Chaikin formula, check which indicator your platform loaded.
Related lesson: What is volume
Accumulation Distribution Formula and Calculation
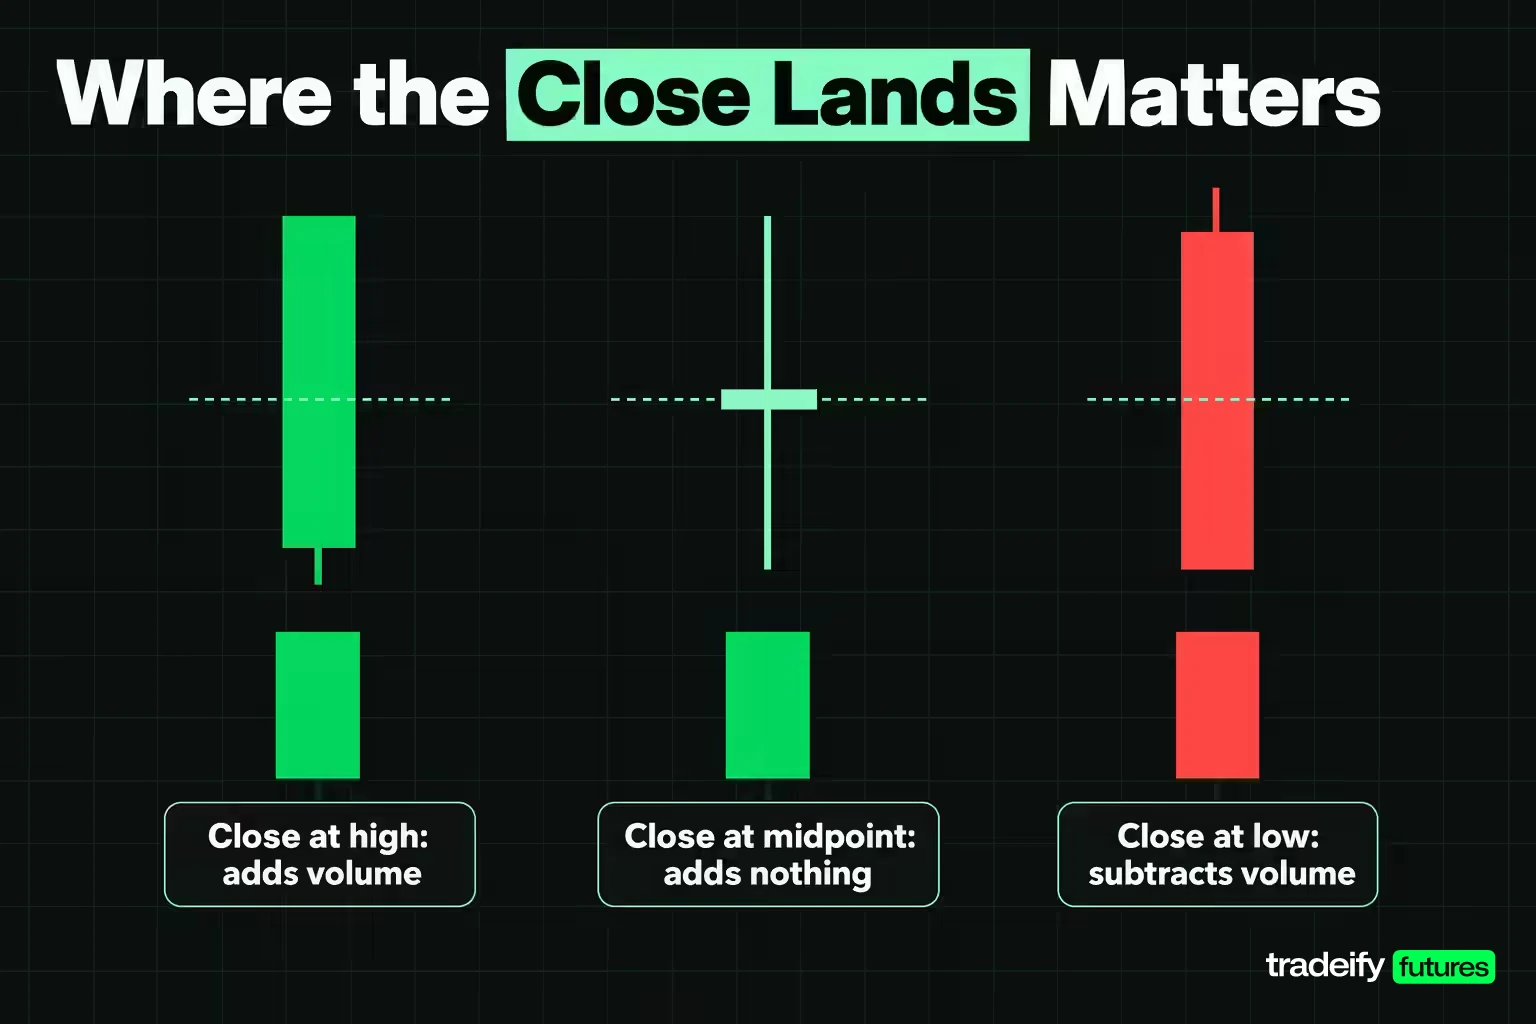
The accumulation distribution formula has three steps, and ChartSchool and TradingView publish it the same way:
- Money Flow Multiplier = ((Close minus Low) minus (High minus Close)) divided by (High minus Low)
- Money Flow Volume = Money Flow Multiplier times the session's volume
- A/D line = previous A/D value plus the current session's Money Flow Volume
The multiplier always sits between +1 and -1. It is +1 when the close prints on the session high, -1 when it prints on the low, and 0 when it lands exactly on the midpoint. At 0.50, only half of the session's volume reaches the line. So the multiplier acts as a volume filter: a heavy session with a decisive close moves the line far more than a heavy session that closes in the middle.
There is no length or period setting in the standard version. The only choices are which price series and which volume feed you give it, and where you start the running total.
A Six Session ES Accumulation Distribution Calculation
The table uses Yahoo Finance's continuous daily E-mini S&P 500 (ES) series for the six completed sessions ending November 3, 2026. The running total was started at zero on the November 3, 2025 close, so 24,152,769 contracts carried into October 27, 2026. Yahoo's daily close is the last traded price, which can differ slightly from the official CME settlement.
| Session | High | Low | Close | Volume | Multiplier | Money flow | A/D after |
|---|---|---|---|---|---|---|---|
| Oct 27, 2026 | 7772.75 | 7699.75 | 7758.25 | 1,556,188 | 0.6027 | 937,976 | 25,090,745 |
| Oct 28, 2026 | 7819.50 | 7750.25 | 7783.25 | 1,576,563 | -0.0469 | -73,990 | 25,016,755 |
| Oct 29, 2026 | 7773.75 | 7709.50 | 7754.25 | 1,998,904 | 0.3930 | 785,561 | 25,802,316 |
| Oct 30, 2026 | 7713.00 | 7558.25 | 7614.00 | 2,539,896 | -0.2795 | -709,858 | 25,092,459 |
| Nov 2, 2026 | 7693.75 | 7570.75 | 7574.50 | 2,002,583 | -0.9390 | -1,880,474 | 23,211,984 |
| Nov 3, 2026 | 7623.75 | 7546.00 | 7596.75 | 1,645,013 | 0.3055 | 502,496 | 23,714,480 |
Checking the ES Accumulation Distribution Math by Hand
The October 30, 2026 ES session is a good row to check by hand, using this study's Yahoo Finance bars. The range is 7713.00 minus 7558.25, or 154.75 points. The close at 7614.00 sits 55.75 points above the low and 99.00 points below the high. The multiplier is (55.75 minus 99.00) divided by 154.75, which is -0.2795. Multiply by 2,539,896 contracts and you get -709,858, and 25,802,316 minus 709,858 leaves 25,092,459. The table rounds the multiplier to four decimals and the money flow to whole contracts, so a calculator lands within a contract or two.
November 2 shows the formula at its most forceful. The close finished 3.75 points off the low on 2,002,583 contracts, so 94% of the session's volume went into the line as selling. November 3 then closed above its midpoint and won back only about a quarter of that.
Over the six sessions the line fell a net 438,289 contracts, while the six money flow figures added up to 4,890,356 contracts in absolute terms. Divide the first by the second and you get a net to gross ratio of -8.96%. That ratio says most of the week's flow cancelled out, and it is a quick way to tell a meaningful move in the line from a trivial one.
How Volume Drives the Accumulation Distribution Line
Volume is what gives the accumulation distribution line its size, and the multiplier decides how much of that volume counts. Over the 251 completed ES sessions from November 4, 2025 to November 3, 2026, the absolute money flow added up to 50.16% of all the volume traded. On NQ, the E-mini Nasdaq-100, it was 50.61%. In plain terms, about half of each year's volume made it into the line and half was discounted because closes landed away from the extremes.
That discount is the point of the design. A session that trades heavily but closes in the middle of its range is a session where buyers and sellers fought to a draw, and the line treats it that way. On Balance Volume, by contrast, would count the whole session in one direction.
The heaviest ES session in the sample shows the opposite case. On November 20, 2025, ES traded 2,987,357 contracts, roughly double the median session of 1,491,899, and closed at 6557.50 against a low of 6550.50. The multiplier was -0.9418, so 2,813,637 contracts went into the line as selling in a single day. That session set the year's low for the ES line at -3,594,135.
Three practical readings follow from that:
- High volume and a decisive close move the line the most. These are the sessions that change its slope.
- High volume and a middling close barely move it. Do not read a quiet line as a quiet market; it can mean the volume cancelled.
- Low volume and a decisive close move it a little. A week of these can drift the line without much real participation behind it.
The volume feed matters too. ChartSchool notes that daily volume is incomplete during the session, so scans built on volume indicators should use the last completed close. A reading taken at midday will change by the close.
Buying and Selling Pressure in Futures and Forex
Buying pressure, in accumulation distribution terms, means closes finishing in the upper half of their range on meaningful volume. Selling pressure means closes finishing in the lower half. The line is the tally of which side won the close, session after session, weighted by how many contracts traded.
On ES over the 251-session sample, 137 sessions closed in the upper half of their range and 114 in the lower half, while 128 sessions closed higher than the session before. Those two counts are not the same thing. A session can close up on the day and still finish in the lower half of its own range, which the line records as selling pressure. On NQ the split was 145 upper-half closes to 106 lower-half closes.
Forex is where the idea gets shaky. Spot currency trading is an over-the-counter market, which the Bank for International Settlements surveys as OTC foreign exchange turnover (it put global FX trading at $9.6 trillion per day in April 2025). There is no single consolidated volume number for a spot pair, so many forex charts substitute tick volume, which counts price changes rather than traded size. Chase describes tick volume as a surrogate for trade volume. An A/D line built on tick volume measures how busy quotes were, not how many units changed hands.
Currency futures avoid that problem because they trade on an exchange with reported volume. A CME Euro FX contract (6E) covers 125,000 euros, and its daily volume is a real contract count. If you want to read buying and selling pressure in currencies with this indicator, the futures series gives the formula the input it was designed for.
Accumulation vs Distribution Phases
Accumulation is a period when buyers absorb supply, often while price holds in a range, before a move higher. Distribution is the reverse: sellers hand supply to buyers, often near a top, before a move lower. The accumulation distribution indicator borrows these words, but it measures sessions, not intentions.
The phases come from older market theory. ChartSchool's tutorial on Richard Wyckoff describes a price cycle in which large interests prepare a markup through accumulation and prepare a markdown through distribution. That gives the four stages traders usually quote for a market cycle:
| Stage | What price tends to do | What the A/D line would show if the theory holds |
|---|---|---|
| Accumulation | Ranges after a decline | Rising or flat while price goes nowhere |
| Markup | Trends higher | Rising with price |
| Distribution | Ranges after an advance | Falling or flat while price holds up |
| Markdown | Trends lower | Falling with price |
The right-hand column is the hope, not a guarantee. Fidelity's guidance puts it carefully: a rising line during a trading range means accumulation may be taking place and is a warning of an upward breakout, and a falling line in a range is a warning of a downward one. A warning is an observation. It still needs price to confirm it.
The line also cannot tell you who did the buying. A close in the upper half of a range on big volume looks identical whether it came from one large fund or ten thousand small traders. Treat phrases like "smart money is accumulating" as a story you are telling about the line, then go looking for evidence on the price chart.
How to Read an Accumulation Distribution Chart
Reading an accumulation distribution chart starts with ignoring the number on the axis. Fidelity says it directly: the actual value is unimportant, so concentrate on direction. The level depends entirely on where the running total started. On ES, starting the line in November 2025 put its low at -3,594,135, below zero, even though ES rose 10.37% across the sample. The negative number meant nothing about the market.
Four readings cover most of what the line can tell you:
- Confirmation. Price and the line both make higher peaks and higher troughs, or both make lower ones. Fidelity describes this as a trend likely to continue.
- Range warning. Price moves sideways while the line climbs or falls. That points to which side has been winning the closes inside the range.
- Bearish divergence. Price makes a higher high while the line makes a lower high. Fidelity calls it a negative divergence and says the up trend is likely to stall or fail.
- Bullish divergence. Price makes a lower low while the line makes a higher low, a positive divergence.
Two habits make those readings cleaner. Put the line on the same timeframe you trade from, because a daily line and a 5-minute line can say opposite things. And compare the line with its own recent swings, not with another instrument's line, since volume levels differ between markets.
ChartSchool adds the caveat that keeps the reading honest: the line is two steps removed from price (a derivative of price and volume), its multiplier ignores session-to-session changes, and sometimes it simply does not work. That is why the divergence readings above are prompts to look closer rather than orders.
Highs and Lows on the A/D Line
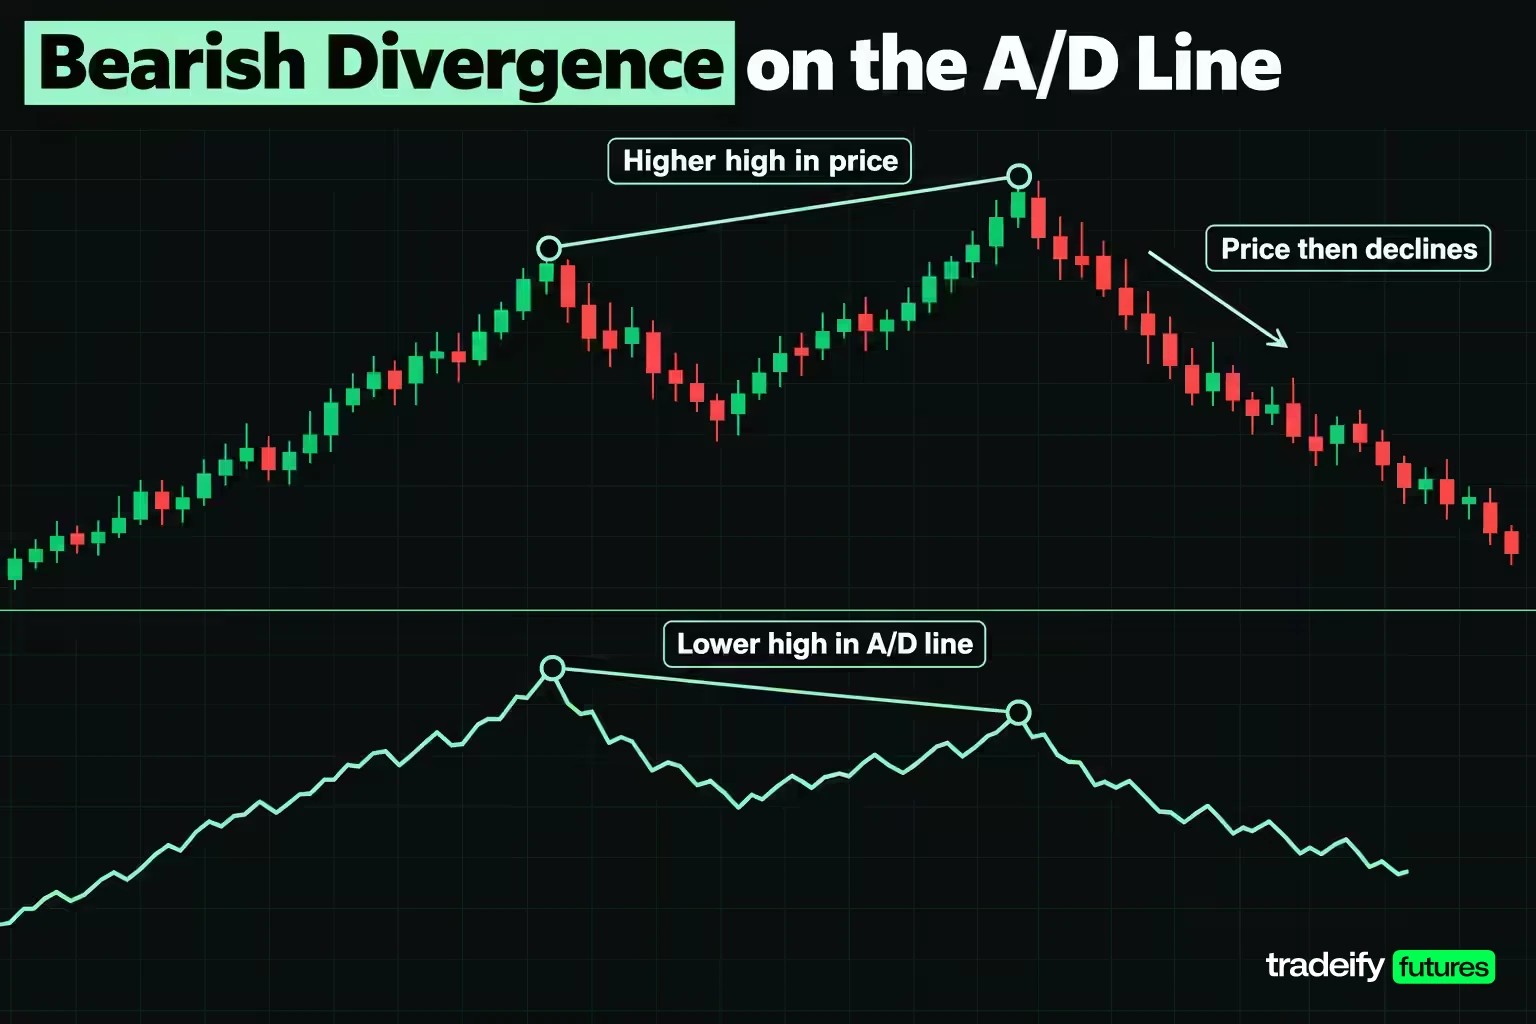
Swing highs and lows are where the accumulation distribution line is most often compared with price, and the year of ES data gives two clear examples running in opposite directions.
At the top, the ES line peaked on August 4, 2026 at 30,543,233 with ES at 7765.50. Price went on to a higher closing high of 7874.00 on October 6, 2026, a 1.40% gain, but the line stood at 24,626,400 that day, 5,916,833 contracts below its August peak. That is a textbook higher high in price against a lower high in the line. ES then fell 3.52% to 7596.75 by November 3.
At the bottom, ES closed at 6557.50 on November 20, 2025, the day the line made its low. Price then made a lower low of 6388.25 on March 30, 2026, 2.58% below the November close, while the line stood 4,768,005 contracts higher than its November low. That is a lower low in price against a higher low in the line, and ES rallied 23.26% from that March close to the October high.
The NQ Counterexample and the Roll Caveat
NQ, measured from the same Yahoo Finance daily data, is the counterexample for A/D line highs. Its closing high also came on October 6, 2026 (31483.25), and its line peaked a day later on October 7. No divergence, full confirmation. NQ still fell 10.09% to 28305.75 by November 3. A confirming line is not protection against a decline; it only says the decline did not show up in the closes beforehand.
The temptation with the October 2026 ES divergence is to call it a clean sell signal in hindsight. It took two months to form, and a short taken at the August 4 close would have sat through the 1.40% climb to the October close before it paid. Two cautions apply to both ES swing examples (the August to October top and the November to March bottom). First, the gaps between those swings run for months, which is far longer than most traders' holding period. Second, the series is a continuous contract, so some of the price difference between August and October comes from the September roll into the December contract, which trades at a different price. The line itself is immune to that splice because it only looks inside each session. Price is not.
Related lesson: Market structure highs lows and trends
Using the Accumulation Distribution Indicator in Technical Analysis
The accumulation distribution indicator belongs to the volume family of technical indicators. Most education sources group indicators into four families (trend, momentum, volatility and volume), and Britannica adds a fifth group for support and resistance tools. The family matters because it tells you what question the tool answers. A volume tool tells you about participation behind price, not the direction of the trend or the size of the next move.
That makes the line a second opinion, not a first one. ChartSchool says plainly that it is not a standalone indicator and should be used with price and trend analysis, momentum oscillators and chart patterns. In practice that means a simple order of work:
- Decide the trend and the levels from price first.
- Check whether the A/D line agrees with that read.
- Only when it disagrees, check whether the price side and the volume side of that disagreement are real, then wait for price to confirm before changing anything.
The line is built from completed sessions, so it lags in the strict sense: nothing prints until the close that produces it. Its supporters argue that the character of closes can shift before price direction does, which is the whole case for divergences. Treat that as a hypothesis to test on your own market. In this guide's own measurement of a year of ES and NQ daily bars, it held for bearish divergences more than for bullish ones.
Divergence Results on a Year of ES and NQ
Divergence is the reason most traders open the accumulation distribution line, so this study measured what followed one. It is an illustrative study, not a backtest of a trading system.
Method. Daily bars for ES and NQ from Yahoo Finance's continuous front-month series, 251 completed sessions from November 4, 2025 to November 3, 2026, with the line started at zero on the November 3, 2025 close. The November 4, 2026 bar was excluded because its volume repeated the prior session's figure exactly. For every session, the 20-session change in price was compared with the 20-session change in the line. Same direction counts as agreement; price up with the line down is a bearish divergence; price down with the line up is a bullish divergence. The outcome is the close 10 sessions later. That leaves 221 scored windows per contract.
| 20-session reading | ES windows | ES episodes | ES mean next 10 sessions | ES closed lower | NQ windows | NQ episodes | NQ mean next 10 sessions | NQ closed lower |
|---|---|---|---|---|---|---|---|---|
| Line agrees with price | 138 | 20 | +1.10% | 35.5% | 154 | 21 | +1.25% | 42.2% |
| Bearish divergence | 33 | 11 | -0.04% | 57.6% | 19 | 7 | -0.66% | 63.2% |
| Bullish divergence | 50 | 9 | -0.58% | 60.0% | 48 | 14 | -0.63% | 60.4% |
| All windows | 221 | n/a | +0.55% | 44.3% | 221 | n/a | +0.68% | 48.0% |
Reading the Divergence Results Against the Baseline
In this study's own calculation on Yahoo Finance ES and NQ bars, read every row of the divergence table against the All windows row. In this rising year, ES closed lower 10 sessions later 44.3% of the time for no particular reason, and NQ 48.0%. After a bearish divergence that rose to 57.6% on ES and 63.2% on NQ, so the bearish reading did carry a tilt toward lower prices.
In the same study, the bullish divergence did not carry a tilt toward higher prices. It was followed by lower closes 60.0% of the time on ES and 60.4% on NQ. In this sample, a line rising while price fell mostly meant price kept falling for a while. If you had bought every bullish divergence, the line would have had you fighting the tape. That is the real lesson of the row: a line that looks like accumulation is not a reason to catch a falling market.
Count episodes, not windows. Consecutive days of the same divergence are one event seen many times. The 33 ES bearish windows came from 11 separate episodes, and 16 of them fell in August 2026 alone. The 50 ES bullish windows came from only 9 episodes. With samples this small, a single stretch of market can make a row look stronger or weaker than it is.
How the Contract Roll Distorted ES Divergences
Futures add a problem that stock charts do not have. A continuous series switches contract months four times a year, and the new contract trades at a different price. Over a 20-session window that spans a roll, part of the price change is the splice, not the market. The A/D line ignores it because it only compares each close with its own session's range.
In this study's ES data, 14 of the 33 bearish windows spanned a roll session, and only 5 of those 14 were followed by a lower close, with a mean of +0.58%. The 19 that did not span a roll were followed by a lower close 14 times, with a mean of -0.50%. On NQ the split was 4 roll windows (2 lower) and 15 without a roll (10 lower). Small numbers again, but the direction is the useful lesson: on a continuous futures chart, check for a roll before you trust the price side of a divergence.
Related lesson: Futures rollover
Three Accumulation Distribution Checks Before a Trade
The accumulation distribution line gives you an observation, and an observation is not an entry. These three checks turn it into a decision, or into a decision to do nothing, which is often the right result. Each one exists because of a specific way the line misled in the ES and NQ data.
Check 1 Is the Price Side Real
Before reading a divergence, confirm that price really did what you think it did. Two things fake it. A contract roll on a continuous chart can add a step to price that no single contract traded. And a gap can make a session red on the day while the close still sat in the upper half of its range, which the line records as buying.
On ES, 25 of the 251 sessions closed lower than the session before while the A/D line rose, and 16 closed higher while it fell. On NQ the counts were 27 and 15. Eight ES sessions opened below the prior session's low and still closed in the upper half of their own range. If your divergence window contains a roll or a cluster of sessions like these, look at the individual contract chart before going further.
Check 2 Is the Volume Side Real
A divergence test usually asks only whether the line went down. Ask how far it went relative to the volume that traded. The net to gross ratio does that: the window's net change in the line divided by the sum of the absolute money flow inside the window.
In this study's ES data (Yahoo Finance daily bars, own calculation), the bearish windows ranged from -0.56% to -36.36%, with a median of -6.57%. At -0.56%, almost every contract of flow cancelled and the line slipped by a rounding error. At -36.36% (the window ending August 31, 2026), a third of the flow survived as selling, and ES closed 1.43% lower 10 sessions later. Stronger ratios did not sort outcomes cleanly in this sample: ES bearish windows at -10% or stronger closed lower 63.6% of the time against 54.5% for weaker ones, while NQ showed the reverse. So use the ratio to throw out trivial divergences, not to rank the strong ones.
A second volume opinion helps here. Compute On Balance Volume over the same window. In this study's 231 rolling 20-session windows, OBV and the A/D line pointed in opposite directions 101 times on ES (43.72%) and 64 times on NQ (27.71%). When both volume lines disagree with price, the reading is stronger than when only one does.
The April 8, 2026 ES window shows why this check matters. Price rose 0.54% over 20 sessions while the line slipped, a valid bearish divergence on the yes-or-no test. Its net to gross ratio was -1.25%, and ES rallied 5.09% over the next 10 sessions.
Check 3 Has Price Confirmed and Where Is the Invalidation
A divergence does not tell you when. ChartSchool's own bullish example waited for a price catalyst (a gap up on big volume) before treating accumulation as actionable, and that discipline matters even more given that, in this study's year of ES and NQ data, bullish divergences were followed by lower closes about 60% of the time.
So write two levels before you act. The confirmation level is the price behavior that would turn the observation into a setup, such as a break of the range low for a bearish read. The invalidation level is the price that says the read was wrong, such as a new closing high after the divergence. Size the position from the distance to invalidation, and if no level makes sense, the divergence stays a note in your journal.
Related lesson: Trade setups and confirmation
Accumulation Distribution Line vs OBV
The accumulation distribution line and On Balance Volume are both cumulative volume indicators, but they ask different questions. OBV, developed by Joe Granville, adds a session's full volume when the close is up on the previous close and subtracts it when the close is down. The A/D line ignores the previous close and looks only at where the close sat inside the session's own range.
| Feature | Accumulation distribution line | On Balance Volume |
|---|---|---|
| What decides the sign | Close location inside the session's range | Close versus the previous close |
| Share of volume counted | Scaled by the multiplier, from 0 to all of it | All of it, every session |
| Gap sessions | Can rise on a gap-down day that recovers | Falls on any lower close |
| Continuous futures roll | Unaffected by the splice | Roll step can flip a session's sign |
| Typical use | Pressure inside sessions, divergences | Participation behind closes, breakouts |
ChartSchool's example is the cleanest illustration: a stock gapped down and closed near the top of its range, so OBV fell sharply while the A/D line rose. Neither was wrong. They answered different questions.
In this study's year of ES and NQ data, the two lines disagreed over a 20-session window in 43.72% of ES windows and 27.71% of NQ windows. That is far too often to treat them as interchangeable. Pick one as your primary reading and use the other as a disagreement check.
Related lesson: On-balance volume obv
Accumulation Distribution Line Limitations
The accumulation distribution line has structural weaknesses that no setting fixes, so it helps to name them before you rely on it.
| Limitation | What it looks like on a chart | What to do instead |
|---|---|---|
| Gap blindness | Line rising on a session that closed red | Compare with OBV over the same window |
| Level confusion | Treating a high or negative value as meaningful | Read slope and swings only |
| Roll splice on continuous futures | Price side of a divergence created by a contract switch | Check the single-contract chart |
| Window counting | 33 divergence windows described as 33 events | Count separate episodes |
| Unfinished volume | A midday reading that changes by the close | Read it on the last completed session |
| No trend or timing | A divergence that runs for weeks | Wait for price confirmation |
| Proxy volume | Tick volume on spot forex charts | Use exchange-traded futures volume |
TradingView sums up the core weakness: the multiplier does not account for the change in price range between periods, so gaps leave the line out of sync with price. In the ES year that showed up in 25 sessions where the close fell and the line rose.
The line also says nothing about risk. It cannot set a stop, choose a size or tell you whether a setup is worth taking. Those decisions come from the plan, and the indicator should never be the reason you widen a stop or add to a loser.
Related lesson: Position sizing
Fitting the A/D Line Into a Futures Routine
The accumulation distribution line is most useful as a small, repeatable step rather than a screen you watch all day.
- After the close. Note the session's multiplier and whether it was a heavy session. One line in a journal, not a trade.
- Once a week. Compare the 20-session change in price and the line, write down the net to gross ratio, and note whether OBV agrees and whether the window spans a roll.
- When a divergence passes the first two checks. Mark the confirmation and invalidation levels, then wait for price.
- When the line agrees with price. Do nothing. In this study's ES data, agreement was the normal state in 138 of 221 windows.
- When your plan already qualifies a setup. The line does not get a veto it has not earned in your own testing.
That last point matters for discipline. If adding an indicator makes you hesitate on setups your plan already accepts, it is costing you more than it is giving you.
On our accounts every position is closed by 4:45 PM ET and nothing is held overnight, so a daily A/D reading is context for the next session, never a reason to carry a trade. If you chart it in TradingView, that works through the Tradovate connection only, and a free TradingView plan updates data about every 5 seconds, so volume-based readings are best taken on a completed bar.
Related lesson: How to keep a trading journal
Accumulation Distribution Indicator FAQ
What is accumulation in trading?
Accumulation is a period when buyers steadily absorb supply, often while price moves sideways after a decline. On the accumulation distribution line it would show as a rising or flat line while price goes nowhere. The line can suggest it, but it cannot prove who was buying.
What are the four types of indicators?
The four families most guides use are trend, momentum, volatility and volume indicators. The accumulation distribution line is a volume indicator, alongside OBV and Chaikin Money Flow. Some sources add a fifth group for support and resistance tools.
What is the 3-5-7 rule in trading?
The 3-5-7 rule caps risk at 3% of the account per trade and 5% across all open positions, and aims for winners at least 7% larger than losers. It is an informal guideline described by sites such as DayTrading.com, not a regulation. Versions differ, so treat it as one framework rather than a standard.
What are the four stages of a stock cycle?
The usual four stages are accumulation, markup, distribution and markdown, drawn from Richard Wyckoff's price cycle. Price ranges, trends up, ranges again near the top, then trends down. The same cycle language is applied to futures and other markets.
Is the accumulation distribution indicator leading or lagging?
It is built only from completed sessions, so it lags in the strict sense. Its supporters argue that closes can weaken or strengthen before price turns, which is the case for divergences. In a year of ES and NQ data, that held for bearish divergences more than for bullish ones.
What is the best setting for the accumulation distribution indicator?
There is no best setting, because the standard accumulation distribution line has no period to tune. The real choice is the window you compare against price; in this guide's ES study a 10-session window produced 22 bearish divergence windows, 20 sessions produced 33 and 40 sessions produced 42. Pick one window, keep it fixed and record what follows.
Can the accumulation distribution indicator be used on futures?
Yes, because futures have exchange-reported volume and a clear high, low and close for each session. The two cautions are that a continuous contract chart can create price steps at the roll and that a session still trading has incomplete volume.
This article is educational and is not investment advice or a recommendation to trade any instrument. Futures are leveraged, losses can exceed what you expected to risk, and an indicator that worked over one year of data may not work in the next. Evaluation and funded accounts are simulated trading accounts, and results in them do not predict results in a live account.


