



TL;DR: A trade setup is a written set of conditions, a trigger, an invalidation and an exit, decided before price gets there. Confirmation is the rule that says the trigger has fired, and it costs entry distance. On 49 ES and NQ sessions, one close beyond the level turned a losing breakout entry slightly positive at a 1R target. On 34 newer sessions the same rule did not hold up, which is why every setup needs its own out-of-sample test.
A trade setup is the difference between taking a trade and reacting to one. It tells you, before the market gets there, what has to be true, what makes you act, where you are wrong and where you get out. Most traders can describe their trade setup in a sentence. Far fewer can say what their confirmation rule costs them in entry price, or whether it still works on data they did not build it on.
That second question matters more than it sounds. Waiting for proof feels safer, and after a few breakouts reverse on you it is tempting to demand more and more of it. Every extra bar of proof has a price, though, and you pay it at the moment of entry.
This guide covers both halves. The first half is the foundation: what a setup is, how to build and identify one, the main setup types and the market context each needs. The second half measures one question most setup guides skip: does waiting for confirmation actually help, and what does it charge you for the privilege?
What a trade setup is
A trade setup is a written description of the conditions that have to be true before you are allowed to act. A complete setup answers four questions.
- Context. What has to be happening in the market (trend, range, time of day, volatility) for this trade to make sense.
- Trigger. The exact event that turns "this looks interesting" into an order, including any confirmation rule.
- Invalidation. The price or event that proves the idea wrong, which is where the stop belongs.
- Exit. The target, the time limit or the management rule that ends the trade when it works.
The test is simple. If a competent stranger could read your trade setup and take the same trades you take, it is a setup. If the stranger would need to ask "how far?", "which close?" or "what if it gaps?", it is still an opinion.
Trade setup versus pattern, signal and strategy
A chart pattern is not a trade setup. A double bottom or a bull flag describes shape; a setup adds the trigger, the stop and the exit that make the shape tradable. A signal is narrower than a setup: it is the trigger alone, the moment the setup fires. A strategy is wider: it wraps one or more setups in a sizing rule, a daily loss limit, a maximum number of positions and the conditions under which you stop trading a setup.
Confirmation sits inside the trigger. It is the part of a trade setup that decides how much proof you need before you commit, and it is the part traders most often leave vague.
Related lesson: Entry and exit strategies
How to build a trade setup step by step

Building a trade setup means writing each part down before the session, in words specific enough to score later. A workable order looks like this.
- Pick the market and the session. One instrument and one time window. "ES, 10:00 AM to 12:00 PM ET" is a setup scope; "index futures, whenever" is not.
- Write the context filter. The condition under which the setup is allowed at all, such as price above the prior day's high, a range of a given width, or no scheduled release in the next 30 minutes.
- Define the level. The price the setup is built around: an opening range high, a prior swing low, a pullback to a moving average. It should be identifiable before price reaches it.
- Write the trigger and the confirmation rule. What happens at the level that makes you enter, and how much proof you demand: a touch, one close beyond, two closes, or a retest.
- Set the invalidation and the stop. Where the idea is wrong, plus a buffer for normal noise. The stop belongs at invalidation, not at a dollar amount you would like to lose.
- Set the exit. A target in multiples of risk (R), a time stop, or a trailing rule. Write which one comes first if two conflict.
- Size it in dollars. Convert the stop distance into dollars per contract and choose the contract count from your per-trade risk cap.
A worked ES trade setup example
The prices here are round and illustrative. Suppose your trade setup is a long breakout above a morning range high at 5,000.00 on the E-mini S&P 500 (ES), where one point is worth $50 per contract.
- Anticipation entry at 5,000.00 with the stop at 4,996.00 is a 4-point stop, or $200 per ES contract ($20 per Micro E-mini S&P 500 contract, which is worth $5 per point). A 2R target sits at 5,008.00.
- One-close entry. If the confirming bar closes at 5,002.00, the stop is still at 4,996.00, because invalidation did not move. The stop distance is now 6 points, or $300 per ES contract, and a 2R target moves out to 5,014.00.
Nothing about the market changed between those two versions. Only the entry rule did, and it made the same idea 50% more expensive per contract and pushed the target 6 points further away. Neither version is wrong. They are two different trades, and you should know which one you are taking before the bar closes.
Types of trading setups
Trading setups fall into a handful of families. Each family needs a different market, uses a different trigger and fails in a different way, so knowing which family a setup belongs to tells you most of what can go wrong with it.
| Setup family | Market it needs | Typical trigger | How it usually fails |
|---|---|---|---|
| Breakout | Compression near a clear level, rising participation | Trade or close beyond a range high or low | Price pokes through, stalls and closes back inside |
| Pullback | An established trend | Bounce from a prior level or moving average in the trend direction | The pullback keeps going and becomes a reversal |
| Reversal or failed break | An overextended move into a known level | Break beyond the level, then a close back inside | The trend resumes and runs through the stop |
| Range | Sideways, two-sided trade with tested edges | Rejection at the range high or low | The range finally breaks in the direction you faded |
| Momentum continuation | Strong directional session, often news-driven | Shallow pause and resumption in the move | Exhaustion; the late entry buys the top of the move |
Choosing a setup family that fits you
No setup family is best in general. A breakout setup tends to produce fewer, larger winners and many small stop-outs, which some traders cannot sit through. A range setup tends to produce frequent small wins and an occasional large loss when the range breaks. Choose the family whose failure mode you can execute through calmly, then test it, because the setup you abandon after five losses has a measured edge of zero for you.
Related lesson: Opening range breakout
How to identify a valid trade setup
Identifying a valid trade setup is a matching exercise, not a search for a good feeling. A setup is present only when every written condition is true at the same moment. A checklist keeps that honest.
- Location. Is price at the level the setup is built around, or merely near it? A breakout setup three points away from its level is not a setup yet.
- Context. Is the context filter true right now, not earlier in the session?
- Invalidation. Can you name the stop price before you enter? If the stop has to be "somewhere below", the setup is not defined.
- Room. Is there enough distance to the target before the next obvious level? A 2R target sitting behind the prior day's high is a target in name only.
- Trigger status. Has the trigger actually fired, or are you anticipating it? Both can be valid, but they are different trades with different costs.
Observing a setup versus confirming it
The most common identification error is treating an observation as a confirmation. Price touching a range high is an observation. A five-minute close above it is a confirmation under a close rule. Reading the direction correctly does not mean you have an entry; those are two separate decisions, and a written setup keeps them separate.
When one checklist item is missing, the honest answer is no trade. Missing an entry does not make the next price a good entry. It makes it a different trade, and that trade needs its own setup.
Related lesson: Support and resistance
Market context for setups
Market context decides which trade setup family is worth trading today and whether any setup should be traded at all. The same breakout trigger behaves very differently in a trending session and in a choppy one.
- Trend versus range. Breakout and pullback setups need directional sessions. Range setups need two-sided trade. A quick read is whether the session is making higher highs and higher lows, or repeatedly reversing at the same prices.
- Volatility. A setup's stop buffer should scale with how far price normally moves. A fixed 2-point stop that sits outside the noise on a quiet day can sit inside it on a volatile one. Measures like the average true range (ATR) make the buffer adapt.
- Time of day. Index futures tend to trade most actively around the US cash open. Setups that work in the first two hours of the session can stall over the midday lull.
- Scheduled news. A setup triggered seconds before a major release is a different trade from the same setup triggered an hour later. Many traders write a "no new trades within X minutes of a release" rule into their context filter.
- Higher-timeframe location. A long breakout setup directly underneath the prior day's high has less room than the same setup in open space.
Context is also a reason to do nothing. If the session does not match any setup's context filter, sitting out is the setup working as designed, not a missed day.
Related lesson: Market structure highs, lows and trends
Setup confirmation and entry timing
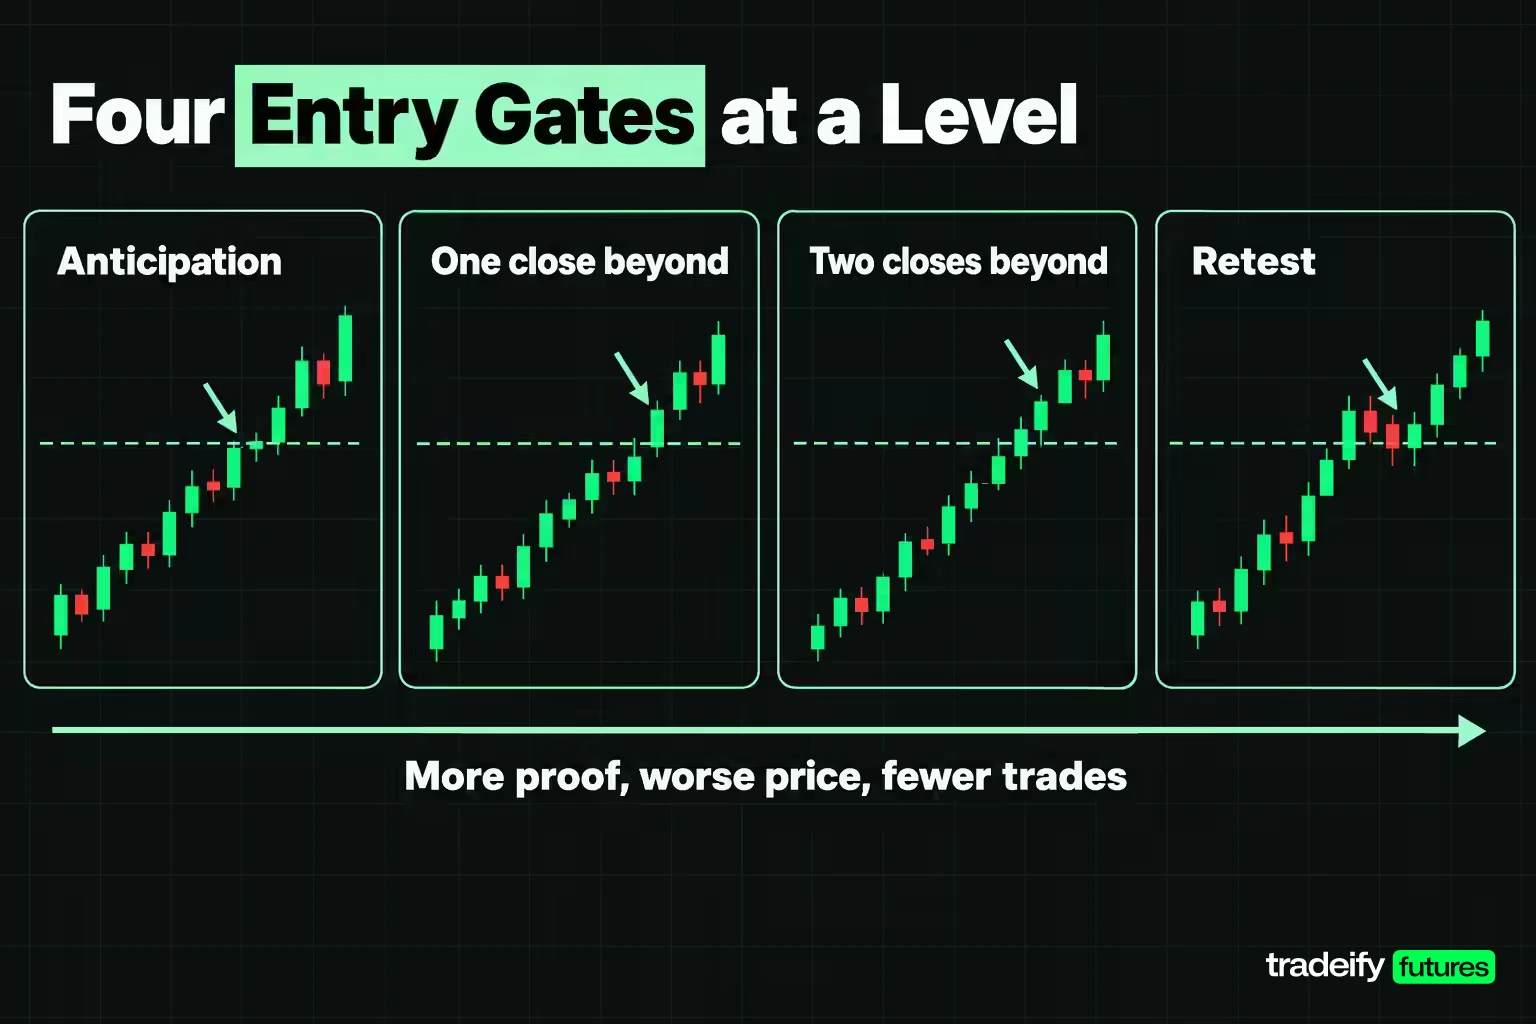
Setup confirmation is the rule that decides when the trigger has fired, and entry timing is the price that rule delivers. Traders usually choose between four entry gates at a level.
- Anticipation. Fill at the level itself, with no proof. Cheapest entry, tightest stop, and no protection from a break that fails immediately.
- One close beyond. Enter at the close of the first bar that closes beyond the level. It filters breaks that never hold, but the bar may close well past the level.
- Two closes beyond. Enter after two consecutive bars close beyond the level. Stronger proof, worse price, and some setups never qualify.
- Retest. Wait for the confirming close, then enter only if price returns to the level within a set number of bars. Good price when it fills, but many sessions never come back.
Each step up demands more proof and usually gives you a worse price, a wider stop for the same invalidation, and fewer trades. Whether the proof is worth the price is an empirical question, and it depends on the setup and the instrument.
How the setup confirmation study was run
To measure confirmation, the setup has to be mechanical enough that two people take identical trades. The study used an opening range break on continuous front-month ES and E-mini Nasdaq-100 (NQ) five-minute bars.
- Opening range. The first six five-minute bars of the session, 9:30 to 9:55 AM ET.
- Signal. The first trade at the opening range high or low after 10:00 AM ET. Whichever side traded first set the direction, one signal per session.
- Stop. A quarter of an ATR(14) beyond the level, using the 14 five-minute bars ending at 9:55 AM. The stop price was the same for every gate.
- Target and window. 1R, 2R and 3R targets, measured from each gate's own entry, with 24 five-minute bars (two hours) to resolve. Scoring starts from the bar after the fill, and a bar that touches both stop and target counts as a stop.
- Fair scoring. A gate that never fires is a no-trade and scores zero per signal rather than being dropped, so every gate is judged on the same signal set.
- Exclusions. No commissions, fees or slippage, and stops assumed to fill at their exact price.
In this measurement, the time cost of waiting turned out to be small. The median wait from the touch to the confirming close was one bar on ES and zero bars on NQ, because a breakout often closed beyond the level in the same bar that touched it. The cost of confirmation was distance, not delay.
What confirmation did to one setup across 49 sessions
The confirmation study covered 49 complete sessions between July 8 and September 16, 2026, built from 13,563 ES and 13,564 NQ five-minute bars. It produced 49 ES signals and 48 NQ signals. This table shows the average result per signal at a 1R target under each entry gate, with no-trades scored as zero.
| Entry gate | ES per signal at 1R | NQ per signal at 1R |
|---|---|---|
| Anticipation | -0.388R | -0.375R |
| One close | +0.061R | +0.125R |
| Two closes | +0.122R | +0.125R |
| Retest | -0.347R | -0.021R |
In this guide's own measurement, the anticipation entry lost roughly nine signals in ten to the stop over the two-hour window, with stop rates of 89.8% on ES and 91.7% on NQ. Waiting for one close cut that to 79.1% and 72.7%. Two closes scored best at 1R, but it only took 30 of 49 ES signals and 34 of 48 NQ signals, a take rate of 61.2% and 70.8%. The rest never printed a second close.
The ranking was not stable across targets. At 3R, the ES one-close gate fell from +0.061R to -0.061R per signal, because the entry cost ate the extra reward. At 2R, the NQ retest gate, which looked weak at 1R, was the best of the four at +0.354R.
The give-up cost of a confirmed entry
Give-up is the distance between the level a trade setup identified and the price a confirmed entry actually paid. In this guide's 49-session ES and NQ opening range study, on the one-close gate, the median ES entry gave up 2.75 points ($137.50 per contract), which was 1.52R measured against the original stop distance. The median NQ entry gave up 16.625 points ($332.50), or 1.31R.
The tail of the give-up distribution in this guide's study was worse. A quarter of one-close entries gave up more than 2.67R on ES and 1.94R on NQ, and the worst cases gave up 12.50 ES points and 81.00 NQ points. Median risk per contract rose from 1.71 points ($85.27) unconfirmed to 4.76 points ($237.95) on the ES one-close entry, and to $566.34 on the NQ one-close entry. Confirmation did not shrink risk. It moved the entry and made the same stop further away.
Signals that never confirmed
A confirmation rule also deletes trades. In this guide's 49-session opening range study, six of 49 ES signals and 4 of 48 NQ signals never closed beyond their level that session, and all 10 were full losses for the anticipation entry. That is the clearest thing a confirmation rule buys: it keeps you out of breaks that never hold.
Related lesson: Backtesting a trading strategy
Three ES sessions from the setup study
These three ES sessions come from the 49-session opening range breakout study measured for this guide (stop a quarter of an ATR beyond the opening range level, entries tested by anticipation, one close, two closes and retest), with times in Eastern Time and the standard $50 per point ES multiplier. They show why a single session can contradict the averages.
July 27, 2026, where confirmation cost 3.33R and still paid
The opening range on July 27, 2026 ran from 7473.75 to 7514.00, 40.25 points wide. The ATR(14) at 9:55 AM was 7.50, which put the stop 1.88 points beyond the level, or $93.75 per contract.
The short filled at 7473.75 on the 10:00 AM bar and was briefly in profit at 7469.75. The next bar traded up to 7478.50, through the 7475.62 stop. The anticipation entry lost 1R.
The 10:10 AM bar closed at 7467.50, 6.25 points beyond the level and 3.33R of give-up against the 1.88-point stop. From that entry, with its own 8.13-point stop distance, the 3R target sat at 7443.12. Price reached it and kept going to 7421.25 by 11:35 AM, and the window closed at +4.28R. Same setup, same session: a full loss unconfirmed, a strong winner confirmed.
August 13, 2026, where the stop decided the setup
On August 13, 2026 the ES opening range was 36.00 points, the ATR(14) was 5.70, and the level was the 7821.50 high. The stop sat 1.42 points away at 7820.08, or $71.21 per contract.
The long filled at 7821.50 on the 10:00 AM bar and ran to 7838.50 by 10:35 AM, 11.94R of favorable travel. Then the 10:45 AM bar came back to 7819.50 and took the stop. The one-close entry filled at 7826.75, gave up 5.25 points (3.69R), reached 1.76R and also stopped. The retest filled nine bars later at 7821.50, reached 1.58R and stopped.
No entry rule fixes that session. Only the stop distance or the target changes it, and both are exit decisions. If all your setup work goes into the trigger and none into the stop, this is the failure you keep meeting.
August 18, 2026, where the retest setup won alone
On August 18, 2026 the ES opening range was a narrow 16.25 points and the ATR(14) was 5.79, giving a 1.45-point stop worth $72.32 per contract.
The short filled at 7719.00 on the 10:10 AM bar. That same bar traded down to 7716.50 and up to 7726.00, and a five-minute bar cannot say which came first. Scored from the next bar, price went straight to 7728.75 by 10:15 AM, and the anticipation entry lost 1R.
The confirming close came late, at 7718.00 on the 11:05 AM bar, one point beyond the level and only 0.69R of give-up. It reached 1R and stopped. The retest entry took the level again at 11:10 AM and reached 3R. On ES the retest gate was the weakest of the four across the 49 sessions, at -0.347R per signal at 1R, yet it was the only one that won that day, which is why the rule gets chosen before the session and kept after it.
Related lesson: Stop-loss orders and placement
Risk and reward in a trade setup
Risk and reward decide whether a trade setup can make money at all, independent of how good the entries look. Express every setup in R, where 1R is the distance from entry to stop. The target multiple then sets the win rate the setup needs just to break even before costs.
| Target | Breakeven win rate before costs |
|---|---|
| 1R | Above 50% |
| 2R | Above 33.3% |
| 3R | Above 25% |
A setup that wins 40% of the time at a 2R target earns 0.40 x 2 minus 0.60 x 1, or +0.20R per trade before costs. The same 40% win rate at 1R loses money. That is why a win rate on its own says almost nothing about a setup.
Stop distance competes with confirmation
A wider stop is the main alternative to a confirmation rule. The 49-session ES and NQ opening range study measured for this guide reran the same anticipation (no confirmation) signals with a wider stop instead. Moving the buffer from a quarter of an ATR to a full ATR improved the unconfirmed entry from -0.388R to -0.020R per signal on ES, and from -0.375R to -0.042R on NQ. The cost was risk: median risk per contract went from $85.27 to $341.07 on ES and from $242.54 to $970.18 on NQ.
The gap between the best and worst entry gate on ES shrank as the stop widened, from 0.510R with a quarter-ATR buffer to 0.388R at half an ATR and 0.306R at a full ATR. Entry timing matters most when the stop is tight. A stop one tick behind a level sits inside the noise, and you can pay to get out of the noise either with a later entry or with a wider stop. Both cost money; they just charge it differently.
Related lesson: Risk-reward ratio
How to test whether a trade setup has an edge
Testing a trade setup for an edge means checking whether its average result per signal stays positive on data it was not designed on, after costs. Four habits separate a test from a story.
- Enough signals. Twenty trades can show a broken setup; it takes far more to show a working one. Treat any result from a few dozen signals as provisional.
- Out-of-sample data. Build and tune the setup on one period, then run it unchanged on a later period. If the edge disappears, it was probably fit to the first sample.
- Costs and fills. Commissions, fees and slippage come off every trade. A setup earning a few hundredths of an R per signal before costs may lose after them.
- Bar sequence. On bar data, a fill bar that touches both the target and the stop cannot tell you which came first. Count from the bar after the fill, or the test will credit wins that never happened.
The intrabar trap in setup testing
The bar-sequence problem is large, not academic. In the 49-session opening range breakout study measured for this guide, 26 ES and 27 NQ signals printed a full 1R of favorable travel inside the entry bar and still reached the stop first. Of the 44 ES anticipation entries that stopped out, 25 had touched at least 1R, and the median best excursion of a losing unconfirmed entry was 1.45R on ES and 1.54R on NQ. A favorable excursion is not a result. Let the stop decide.
An out-of-sample check of the confirmation setup
An out-of-sample check reruns a trade setup, unchanged, on data it was not built on. For this guide, the opening range breakout setup (opening range 9:30 to 9:55 AM ET, first touch of its high or low after 10:00 AM ET, a stop a quarter of an ATR beyond the level, a two-hour window, no costs) was run on 34 newer ES and NQ sessions from September 17 to November 4, 2026, after the 49-session study that ended September 16. One corrupted bar on October 30 was removed. The table shows the average result per signal at a 1R target, with no-trades scored as zero.
| Entry gate | ES signals taken | ES per signal at 1R | NQ signals taken | NQ per signal at 1R |
|---|---|---|---|---|
| Anticipation | 34 | -0.118R | 34 | -0.176R |
| One close | 32 | -0.099R | 31 | -0.221R |
| Two closes | 30 | -0.144R | 29 | -0.092R |
| Retest | 26 | -0.059R | 26 | -0.206R |
The out-of-sample result is the uncomfortable part of this trade setup test, and the useful one. Confirmation still cut stop-outs: on ES the stop rate fell from 91.2% unconfirmed to 81.2% with one close and 70.0% with two closes, and on NQ from 94.1% to 80.6% and 69.0%. The cost side replicated too, with a median one-close give-up of 2.625 ES points (1.62R) and 16.25 NQ points (1.51R). All 5 signals that never confirmed (2 on ES, 3 on NQ) were full losses for the anticipation entry.
What did not replicate was the payoff. If you had adopted the one-close rule in mid-September because of the 49-session results, the next seven weeks would have averaged a small loss per signal on both ES and NQ. At 1R every gate lost money on both instruments, and the one-close advantage that looked solid on 49 sessions was gone. At 3R the ranking flipped again: anticipation earned +0.529R per signal on ES and +0.294R on NQ, while two closes came in at -0.112R and -0.183R. A full-ATR stop on the anticipation entry earned +0.176R per signal on ES at 1R, but raised median risk per contract from $78.24 to $312.95, and the same change still came in at -0.141R on NQ.
Limits of the setup confirmation studies
The two confirmation studies in this guide (49 sessions from July 8 to September 16, 2026, and 34 sessions from September 17 to November 4, 2026) are specific, not general. They cover one opening range breakout setup definition, two index futures, and about four months of 2026 data. They exclude costs, assume stops fill at their price, and use a continuous front-month series that can differ from any single contract. What they do show is the structure of the trade-off: confirmation reliably reduces stop-outs and reliably costs entry distance, while whether that nets out positive depends on the target, the stop and the sample. That is a reason to test your own trade setup, not to copy either table.
Tracking and breaking down setup performance
Tracking setup performance means logging every trade setup you identify, taken or passed, in a way that lets you split results by setup later. A blended account result hides which setup is paying for which.
Log these fields for every setup at the moment you identify it, before the outcome is known:
- Setup name and family, instrument, direction, date and time.
- The level, the entry gate used, the price actually filled, and the give-up between them.
- The stop and target in price and in R, and the dollar risk per contract.
- Which came first, target or stop, plus the best and worst excursion in R.
- For passed setups, why you passed and what the setup would have done.
Breaking down trade results by setup and entry gate
A trade setup breakdown splits the log by the fields that might explain differences: setup family, entry gate, instrument, time of day and context. Compare average R per signal, not win rate, because a 70% win rate at 0.5R and a 35% win rate at 3R tell opposite stories.
Show the sample count next to every row. A subgroup with eight trades is not a result, and a breakdown that slices 60 trades into 12 buckets mostly measures luck. Retire or change a setup only on a meaningful sample, and change one rule at a time so you can tell what the change did.
The single most useful number to track is the one most journals skip: the distance between the level you identified and the price you got. If your median give-up sits well above 1R while your stop rate stays high, your confirmation rule is charging more than it returns.
Related lesson: How to keep a trading journal
Managing a setup after entry
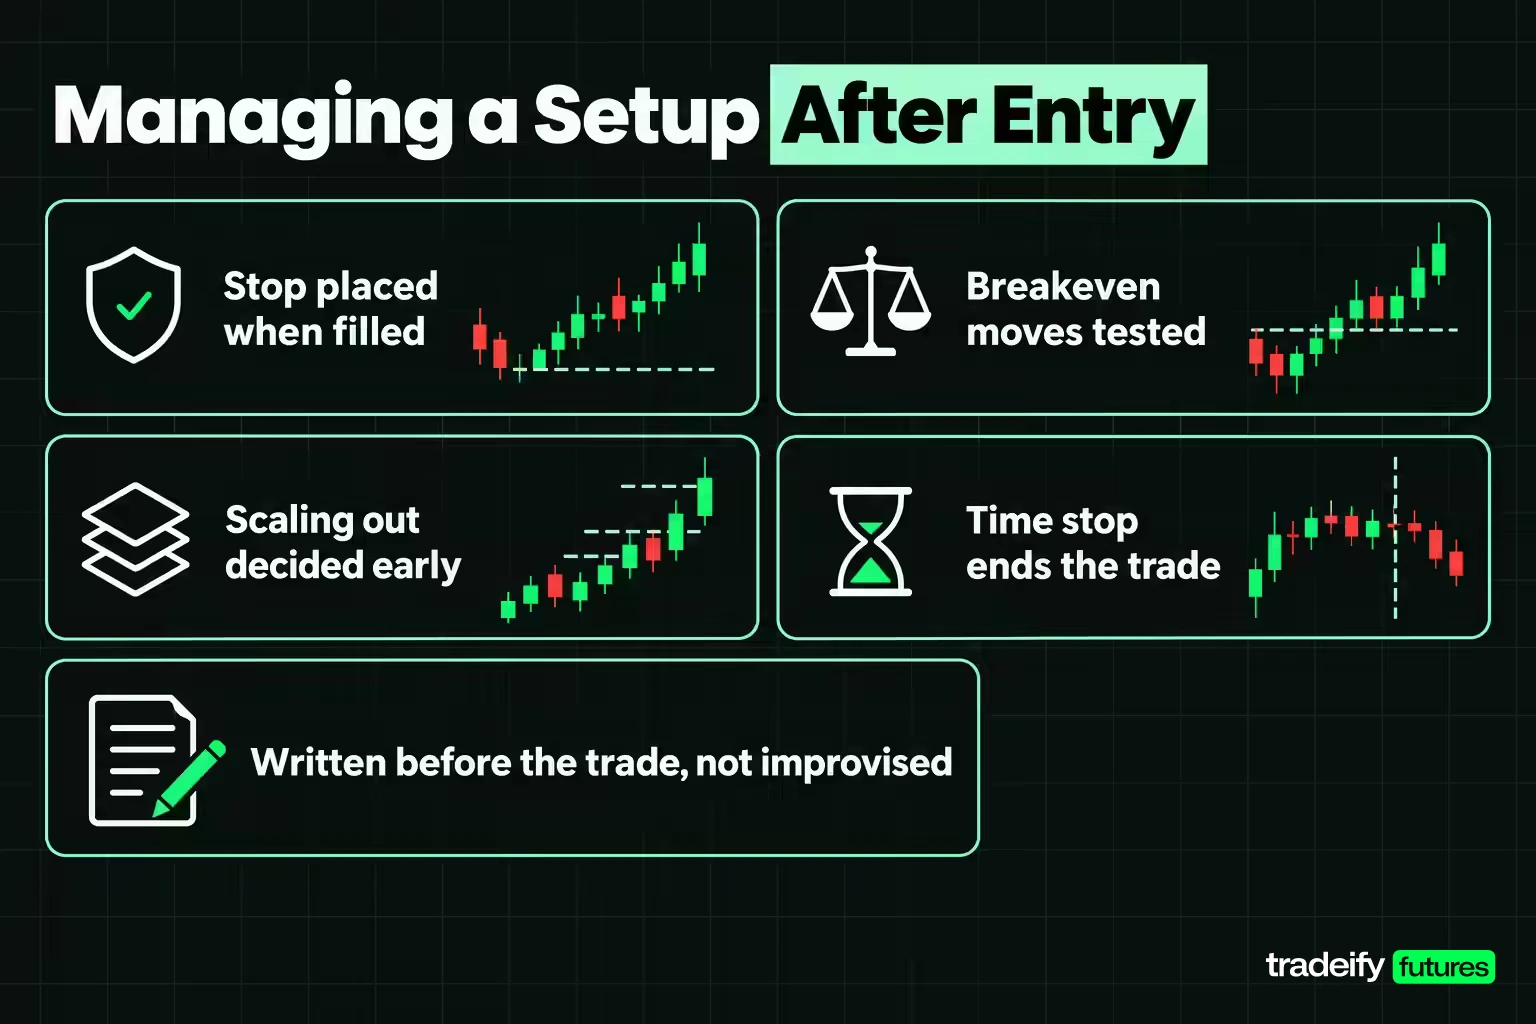
Managing a setup after entry is part of the trade setup, not an improvisation. The written trade setup should already say what happens once you are filled.
- Stop placement. The stop goes at invalidation plus the buffer, placed as a working order the moment you are filled. Moving it further away after entry turns a defined loss into an open one.
- Breakeven moves. Moving the stop to entry after a partial move reduces losses but also converts some eventual winners into scratches. The August 13 type of session, where price ran far and then reversed, is the case for it; the July 27 type, where price shook out before working, is the case against it. Test it rather than assume it.
- Scaling out. Taking part of the position at 1R and holding the rest for a further target smooths results but lowers the average win. Decide the split in advance.
- Time stops. If the setup has not reached target or stop within its window, exit. A breakout that goes nowhere for two hours is no longer the trade you planned.
- Mid-trade invalidation. If the context that justified the setup flips, such as price closing back inside the range on a breakout, the setup can tell you to exit before the stop.
On our accounts, every position is closed by 4:45 PM ET on regular trading days and nothing is held overnight, so a setup's exit window has to end inside the session. Platform tools can enforce the plan: Tradovate ATM strategies place the stop and target as a linked bracket once the entry fills, and Tradesea offers position brackets and a personal lockout timer.
How trading setups change across instruments and timeframes
Trading setups do not transfer between instruments or timeframes unchanged. The same opening range trade setup produced different give-up and different gate rankings on ES and NQ in this guide's confirmation study (a median one-close give-up of 2.75 points on ES against 16.625 points on NQ), because NQ moves more points per bar and is worth $20 per point against $50 for ES.
- Stop buffers should be set in volatility units such as ATR, not fixed points, so they mean the same thing across instruments.
- Sessions differ. Crude oil and gold futures have their own active hours and scheduled reports, so a setup timed around the stock market open may not fit them.
- Timeframes change the cost. A one-close rule on a one-minute chart gives up far less distance than on a fifteen-minute chart, and filters far less noise.
Retest the trade setup on each new instrument and bar interval before trading it there.
Common trade setup mistakes
Common trade setup mistakes come from vagueness, impatience and scoring the wrong thing. Most of them show up in a journal long before they show up in the account balance.
- Too many setups. Five setups traded loosely produce less evidence than one setup traded the same way every time.
- A vague trigger. "Wait for confirmation" without saying which close, on which bar interval, is not a rule.
- Chasing a missed entry. The price after the move is a worse entry for the same stop. The urge to chase is strongest right after you watched the move leave without you, which is exactly when the give-up is largest.
- Moving the stop after entry. It removes the invalidation the setup was built on.
- Judging by win rate. A higher win rate can come with lower expectancy, as the confirmation study showed when two closes improved stop rates but not always the result per signal.
- Judging on a short sample. One rough week is one line in the sample, not a verdict. One great week is not proof either.
- Ignoring context. Taking a breakout setup in a range-bound session, or a range setup on a trend day, is a mismatch the setup never covered.
- Skipping the out-of-sample test. A setup tuned on one period and never run on another is a hypothesis.
Frequently asked questions about trade setups
What is a trade setup in trading?
A trade setup is a written set of conditions that has to be true before you take a trade. It names the market context, the entry trigger, the price at which the idea is wrong, and the exit rule. The practical test is whether someone else could read it and take the same trades.
What does confirmation mean in trading?
Confirmation is the rule that decides a setup's trigger has fired, such as a close beyond a level, two closes, or a retest. Its job is to filter out moves that fail immediately. The cost is usually a worse entry price and a wider stop for the same invalidation.
Does waiting for confirmation improve results?
Waiting for confirmation reliably reduces stop-outs, but it does not reliably improve the result per signal. In the 49-session ES and NQ opening range study measured for this guide, one close turned a losing entry slightly positive at 1R. On 34 newer sessions of the same test, that advantage disappeared.
How long should you wait for confirmation?
Define the wait by an event, such as the first five-minute close beyond the level, not by a number of minutes. In the opening range study measured for this guide, the median wait was one bar on ES and zero on NQ. The expensive part of waiting was the distance price travelled before closing, not the time.
Is a trade setup the same as a strategy?
No. A trade setup is the entry side for one pattern of trade: the context, trigger, invalidation and exit. A strategy adds position sizing, loss limits, the number of setups traded and the rules for when to stop trading a setup.
Which trade setup is best?
No setup is best for every trader or every market. The best setup for you is one whose failure mode you can execute through calmly and whose results stay positive on data it was not built on. Pick one, write it down completely and test it before adding another.
The figures in this guide come from historical, cost-free measurements on continuous futures data and are for education only. They are not trading advice or a recommendation to buy or sell any instrument. Futures trading involves substantial risk of loss, and leverage means a small adverse move can produce a loss larger than expected. Results in simulated, evaluation or funded accounts are simulated and do not carry over automatically to live trading.


