



TL;DR: Anchoring bias in trading is letting a price you already know, like your entry or an old high, decide what you do next. On 335 E-mini closes above a 52-week high, price touched that level again within 10 sessions 86.3% of the time. A stop parked on the remembered level sits on one of the most revisited prices on the chart. Set risk from where the trade is wrong, in ATR terms, and treat old levels as places to watch.
You bought at 7,000. Price is now 6,960, and every instinct says to wait until it gets back to 7,000 so you can get out "even." Nothing about the market cares what you paid. The number only matters to you.
That is anchoring at work, and it is one of the most expensive habits in trading because it feels like discipline. A price on your screen looks like information. Often it is just a memory.
This guide covers what anchoring is, why it is so hard to shake, where it shows up in your decisions, and what twenty years of E-mini S&P 500 futures data says about the two anchors traders lean on most: the entry price and the remembered high.
What Anchoring Bias in Trading Means
Anchoring bias is the tendency to rely too heavily on the first number you see and then adjust too little away from it. Psychologists Amos Tversky and Daniel Kahneman described it in their 1974 paper in Science: people start from an initial value and adjust, but "adjustments are typically insufficient," so different starting points produce different answers biased toward the starting value.
In finance, the anchor is usually a price. It might be the price you paid, the price you saw when you first opened the chart, last month's high, an analyst's target or a round number like 7,000. Once that number is in your head, later information gets measured against it instead of being judged on its own.
For a trader, two anchors do most of the damage:
- The entry price. Your fill becomes the line between "right" and "wrong," even though the market has no idea where you got in.
- The remembered level. A high or low you watched form keeps feeling important long after the conditions that produced it have changed.
Watching a level is not the bias. Levels are where other traders have acted before, so they are reasonable places to look for a reaction. The bias starts when the level stops being a place to watch and becomes a decision you have already made: the stop goes there, the exit waits for it, the trade only "counts" once price gets back to it.
Related lesson: How anchoring fits with other trading biases
The Psychology Behind Anchoring Bias
Anchoring survives because it is a shortcut the brain uses everywhere, not a trading quirk. The research shows three things worth knowing.
Even meaningless anchors work. In Tversky and Kahneman's classic demonstration, a wheel of fortune was spun in front of participants to produce a number between 0 and 100. They were then asked to estimate the percentage of African countries in the United Nations. Groups that saw 10 gave a median estimate of 25. Groups that saw 65 gave a median estimate of 45. The wheel carried no information at all, and it still moved the answer. Paying people for accuracy did not remove the effect.
Adjustment stops too early. The same paper describes students estimating a long multiplication in five seconds. Those who saw 8x7x6x5x4x3x2x1 guessed higher than those who saw 1x2x3x4x5x6x7x8, because the first few steps set the anchor and the adjustment from there fell short. In a trade, your entry or your first read of the chart is that first step.
Experts are not immune. Thomas Mussweiler, Fritz Strack and Tim Pfeiffer tested anchoring on car experts appraising a 10-year-old car and found the stated price still pulled their estimates. Their 2000 paper calls anchoring effects "remarkably robust." Listing reasons why the anchor was wrong reduced the pull, but it "did not completely remove the distortion."
Why a Loss Below Your Entry Feels Worse
Anchoring has a second job in trading: it sets the reference point for gain and loss. Prospect theory says people judge outcomes as gains or losses relative to a reference point, and losses feel worse than equal gains feel good. Your entry price is the obvious reference point. Below it, every tick feels like a loss you have not "taken" yet. Above it, every tick feels like a gain you could lose.
That is why the entry price anchor is so sticky. Closing below your entry turns a paper loss into a real one, so the anchored mind looks for any reason to wait for the number to come back.
Why Traders Fall Into Anchoring
Anchoring in trading is not only a thinking error. The way trading screens, charts and accounts are built hands you anchors all day. The common causes:
- The P&L is shown against your entry. Platforms display open profit and loss from your fill price, so the entry is the first number you see on every glance.
- Charts print the old levels. A 52-week high, yesterday's close or a big round number sits on the screen as a line, which makes it feel like structure even when nothing is happening there.
- Inexperience with volatility. A newer trader often judges a move in points ("it's down 20") rather than against how far the market normally moves. A 20-point dip means something very different on a quiet day than on a wild one.
- Emotional attachment. Once you have argued yourself into a trade, the entry represents your judgment. Selling below it feels like admitting the judgment was wrong.
- Confirmation bias. After anchoring on a price, it is easy to notice the evidence that price "should" return there and skip the evidence that it will not.
- Thin research. When you do not have a fresh, independent reason for a level or a target, the old number fills the gap.
The behavioral finance research shows how strong the entry reference is. Terrance Odean's 1998 study in the Journal of Finance examined trading records for 10,000 accounts at a large discount brokerage from 1987 to 1993. Using the purchase price as the reference point, investors realized 0.148 of their available gains against 0.098 of their available losses. In his words, a stock that was up was more than 50 percent more likely to be sold than one that was down. Shefrin and Statman had named this pattern the disposition effect in 1985: selling winners too soon and holding losers too long. Anchoring on the purchase price is what makes "up" and "down" feel so different.
Anchoring Bias Examples in Trading
Anchoring bias in trading shows up in a handful of recognizable forms. Each one starts with a real price and ends with a decision the price did not justify.
- The entry price. You hold a losing ES trade past your plan because you want out "at breakeven." The trade's purpose quietly changes from "the setup works" to "get my money back."
- The first price you saw. You noticed crude at a lower price this morning, so you refuse to buy it higher even after your setup triggers. The trade gets skipped because of when you happened to look.
- The 52-week high. You treat the old high as a ceiling and short into it, or as a floor once it breaks and put your stop exactly there.
- Yesterday's close or settlement. You frame the whole session as "up" or "down" from that number and size your conviction by it, even when the overnight session has already moved the market somewhere new.
- A round number. You set a target at 7,000 because it looks like a natural stopping point, not because your setup points there.
- A stale target. An analyst target, or your own from last week, stays in your head after the reason for it has changed.
Imagine a trader long one E-mini S&P 500 contract from 7,000, an illustrative price. Price drops to 6,960, 40 points lower, which is $2,000 on one ES contract ($200 on one Micro E-mini). The planned stop was at 6,970. Instead of exiting, the trader moves the stop under 6,950 because "it will come back to 7,000." Nothing new has happened in the market. The only new information is that the trader's own price has been crossed.
Anchoring to an Old Central Bank Narrative
Anchoring is not only about price levels. Macro and forex traders often anchor to a story about policy. A trader who formed a view when central bank policy pointed one way can keep reading every new data release through that view after policy has turned.
The Federal Reserve gives a clean example. It raised its target range by a quarter point to 3.75%-4.00% on September 16, 2026, and held it at its October 28 meeting, when two officials dissented in favor of another hike. A trader anchored on an older "cuts are coming" view would read a hot inflation print as noise, while the policy statement itself said inflation remained elevated. The same anchoring happens in currency futures such as euro FX or yen futures when a trader keeps pricing a central bank by last year's stance.
Research on stocks points to a market-wide version of the anchor. Thomas George and Chuan-Yang Hwang's 2004 Journal of Finance paper found that how close a stock trades to its 52-week high predicts future returns better than its past returns do. Their explanation is anchoring: traders use the 52-week high as a reference point and are slow to bid a price above it even when the news justifies it.
Related lesson: The bias that makes the latest move feel permanent
How Anchoring Bias Hurts Entries, Exits and Stops
Anchoring rarely costs money in one dramatic moment. It leaks through five ordinary decisions, and each one feels reasonable while you are making it.
Held losers. The entry becomes the exit target, so a small planned loss turns into a hope trade. The loss that should have been 1R becomes whatever the market decides.
Missed entries. A trader who first saw a lower price will not pay up, so valid setups get skipped. The opposite also happens: after selling a winner, a trader refuses to buy back in above the exit price even when the setup returns.
Stops placed by memory. The stop goes at the remembered level because that line is on the chart, not because the trade idea is wrong there. The distance from entry to stop, which sets your dollar risk, is then decided by wherever the level happens to sit.
Sizing that ignores volatility. A fixed "10-point stop" feels like a fixed risk. It is $500 on one ES contract and $50 on one Micro E-mini, but what it covers changes with the market. In this guide's study of twenty years of Yahoo Finance E-mini daily data, 10 points was 62.9% of a quiet session's average true range (ATR) at the 10th percentile, and 11.9% of a volatile session's ATR at the 90th percentile. The same stop is generous on one day and paper-thin on another.
Capital tied up in dead trades. While you wait for a losing position to come back to your price, the margin and attention it uses are not available for the next valid setup. On a prop account with a daily loss limit or drawdown rule, waiting can also eat the room you need for the rest of the session.
Related lesson: Why a fixed point stop is not a fixed risk
Entry Price Anchoring and the Breakeven Trap

Entry price anchoring is the habit of treating your fill as the price that decides the trade. The most common form is the breakeven trap: a trade goes against you, and instead of exiting at the planned stop you wait to get out "even."
To see what that habit really does, this guide measured it on E-mini S&P 500 futures (ES). The method, so you can rebuild it:
- Data: Yahoo Finance's continuous front-month ES daily bars, 5,096 sessions from 8 August 2006 to 4 November 2026.
- Entry: a session closes above the highest high of the prior 20 sessions, and the trade buys the next session's open. That gave 601 signals.
- Risk unit: Wilder's 14-session average true range (ATR) on the signal day. A 1 ATR stop below entry is called 1R.
- Costs: no commission or slippage, so every figure is gross. This is an illustrative study of one index, not a strategy recommendation.
How Far Price Moves Against the Entry
In the twenty-year ES breakout study, almost every entry went underwater at some point. Within 10 sessions, the median trade fell 28.25 points below its entry, which is $1,412.50 on one ES contract and $141.25 on one Micro E-mini. A quarter of trades dipped 13 points or less, a quarter dipped 61.75 points or more, and the largest dip was 436.75 points. Measured against volatility, the median dip was about 1 ATR, and 307 of the 601 trades (51.1%) went at least 1 ATR against the entry.
Price also came back to the entry a lot. In this guide's Yahoo Finance ES study, after the entry session, 557 of the 601 trades (92.7%) traded back to the entry price within the next nine sessions. So the entry is a price the market passes through constantly. It is not a line it defends.
What Waiting for Breakeven Costs
The real test is what happens after a trade hits its planned stop. In this guide's ES study, 388 trades fell 1 ATR below entry within 20 sessions. Suppose the trader ignored the stop and waited up to 20 more sessions to get out at the entry price.
| Breakeven wait outcome in the ES study | Trades | What happened |
|---|---|---|
| Price got back to the entry | 338 (87.1%) | Median 3 sessions to recover, after a median further drop of 0.59 ATR |
| Price never got back | 50 | Median further drop of 5.08 ATR, median finish -3.53R, worst finish -26.0R |
| All waits combined | 388 | 165 (42.5%) fell at least another 1 ATR beyond the stop |
Here is the uncomfortable part, and it is worth being honest about. On a long-only breakout in a rising index, waiting usually worked. The waiting policy averaged -0.53R against -1R for taking the stop. That is exactly why the entry anchor is so hard to break: it pays off often enough to feel right.
But the result depends on the period. Over these twenty years the S&P 500 mostly went up, which rescues longs. The same habit on short trades, or in a falling market, gets no such help. And the tail is the problem. In the 50 cases that never came back, the median loss grew to more than three and a half times the planned risk, and the worst finished 26 times the planned risk down. One of those trades can undo dozens of rescued ones, and on an account with a daily loss limit or trailing drawdown it ends the account long before the 20 sessions are up.
The entry anchor turns a defined risk into an open-ended one. Whether it "worked" in a particular sample is less important than the fact that you no longer know what you are risking.
Related lesson: Why losses feel bigger than the same gains
Testing the 52-Week High Anchor on E-mini Futures

The 52-week high is the most visible anchor on a chart. Traders treat it as resistance on the way up and support once it breaks. This guide measured what E-mini S&P 500 futures actually did around it.
The method uses the same twenty-year Yahoo Finance ES daily data, from August 2006 to November 4, 2026:
- The level: the highest high of the 252 sessions before each session, which is the 52-week high a chart displays. It uses only past sessions, so there is no hindsight in the level.
- An approach: a session whose high came within 0.2% of the level. There were 1,000 approaches.
- A break: a close above the level. There were 335 breaks, 33.5% of approaches.
- Risk unit: Wilder's 14-session ATR on the break session. No commission or slippage.
In the ES data, price traded above the level during the session on 654 approaches (65.4%), but 320 of those (48.9%) closed back at or under it the same day. Poking through a 52-week high was common. Holding above it at the close was not.
Fresh levels broke more often than old ones in this guide's ES study. When the 52-week high had been set within the previous five sessions, 281 of 801 approaches (35.1%) closed above it. When the level was more than 20 sessions old, only 18 of 70 approaches (25.7%) did. An old high is not stronger because traders remember it. In this sample it simply broke less often, and the small number of old-level cases means that gap should be read loosely.
How Often Price Returns to a Broken 52-Week High
A break of the 52-week high in the twenty-year ES study did not mean price left the level behind. The table separates touching the level again from closing back below it.
| Sessions after an ES break | Touched the level again | Closed back below the level |
|---|---|---|
| 1 | 57.9% | 24.5% |
| 5 | 78.8% | 51.9% |
| 10 | 86.3% | 63.9% |
| 20 | 89.9% | 75.2% |
Touching is what a resting stop experiences. Closing back below is what a trader working from closing prices would call a failed breakout. Both were common in the ES study run for this guide. Within 10 sessions, 289 of the 335 breaks (86.3%) traded back to the level.
The 20 sessions after a break were also no better than average in this guide's study. Measured from the breakout close, the ES index averaged a -0.02% change over the next 20 sessions and was higher 58.8% of the time. Across all sessions in the same period, the 20-session change averaged +0.81% and was higher 65.4% of the time. That is one index and overlapping windows, so treat it as context rather than a signal. It does say the new high was not a reliable launch pad here.
Why a Stop at the Anchored Level Gets Hit
The 52-week high study prices the most common anchored decision: buying the break and putting the stop at the level you just broke. In the twenty-year ES data, here is how often each stop was touched within 10 sessions of the 335 breaks:
| Stop placement after an ES break | Stops touched within 10 sessions |
|---|---|
| At the broken level | 289 (86.3%) |
| 0.25 ATR below the level | 242 (72.2%) |
| 0.5 ATR below the level | 206 (61.5%) |
| 1 ATR below the level | 164 (49.0%) |
| 1 ATR below the break close | 192 (57.3%) |
This is not an argument for wider stops. A wider stop costs more per contract and is touched less, and both facts have to be priced together. The point is that the level is where price has been, and the risk belongs where the trade idea is wrong. Those are different prices.
The anchored stop also gives you a random risk. Across the 335 ES breaks, the distance from the break close down to the level ran from 0.25 points to 127.75 points, a median of 7 points. On one ES contract that is anywhere from $12.50 to $6,387.50, with a median of $350. The breakout decided your risk, not your plan.
Two 52-Week High Breaks That Show the Anchored Stop
Two E-mini breaks of the 52-week high, taken from this guide's ES study, show both ways an anchored stop goes wrong:
- 19 February 2025. The 52-week high was 6,162.25, set 17 sessions earlier. ES closed at 6,163.00, just 0.75 points above it, or $37.50 on one contract. A stop at the level looked cheap. Over the next 10 sessions price fell to 5,744.00, 418.25 points under the level ($20,912.50 on one contract, about 6 ATR), and was 7.86% lower 20 sessions later. The stop was tiny and almost certain to be hit.
- 13 December 2023. The level was 4,649.75, set the previous session. ES closed at 4,708.25, 58.5 points above it, or 1.34 ATR. A stop at the level meant $2,925 of risk on one contract. Price never came back to the level in the next 10 sessions and was 2.3% higher 20 sessions later. The stop was never touched, and it was still the wrong stop, because the size of the breakout candle set the risk instead of the trader.
Related lesson: Where a stop belongs and why
Do Round Numbers Anchor Price
Round numbers are the anchor traders mention most often. The claim is that price is drawn to levels like 7,000 or 6,500 because they are easy to remember. This guide tested that claim on the same twenty years of E-mini S&P 500 daily data.
The test needs a control. On ES, prices move in 0.25-point ticks, so whole hundreds (like 7,000) and the halfway fifties (like 6,950) are spaced identically and are equally likely by chance. If round numbers pull price, session highs and lows should cluster near the hundreds more than near the fifties.
| ES price group tested | Near a whole hundred | Near a halfway fifty |
|---|---|---|
| 10,190 session highs and lows, within 10 points | 20.7% | 19.4% |
| 591 swing highs and lows, within 10 points | 21.2% | 19.5% |
An even spread on the tick grid would put about 20.3% of prices within 10 points of either kind of level. The highs and lows near whole hundreds came in barely above that, and the average distance to the nearest hundred (24.78 points) was almost the same as to the nearest fifty (25.22 points). The smaller version of the claim did no better: 21.7% of highs and lows landed within 1 point of a whole ten, against 23.1% near a five, and 22.5% for an even spread.
So, in twenty years of ES daily highs and lows, round numbers showed no measurable pull on where the market turned. That does not mean round numbers are useless. They matter to attention: orders, alerts, headlines and targets collect there. That is a claim about traders rather than about price, and it makes a round number a place to watch for activity, not a level the market respects.
Related lesson: Checking a level against the rest of a setup
How to Overcome Anchoring Bias
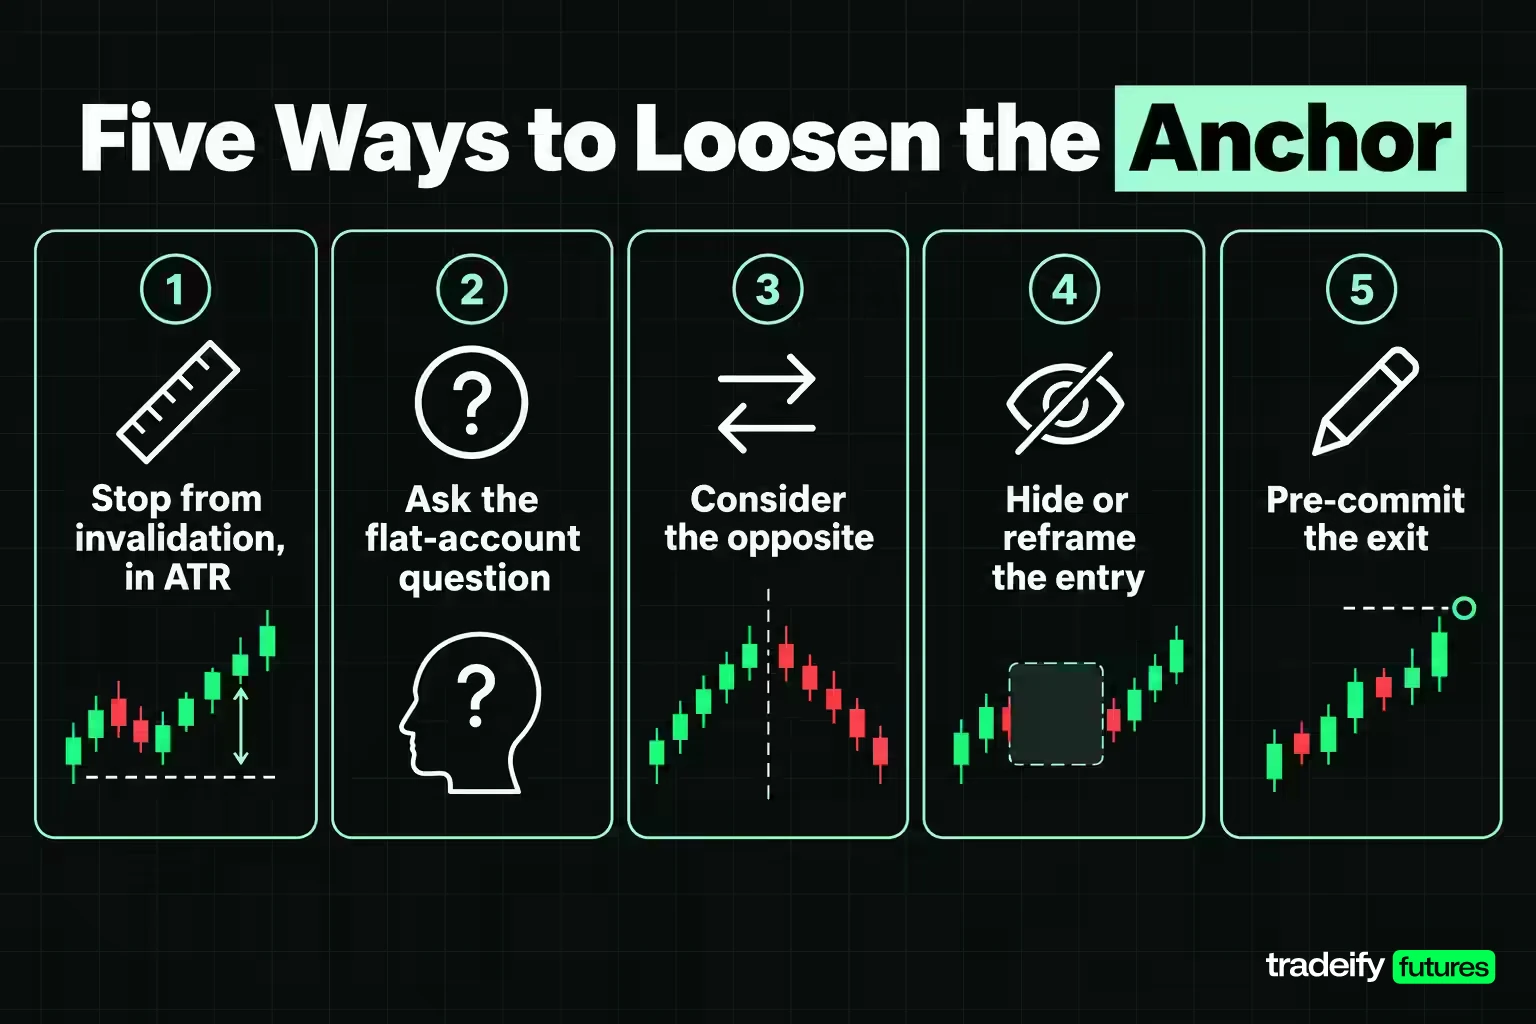
You will not stop anchoring completely, and you do not need to. The Mussweiler, Strack and Pfeiffer study showed that even a good debiasing method reduces the pull without removing it. The practical goal is to make anchored decisions harder to take by putting the important choices on paper before a price is in your head.
Set the stop from invalidation, then measure it in ATR. Write down where the trade idea is wrong before you enter. Then express that distance in ATR so you can see whether it is a sensible amount of room for today's market, and size the position from it. If the only reason for the stop is "that's the level," you have not set a stop yet.
Ask the flat-account question. At any point in a trade, ask: if I had no position, would I enter here, in this direction, at this size? If the answer is no, the only thing keeping you in is your entry price.
Consider the opposite on purpose. Mussweiler and his co-authors found that listing reasons why the anchor was wrong reduced its effect. Before you trust a level, write two reasons it might not matter today: it is old, volatility has changed, the news that made it is gone.
Hide or reframe the entry. Some traders switch their platform's open P&L to ticks or R instead of dollars, or hide it during the trade, so the entry stops being the loudest number on the screen.
Pre-commit the exit. Put the stop and target in as orders when you enter. Changing them then takes a deliberate action instead of a drift.
Using Other Traders' Anchors
Anchoring is a market-wide habit, so other traders' anchors can be useful information. Old highs, round numbers and yesterday's close are places where orders tend to gather, so they are reasonable spots to watch for a reaction or a burst of volume. The key is to use them as places to watch, not places to risk money. In this guide's twenty-year study of Yahoo Finance E-mini S&P 500 data, a broken 52-week high was touched again within 10 sessions 86.3% of the time, which makes it a good spot to watch for a retest and a poor spot to hide a stop.
Journal Fields That Expose Anchoring
A trading journal catches anchoring only if it records the anchor. For each trade, add three fields:
- The level you were watching and how old it was in sessions.
- Where the stop came from: invalidation, a level, a fixed number of points, or your entry.
- Whether you changed the exit during the trade, and whether the change moved toward your entry price.
After 30 trades, compare the average loss on trades where the stop came from a level or the entry with the rest. That gives you your own number instead of a general rule.
Prop Account Rules That Limit Entry Price Anchoring
On our accounts, entry price anchoring cannot turn into a multi-day wait for breakeven: every position is closed by 4:45 PM ET on regular days and nothing is held overnight, so a trade anchored to its entry has to be resolved inside the session. Tradovate's personal Risk Settings let you set your own daily and weekly loss limits on our evaluation and Sim Funded accounts, and Tradesea offers a lockout timer. These are your own limits and do not replace our rules, but they enforce the plan you wrote while flat.
Anchoring Bias in Trading FAQ
What is anchoring bias in finance?
Anchoring bias in finance is relying too heavily on a reference number, such as a purchase price, a past high or a forecast, and adjusting too little when new information arrives. Tversky and Kahneman's 1974 research showed that even a random number can pull estimates toward it. In trading, it most often shows up as holding a loser until it returns to the entry price.
What is the 7% rule in stocks?
The 7% rule usually refers to Investor's Business Daily's 7%-8% sell rule: sell a stock if it falls 7% or 8% below your purchase price. For example, a stock bought at 100 would be sold at 92 or 93. The rule deliberately uses the purchase price as its anchor, but it turns that anchor into a pre-set exit rather than a reason to wait.
What are the 7 types of bias?
A common list of seven trading and investing biases is anchoring, confirmation bias, loss aversion, overconfidence, recency bias, herding and familiarity bias. No single official list exists, so other sources swap in biases such as hindsight or the disposition effect. They often work together: anchoring sets the reference number, and confirmation bias collects reasons to keep it.
What is familiarity bias?
Familiarity bias is the preference for investments you already know. Gur Huberman's 2001 study found that customers of a regional US phone company were more likely to invest in their own local company than in similar companies serving other areas. In trading, it can show up as sticking to one market or setup because it feels comfortable rather than because it fits the conditions.
Is anchoring the same as confirmation bias?
No. Confirmation bias filters which evidence you notice. Anchoring is adjusting too little from a starting number even when you accept the new evidence. A trader can admit the trade is going wrong and still move the stop only a little, because the entry is pulling the decision back.
Related lesson: The bias that filters the evidence
How to Check Your Own Trades for Anchoring
Pull your last 30 trades and mark two things for each one. First, where did the initial stop come from: the point where the idea was wrong, a level on the chart, a fixed number of points, or nothing at all? Second, did you ever move the stop or delay an exit while price was near your entry?
If the trades with level-based stops or delayed exits carry bigger average losses than the rest, the anchor is setting your risk. Change one thing next session: write the invalidation price and its distance in ATR before the order goes in, and size from that number.
This guide is educational and is not financial advice. The E-mini figures come from a historical study of one continuous futures series with no commission or slippage, and past results do not predict future ones. Futures are leveraged, and losses can exceed what you expect or what you planned to risk. Evaluation and funded accounts at prop firms run in a simulated setting, and results there differ from live trading.


