



TL;DR: Loss aversion in trading is the pull to give a losing position more room than you planned, and the moved stop is where it shows. On 590 E-mini breakout signals, widening the stop once made the average loss 48.11% larger and cut the total by 12.43%. Removing the stop raised the win rate to 71.69% but produced a single loss of 24.25R. Decide the stop and its dollar risk before entry, and only ever move it toward the trade.
Loss aversion in trading rarely feels like fear. It looks like a stop order that was 40 points below your entry when you placed the trade and is 55 points below it twenty minutes later, with nothing on the chart to explain the change.
You probably know the advice already: cut losers, let winners run. This guide explains why that advice is so hard to follow, where the research puts the size of the bias, and how it turns into specific trading behaviour. Then it measures that behaviour on 20 years of E-mini S&P 500 data, so the cost of a moved stop is a number rather than a warning.
What Loss Aversion Means
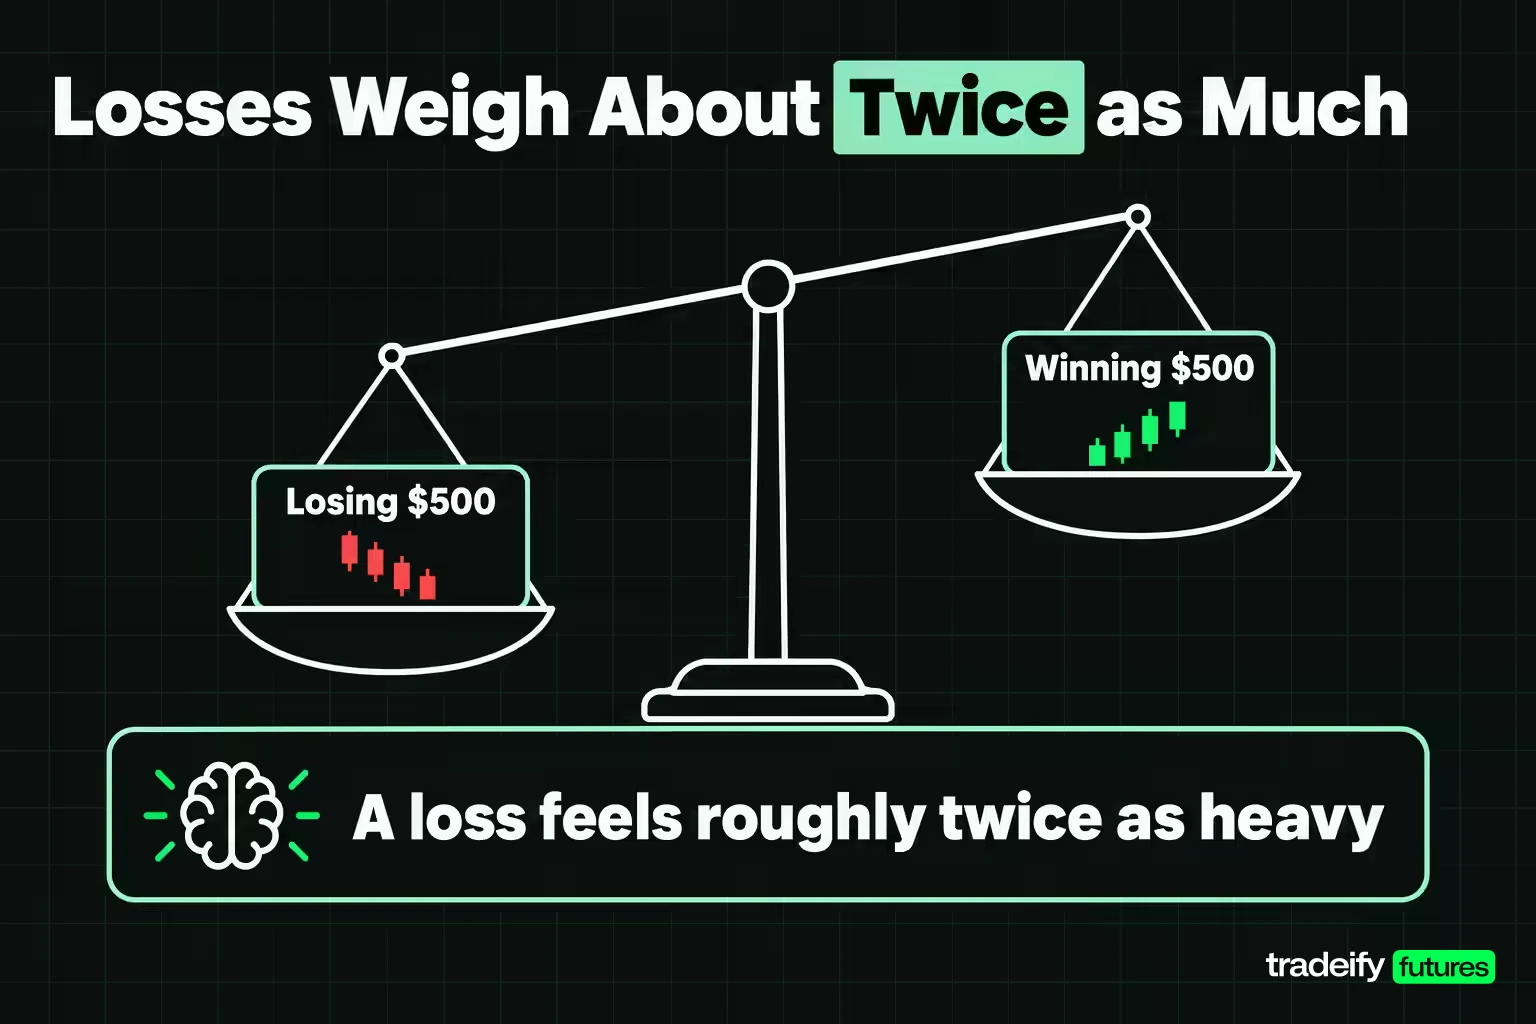
Loss aversion is the tendency to feel a loss more strongly than a gain of the same size. Losing $500 hurts more than winning $500 pleases, so people will accept worse odds to avoid the loss than they would to collect the gain.
The size of the effect is well measured. A 2024 meta-analysis in the Journal of Economic Literature by Brown, Imai, Vieider and Camerer pooled 607 estimates from 150 articles published from 1992 to 2017. The mean loss aversion coefficient was 1.955, with a 95% interval of 1.820 to 2.102. In plain terms, the average person treats a loss as roughly twice as heavy as an equal gain.
That ratio is an average across people and studies. Some traders feel it more, some less, and the same trader can feel it more after a run of losses. What matters for a trading account is not the exact number. It is where the asymmetry pushes your decisions.
Related lesson: Anchoring to the entry price
Prospect Theory and Loss Aversion Compared
Prospect theory is the wider model, and loss aversion is one part of it. Daniel Kahneman and Amos Tversky published prospect theory in Econometrica in 1979 to describe how people actually choose between risky outcomes, as opposed to how expected utility theory says they should.
Prospect theory has three moving parts that traders feel directly.
- Reference point. Outcomes are judged as gains or losses from a starting point, and in trading that point is almost always the entry price.
- Loss aversion. Losses count for more than equal gains.
- Reflection. People are risk averse when they are ahead and risk seeking when they are behind. Kahneman and Tversky found a risk-seeking preference for a loss that is merely probable over a smaller loss that is certain.
The 1992 update, cumulative prospect theory, named diminishing sensitivity and loss aversion as the two principles behind the shape of the value function. It also confirmed the pattern of risk aversion for gains and risk seeking for losses of high probability.
Put those together and you get the trading problem in one line. A losing position offers a certain small loss now (exit) or a probable larger loss with some chance of breakeven (hold). Prospect theory predicts that most people hold.
Loss Aversion in Trading Decisions and the Disposition Effect
Loss aversion shapes trading and investing decisions through a pattern called the disposition effect, the habit of selling winners too soon and riding losers too long. Hersh Shefrin and Meir Statman gave it that name in the Journal of Finance in 1985.
The best-known measurement comes from Terrance Odean's 1998 Journal of Finance study of trading records from 1987 through 1993 for 10,000 accounts at a large discount brokerage. Odean compared the proportion of gains realized (PGR) with the proportion of losses realized (PLR). Across the full year, PGR was 0.148 and PLR was 0.098. Investors were far more willing to sell a winner than a loser.
The holding was also expensive. Odean found that the winners those investors sold went on to earn an average excess return over the following year that was 3.4% more than the losers they kept. The losers were not about to recover. The investors simply did not want to make the loss real.
Futures professionals are not immune. Peter Locke and Steven Mann studied professional futures floor traders in a 2005 Journal of Financial Economics paper and found they held losing positions longer than winning ones. Their more useful finding for a trader is about discipline. Traders who traded faster and avoided riding large losses were more successful later, even though Locke and Mann found little evidence that holding losers was immediately costly within the same period.
For an active trader, the disposition effect shows up as three habits.
- Taking profits early because an open gain already feels owned.
- Holding losers past the planned exit because closing them makes the loss official.
- Adding to a loser to lower the average price, which raises both the size and the risk of the position at the worst moment.
Related lesson: Why traders hold losers
The Fear of Realizing a Loss
The fear of realizing a loss rests on a mental trick. While the position is open, the loss feels provisional. It could still come back. The moment you close it, it becomes a fact with a number attached.
The trick does not change the account. Investor.gov's stocks FAQ is direct about this: you can lose money you invest in stocks, and if you sell shares below the price you paid, you lose money on the sale. The share price fell before the sale. The sale only recorded it.
Futures make the point even harder to ignore. The CFTC's guide to futures basics notes that customer accounts are adjusted to reflect each trading day's market value at the close, so an open futures loss is already reflected in the account every day. The same guide warns that many individuals lose all of their money and can be required to pay more than they invested.
So what happens if you lose money in stocks? The value of the position is lower whether you sell or not. Selling turns a paper loss into a realized one, and holding keeps the same money exposed to the next move in either direction. The real question is never "should I take the loss" but "would I buy this position today, at this price, with this risk".
That question is the cleanest test of the fear. If the answer is no, the only reason left to hold is that selling would hurt, and that is not a trading reason.
Why Loss Aversion Moves Your Stop
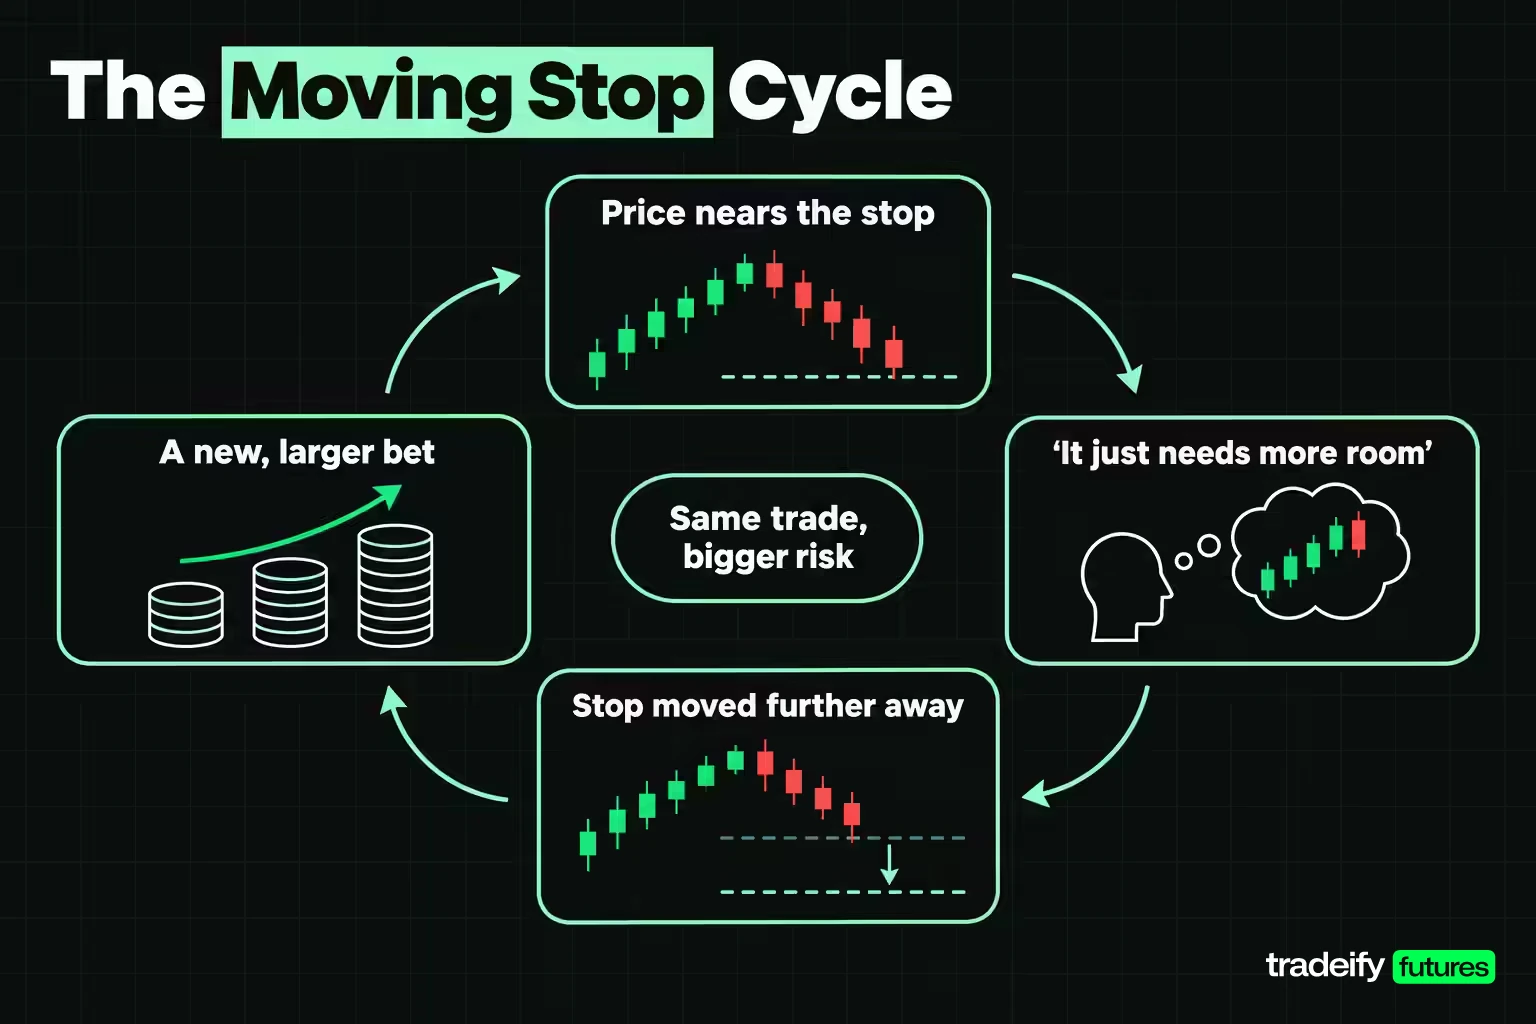
Loss aversion moves your stop in small, reasonable-sounding steps, which is why traders hold losing positions far longer than they plan to. Each step has a story.
- "The stop was too tight." Sometimes true. The test is whether you judged the level before the entry or only after price came close to it.
- "It just needs a little more room." That is a probability claim with no probability attached.
- "Price is near support." That turns a risk rule into a forecast, and the forecast was not part of the plan.
- "Adding here lowers my average." It also makes the position bigger at the point where the original idea is failing.
All four share one arithmetic error. A wider stop feels like a delay, but it is a new, larger bet placed on the same position.
On the E-mini S&P 500, each index point is worth $50. A 40-point stop on one contract risks $2,000. Moving it to 55 points makes the risk $2,750, which is $750 more, or 37.5% more risk than you chose. On one Micro E-mini at $5 per point, the same move takes risk from $200 to $275. Nobody decided to risk $2,750. The position decided.
There is one honest exception. A wider stop can be the right stop. The difference is timing: choosing 55 points before the entry and sizing down to match is a plan, while discovering 55 points after the drawdown starts is the bias.
Related lesson: Where to place the stop in the first place
Measuring Loss Aversion on 20 Years of E-mini Futures
Measuring loss aversion in real price data means holding the entries fixed and changing only the exit behaviour. This illustrative study does that on the front-month continuous E-mini S&P 500 daily series (Yahoo Finance ES=F), using 5,031 sessions from September 18, 2006 to September 15, 2026.
The rule has six parts, stated in full so anyone with the same data can rebuild it.
- Signal. The session closes above the highest high of the prior 20 sessions. Long trades only.
- Entry. The next session's open.
- Risk unit (R). 1.0 times the 14-session Wilder average true range (ATR) on the signal session. The average stop distance was 38.06 points, the median 27.38 points, with a 5th percentile of 12.62 points and a 95th percentile of 92.60 points.
- Time cap. 20 sessions including the entry session, exiting at the 20th close.
- Fills. Inside a bar the stop is checked before the target, and an open beyond a level fills at the open.
- Costs. No commission or slippage, so every figure is gross.
The rule produced 590 signals, the first on October 16, 2006 and the last on August 13, 2026. Each signal is treated as its own trade. The study uses daily bars because they give a long, clean history. The behaviour being measured, moving a stop, is the same on a five-minute chart.
The Four Exit Behaviours Compared
The E-mini study ran four exit behaviours on the identical 590 signals.
- Planned. Stop at 1R, target at 2R.
- Early profit. Stop at 1R, target at 1R, the "take it before it disappears" habit.
- Widened once. Stop at 1R, but the first time price touches it, the stop is moved once to 1.5R. Target stays at 2R.
- No stop. Target at 2R, otherwise hold until the 20-session cap.
| Exit behaviour | Win rate | Average win | Average loss | Expectancy | Break-even win rate | Worst trade | Total at $250 risk |
|---|---|---|---|---|---|---|---|
| Planned | 40.34% | 1.85R | 0.99R | 0.154R | 34.93% | -1.21R | $22,710.98 |
| Early profit | 53.73% | 1.00R | 1.00R | 0.074R | 50.03% | -1.21R | $10,920.66 |
| Widened once | 48.81% | 1.82R | 1.47R | 0.135R | 44.72% | -2.27R | $19,888.62 |
| No stop | 71.69% | 1.68R | 2.86R | 0.395R | 62.98% | -24.25R | $58,316.09 |
Break-even win rate is the average loss divided by the sum of the average win and average loss. It tells you what share of trades must win for the rule to stop losing money, and it is the number loss aversion quietly moves.
Read the table honestly, because it does not flatter the obvious lesson. In this sample, the no-stop version made the most money. A long-only rule on an index that rose over two decades paid traders for holding losers more often than it punished them. That is exactly how the habit gets reinforced, and it is why the tails matter more than the totals.
The Widened Stop on 347 Trades
In the 20-year E-mini breakout study, the widened-stop version (stop moved once from 1R to 1.5R the first time price touched it) was triggered on 347 of the 590 trades, or 58.81%. A rule that allows one move away from the plan will use it most of the time, because price touches a 1R stop often.
Of those 347 trades, 50 went on to win. That is 14.41%, and those 50 are the trades a trader remembers. The other 297 lost, at an average of 1.49R instead of 1R.
On those 347 trades, the planned rule lost 347.45R and the widened rule lost 358.74R. The rescued winners did not pay for the bigger losses. The net cost was 11.29R, or $2,822.50 at $250 of risk per trade. Across the full sample, the average loss was 48.11% larger than the planned rule's and the total was 12.43% smaller.
The No-Stop Rule's Worst Loss in March 2020
In the same E-mini study, the no-stop version (2R target, otherwise held to the 20-session cap) won 71.69% of its trades and still needed 62.98% just to break even. Its 167 losses averaged 2.86R. Fifty-seven of them were worse than -3R, and 26 were worse than -5R.
The worst signal fired on February 12, 2020. The trade entered on February 13, 2020 at 3,381.25 and was still open at the 20-session cap on March 12, 2020, when it closed at 2,469.00. That is -912.25 points, or -24.25R. On one E-mini contract it is -$45,612.50, and on one Micro E-mini it is -$4,561.25. At its deepest, the position sat 938.75 points below entry.
At $250 of risk per trade, that single trade cost $6,062.07. A trader risking 1% per trade would have lost 24.25% of the account on one position. The five worst no-stop trades together came to -62.82R, which is 26.93% of everything the rule made in 20 years.
That is the real case against holding losers. The average looks fine until one trade takes a quarter of the account, and no backtest tells you when that trade is coming. An account with a hard drawdown limit could be closed by that one trade long before the average had a chance to show up.
Related lesson: How one large loss changes the odds of ruin
Cutting Winners Early and Overreacting to Volatility
Loss aversion has a winning-side habit too. When a trade moves in your favour, the open profit starts to feel like money you already have, and a pullback feels like a loss of that money. The result is closing winners early and exiting in a panic when volatility spikes.
This guide's 20-year E-mini breakout study (ES=F daily, 590 signals) measures the cost with an early-profit version of the same rule. Taking profit at 1R instead of 2R raised the win rate from 40.34% to 53.73%, which feels better trade by trade. But it also raised the break-even win rate from 34.93% to 50.03%, and the total fell from $22,710.98 to $10,920.66 at $250 of risk. That is 51.91% less money from the same entries.
Volatility makes the urge stronger. Investor.gov notes that large company stocks as a group have lost money on average about one out of every three years, so sharp down moves are a normal part of holding risk. Panic selling into a fast drop, or tightening a stop to breakeven the moment price wobbles, is the same bias in a different costume: you are paying to stop feeling the swing.
A short rule handles most of it. Decide before entry which of two exits applies, the planned target or a planned trailing method, and treat any exit outside those two as a journal event to review rather than a trade decision.
A Loss Aversion Worked Example on One E-mini Contract
This loss aversion worked example uses round, illustrative prices on one E-mini S&P 500 contract at $50 per point.
- You buy at 6,000.00 with a stop at 5,960.00, a 40-point stop and $2,000 of risk.
- Price drops to 5,972.00, 12 points above the stop. Nothing about the setup has changed, but the stop now feels close.
- You move the stop to 5,945.00. Risk on the same contract is now 55 points, or $2,750.
- Price hits 5,945.00. The loss is $2,750 instead of $2,000.
On a $20,000 account, the planned loss is a 10% drawdown, and you need $2,000 back, which is 11.11% of the $18,000 left. The moved-stop loss is a 13.75% drawdown, and getting back needs 15.94% of the $17,250 left. The larger the loss, the faster the required recovery climbs.
| Drawdown | Gain needed to recover |
|---|---|
| 5% | 5.26% |
| 10% | 11.11% |
| 20% | 25.00% |
| 25% | 33.33% |
| 33% | 49.25% |
| 50% | 100.00% |
The same move on one Micro E-mini takes the loss from $200 to $275. The percentage damage to a $2,000 account would be identical, which is why smaller contracts do not fix the bias. They only shrink the dollar figure.
Related lesson: The arithmetic of getting back to even
Recognizing Loss Aversion in Your Trade Journal
Recognizing loss aversion in yourself is hard in the moment and easy in a journal, because the bias leaves the same fingerprints every time. Most of them come from fields you probably already record.
| Journal check | How to calculate it | What points to loss aversion | E-mini study value (ES=F daily, 2006 to 2026) |
|---|---|---|---|
| Hold time gap | Median bars or minutes held for winners and for losers | Losers held longer than winners | No stop 15 vs 20 sessions |
| Average loss size | Average losing trade divided by planned risk | Average loss well above 1R | Widened 1.47R vs planned 0.99R |
| Stop changes | Final stop distance compared with initial stop distance | Final stop further from entry than initial | 347 of 590 trades |
| Break-even gap | Your break-even win rate against your actual win rate | A high win rate with a thin margin | No stop 71.69% vs 62.98% |
| Early exits | Exits before target or planned trail | Many small wins and full-size losses | Early profit 53.73% vs 50.03% |
The hold-time check is the quickest. In this guide's 20-year E-mini breakout study (ES=F daily, 590 signals), the planned rule held winners for a median 11.5 sessions and losers for 4, which is what a working stop looks like. The widened rule held winners 12 sessions and losers 7. The no-stop rule held winners 15 sessions and losers 20. When losers outlast winners in your own journal, the stop is not doing its job.
A regular review keeps the check honest. Once a week, pull every losing trade, compare the initial stop with the final stop, and count how many moved away from entry. Once a month, recompute the break-even win rate. One rough week is not a verdict, but a rising average loss across a month usually is.
Related lesson: What to record in each trade
Trading Rules and Guardrails Against Loss Aversion
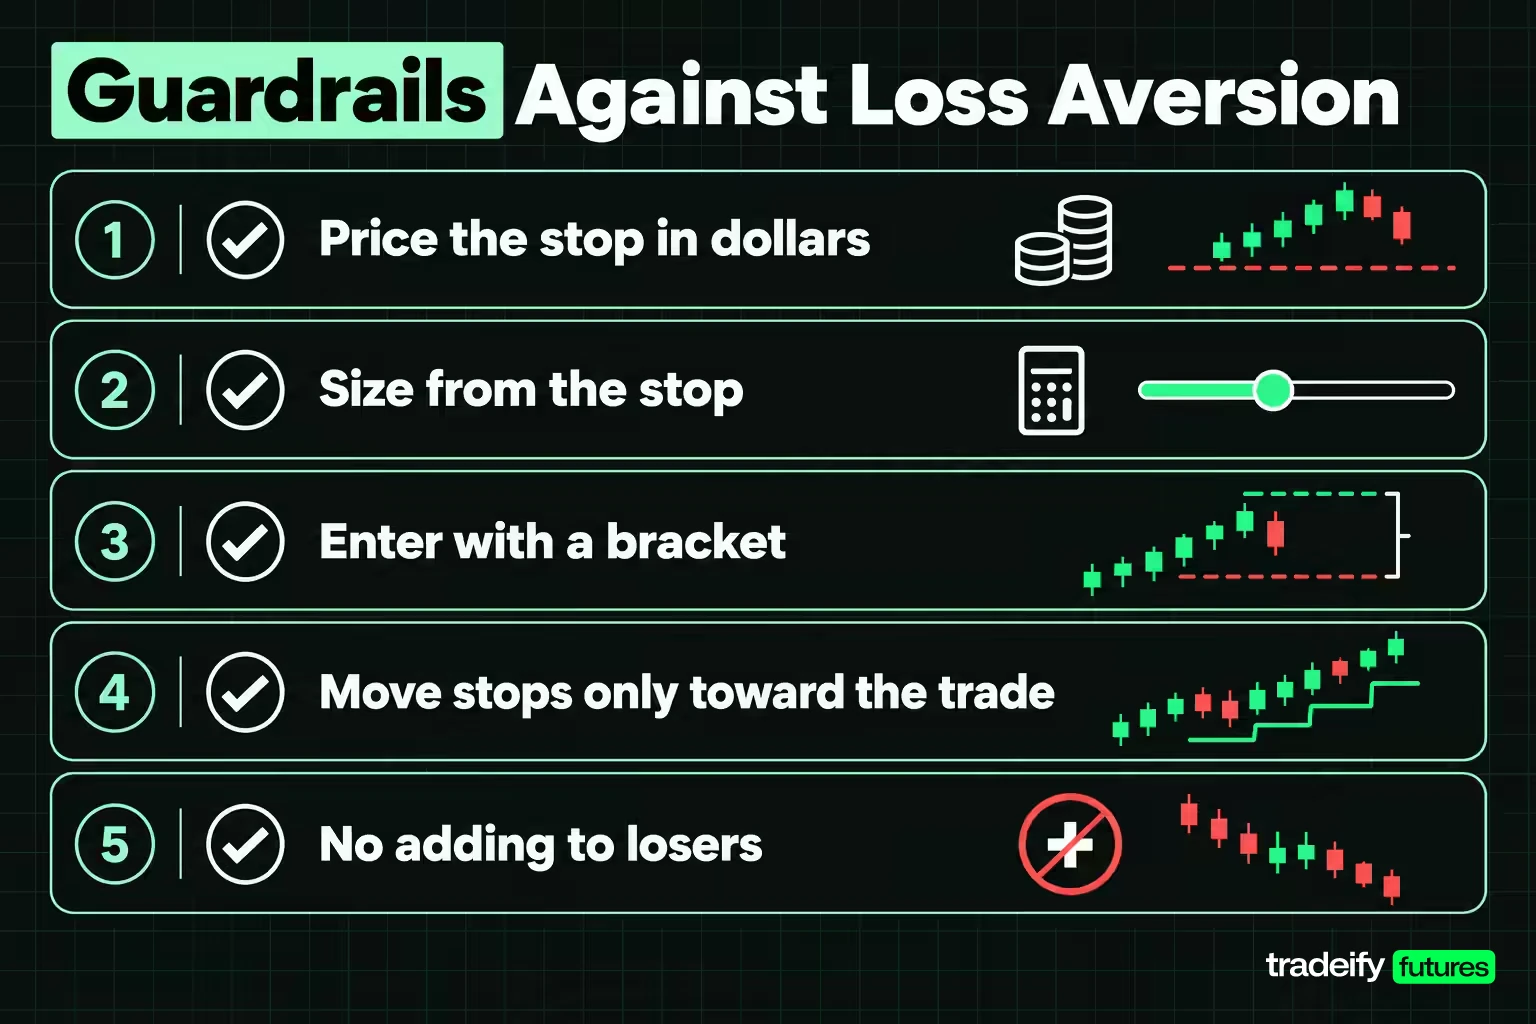
Trading rules work against loss aversion because they move the decision to a moment when no loss exists yet. The disciplined approach is not about willpower in the trade. It is about leaving as little to decide in the trade as possible.
These guardrails do most of the work.
- Price the stop in currency before entry. "40 points" is abstract. "$2,000 on one ES" is not, and it makes the size decision obvious.
- Size from the stop, not the other way round. Fix the dollar risk first, then set the number of contracts that keeps a full stop-out inside it.
- Enter with a bracket. A stop and target placed as one order (an OCO or bracket) means the stop exists before the first tick moves against you.
- Use a one-way stop rule. A stop may move toward the trade, to lock in profit or reduce risk, but never away from it. Write that sentence into the plan.
- No adding to losers. If a position is not working, it does not get bigger.
- Cap the day. A daily loss limit in dollars, set in the platform where possible, stops one bad trade becoming three.
The risk management payoff is easiest to see in dollars. In this guide's 20-year E-mini breakout study, at $250 of risk per trade, the planned rule's average loss was $248.35. The widened-stop average loss was $367.82, and the no-stop average loss was $714.05. Same entries, same market, three very different risk budgets.
These rules will not make every trade a winner. The planned rule still lost on most of its trades. What they do is keep each loss the size you agreed to, which is the only part of a losing trade you control.
Related lesson: Setting position size from the stop
Managing Emotions When Loss Aversion Kicks In
Managing emotions when loss aversion kicks in starts with naming them, because the feelings arrive before the reasoning does. Most traders recognise the sequence: a tight chest as price nears the stop, a sudden interest in support levels you were not watching, then the hand on the mouse.
None of that is a character flaw. It is the asymmetry the research measures, showing up in a body. The goal is not to stop feeling it. It is to make sure the feeling cannot place orders.
A short routine helps.
- Notice the trigger. The urge to touch the stop is the signal. Treat it as information that the bias is active, not as analysis.
- Ask the purchase question. Would you open this trade now, at this price, with this stop? If not, the plan already gave the answer.
- Pause before any change. Give yourself a fixed delay, such as one full bar, before modifying a stop. Most urges fade inside it.
- Step away after the stop fills. A filled stop is the plan working. Leaving the screen for a few minutes keeps the next trade from becoming a repair job.
- Write one line. Record what you felt and what you did. Over a month, those lines show your patterns more clearly than memory can.
If losses are leaving you angry or desperate to win the money back, that is a separate problem from loss aversion and deserves its own rules.
Related lesson: Stopping the trade after a loss
Overcoming Loss Aversion Step by Step
Overcoming loss aversion is less about removing the bias than building a process it cannot get through. The order matters, because each step depends on the one before it.
- Measure your baseline. Pull your last 50 to 100 trades and calculate average loss in R, the hold-time gap and the share of trades with a widened stop.
- Write the exit rule. State the stop method, the one-way stop rule and the profit-taking method in one paragraph you can read in ten seconds.
- Automate the stop. Place every stop as a working order with the entry, never as a mental level.
- Fix risk per trade in currency. Choose a dollar amount small enough that a full stop-out does not change how you trade the next setup.
- Review weekly. Count stop moves away from entry. The target number is zero.
- Judge the rule on a sample. Do not change the stop method after one bad week. Change it after a measured review of enough trades.
Professional traders follow a version of the same process. Locke and Mann open their paper with a Chicago Board of Trade member's line that the first loss is the best loss, and their data backs it: floor traders who avoided riding large losses were more successful later. Experience alone does not remove the bias, though. In a 2005 Journal of Finance experiment, Michael Haigh and John List found that Chicago Board of Trade traders showed myopic loss aversion to a greater extent than students. The professionals felt the pull more. What sets disciplined traders apart is that their exits do not depend on how they feel.
Related lesson: Trading psychology and the rules that hold
Myopic Loss Aversion and Judging a Sample of Trades
Loss aversion gets stronger the more often you look at results. Shlomo Benartzi and Richard Thaler called this myopic loss aversion in a 1995 Quarterly Journal of Economics paper. They combined loss aversion with frequent evaluation and found that investors behave as if they judge their portfolios about once a year, which makes stocks feel riskier than their long-run record suggests.
Traders evaluate far more often than once a year. Many look after every trade, and some after every tick. Each check is a fresh chance to register a loss, so each check feeds the urge to act.
The fix is to change the unit you judge. A single trade is noise. A sample of trades is evidence. In this guide's 20-year E-mini breakout study (ES=F daily, 590 signals), the planned rule with a 1R stop and 2R target earned an expectancy of 0.154R per trade. At that rate, an extra 0.5R lost by moving a stop takes about 3.2 trades to earn back. A -24.25R loss, the no-stop rule's worst, takes about 157 trades.
That is the long view that matters for active traders. It is not "hold everything for years". It is "judge the rule over enough trades that one loss stops feeling like a verdict". Reviewing results weekly instead of trade by trade is one of the simplest ways to do it.
Loss Aversion in Trading FAQ
Which statement best describes loss aversion?
Loss aversion means a loss feels more painful than an equal gain feels good, so people act to avoid losses even when the odds favour accepting them. A 2024 meta-analysis by Brown, Imai, Vieider and Camerer put the average ratio near two to one. In trading, it shows up as holding losers and closing winners early.
Is loss aversion the same as risk aversion?
No. Risk aversion is a general preference for certainty over uncertainty. Loss aversion is asymmetric: people become cautious when they are ahead and willing to gamble when they are behind. That switch is what turns a planned stop into a moving one.
What happens if you lose money in stocks?
The position is worth less whether you sell or not, and selling below your purchase price records the loss. A share bought outright cannot fall below zero, so the loss stops at what you paid, while borrowed money or futures can cost more than you put in. The useful question is whether you would buy the position today at its current price.
Can loss aversion ever help a trader?
It can when it is pointed at the plan rather than the trade. Disliking losses is a good reason to set a firm stop, size small and cap the day. It becomes harmful when the same feeling is used to avoid taking the loss the plan already accepted.
Does experience get rid of loss aversion?
Not on its own. Locke and Mann found professional futures floor traders still held losers longer than winners, and Haigh and List found Chicago Board of Trade traders showed more myopic loss aversion than students. Experience helps when it produces rules that remove the decision from the moment.
The One Loss Aversion Rule Worth Keeping
The one loss aversion rule worth keeping is short. Decide the stop and its dollar risk before the entry, and after that, only move the stop toward the trade.
Everything in this guide supports that rule. The Brown, Imai, Vieider and Camerer meta-analysis says losses count about twice as much as gains. Odean's disposition-effect study shows that weight keeps losers open. This guide's 20-year E-mini breakout study shows what it costs in practice: an average loss 48.11% larger when the stop is widened once, and a single no-stop trade at -24.25R. Your next step is simple and specific. Open your journal, list your last 20 losing trades, and mark every one where the final stop was further from entry than the first.
On our accounts, every position is closed by 4:45 PM ET, so a losing trade cannot be carried overnight in the hope it comes back. Our Help Center's order-types guide also says never to enter a position without a stop. Traders on Tradovate can set their own daily and weekly loss limits in Risk Settings, and Tradesea offers personal lockouts that block new orders for a set time after a rough session.
This article is for education only and is not investment advice. Futures trading uses leverage and can lose more than expected, including more than the money deposited. The E-mini figures come from a historical study of one rule on one market, without commissions or slippage, and they do not predict future results. Evaluation and funded accounts are simulated, and results in them can differ from live trading.


