



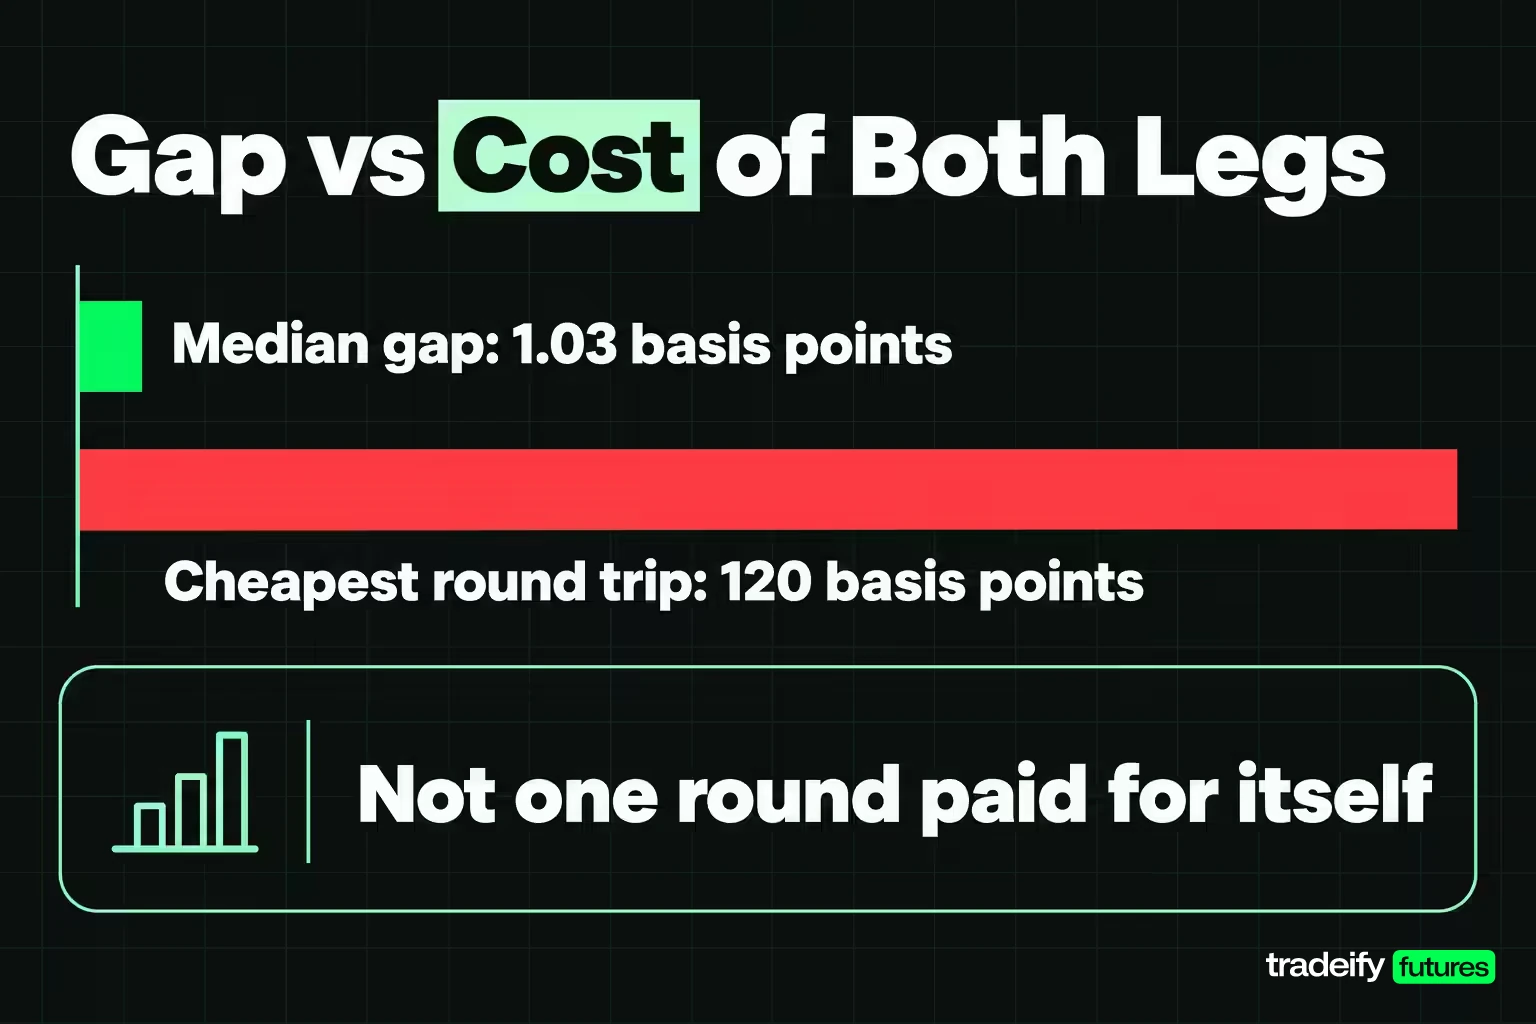
TL;DR: Arbitrage trading means buying an asset where it is cheap and selling it where it is dear at the same moment, so direction stops mattering. The real decision is whether the gap beats the cost of both legs. In a 120-round crypto sample on November 5, 2026, the median cross-exchange gap was 1.03 basis points. The cheapest entry-tier round trip cost 120 basis points, so not one round paid for itself. Most retail traders meet arbitrage as a lesson in costs, not as a strategy they can run.
Arbitrage trading gets sold as the one kind of trading where you don't have to predict anything. That part is true. The two legs offset, so the market can go wherever it wants. What the pitch leaves out is that you pay for both legs, and the price gap you capture is usually smaller than the bill.
This guide covers the definition, the types and the strategies, then does the part most explanations skip. It measures a live gap across four crypto exchanges, prices the fees in the same unit, prices a three-leg loop from real quotes, and checks a futures basis trade against Treasury bills. You will see where arbitrage still works, who it works for, and what to take from it if you trade direction.
What Arbitrage Trading Is and Why the Gap Closes
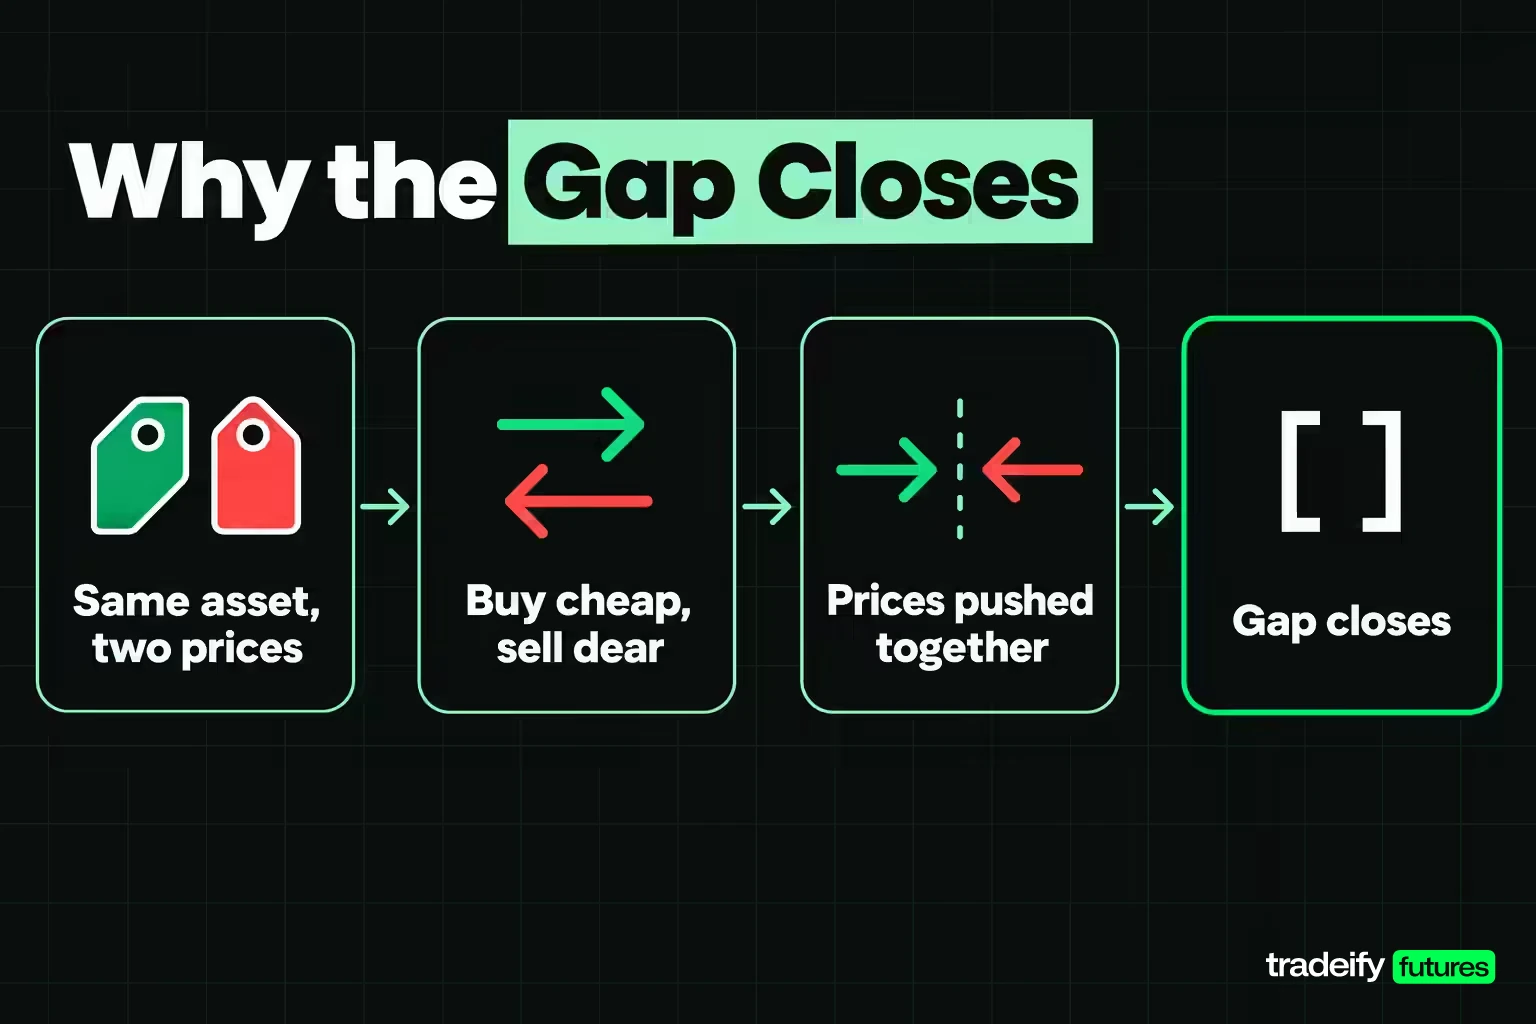
Arbitrage trading is the practice of taking advantage of a price difference for the same asset, or for assets with identical cash flows, in two or more places. You buy where it is cheaper, sell where it is more expensive, and the profit is the difference minus everything it cost to do both.
The idea rests on the law of one price. Two claims on the same thing should trade at the same price once costs are counted. When they don't, someone buys the cheap one and sells the dear one, and that act pushes the two prices back together.
That last point matters more than the definition. Arbitrage is self-erasing. Every trader who takes a gap is one reason the gap is smaller next time, so the gaps that survive are usually the ones that are expensive, slow or awkward to reach.
Three tests for real arbitrage
Before calling anything arbitrage, check three things.
- Both legs happen at the same moment. If one leg fills now and the other fills in ninety seconds, you are holding a directional position and hoping.
- The gap is bigger than the cost of both legs combined. Fees, spreads, transfer costs and financing all count. This is the test most write-ups skip.
- The size is real. A top-of-book quote is a promise about one small order, not about yours.
In academic finance, a true arbitrage has no state of the world where you lose money. In everyday trading the word stretches to cover trades that can lose, such as merger and statistical arbitrage. Keep that difference in mind whenever someone calls a trade risk-free.
Related lesson: Bid-ask spread
Types of Arbitrage and Who Can Realistically Run Them
Most explanations list the types of arbitrage as a flat menu. They are not equally open to everyone. The table sorts the main types by what they trade, how long the position lasts, and who realistically executes them.
| Arbitrage type | What is traded | Typical holding time | Main risk | Who realistically runs it |
|---|---|---|---|---|
| Spatial or inter-exchange | Same asset on two venues | Seconds | Second leg misses, transfer delay | Firms with inventory on both venues |
| Latency | Same asset, one feed slower than another | Milliseconds | Being the slow one | Co-located high-frequency firms |
| Triangular | Three currency pairs on one venue | Seconds | Three fees, quotes move mid-loop | Exchange-connected algorithms |
| Cash and carry | Spot asset versus dated future | Weeks to months | Margin calls, counterparty | Funds and desks with cheap financing |
| Index | Stock basket versus index future | Minutes to days | Basket execution, dividends | Bank and broker desks |
| Covered interest | Spot FX, forward FX and two interest rates | Months | Funding access, balance sheet cost | Banks |
| Merger or risk | Target stock versus deal price | Months | Deal breaks | Event-driven funds, some individuals |
| Statistical | Baskets that historically move together | Hours to weeks | Relationship breaks down | Quant funds |
| Fixed income relative value | Bonds versus bond futures or swaps | Weeks to months | Spreads widen under leverage | Hedge funds |
Which arbitrage trading types are open to individuals
The top half of that table needs an industrial setup. Securities regulators describe high-frequency trading by very fast order generation, co-location next to the exchange, individual data feeds, very short holding periods and many cancelled orders. That is the competition for any gap that lasts seconds.
The bottom half is a different trade wearing the same word. Merger arbitrage is a bet that a deal closes. Statistical arbitrage is a bet that a historical relationship holds. Both are legitimate, both are called arbitrage, and neither is riskless.
Arbitrage Trading Strategies From Pure to Risk Arbitrage
Arbitrage trading strategies sit on a spectrum. At one end the profit is locked the moment both legs fill. At the other end the profit depends on something that has not happened yet.
Pure arbitrage
Pure arbitrage buys and sells the same asset at the same time in two places. If both legs fill at the quoted prices, the profit is fixed. The strategy question is purely operational: can you fill both legs, at size, before anyone else, for less than the gap?
Convergence and carry arbitrage
Convergence trades lock in a known difference between two linked prices and hold until the prices meet. Cash and carry is the classic case. You buy the asset, sell a dated future against it, and collect the difference at expiry when the future settles to the spot price.
The profit is known at entry, but the position has to survive until expiry. Margin calls on the short future, a financing rate that rises, or a counterparty that fails can all hit before convergence arrives.
Relative value and statistical arbitrage
Relative value trades buy one asset and sell a similar one that looks mispriced against it. Statistical arbitrage does the same across many instruments using a model of how they usually move together. Neither has a fixed payoff. They are bets on a relationship, sized and hedged to keep market direction out of the result.
The cautionary case is Long-Term Capital Management. According to the Federal Reserve's history of the episode, the fund exploited temporary price differences between similar securities with a market-neutral design. It held about $30 of debt for every $1 of capital at the end of 1997. In 1998 its spreads diverged instead of converging, it lost 44% of its value in August alone, and 14 banks and brokerage firms put in $3.6 billion to allow an orderly wind-down.
The lesson is not that convergence trades fail. It is that a small, reliable edge invites large size, and large size turns a temporary divergence into a forced exit.
Risk arbitrage
Risk arbitrage, usually called merger arbitrage, buys the target of an announced deal below the offer price. The profit depends on the deal closing. It has the shape of arbitrage, two prices that should converge, but the outcome is an event bet.
Related lesson: Statistical arbitrage
A Measured Crypto Arbitrage Gap Across Four Exchanges
Crypto is where most people first try arbitrage trading, because the same coin trades on dozens of exchanges that do not share an order book. To see what the gap actually looks like, this guide ran its own measurement.
How the crypto gap was measured
A script queried the public top-of-book quotes for BTC/USD and ETH/USD on Kraken, Coinbase, Bitstamp and Gemini. Every venue was queried in parallel threads in each round, and all requests in a round started and finished within a median of 0.35 seconds. It ran 120 rounds, about 10 seconds apart, from 08:24:46 to 08:44:50 UTC on November 5, 2026, with zero failed requests. Bitcoin traded around $80,521 and ether around $2,423 during the window.
For arbitrage trading the only number that matters is the gap you could capture, so each round took the highest bid anywhere and the lowest ask anywhere and priced the difference against their midpoint in basis points. One basis point is 0.01%.
Crypto arbitrage gap results by pair
The headline result of this guide's own measurement is not subtle. In 120 of 120 BTC/USD rounds, the best bid and the best ask sat on different exchanges, and the consolidated book was crossed, meaning some exchange's bid was above another exchange's ask. ETH/USD was crossed in 119 of 120 rounds.
| Measure from this guide's November 5, 2026 sample | BTC/USD | ETH/USD |
|---|---|---|
| Rounds with best bid and best ask on different venues | 120 of 120 | 120 of 120 |
| Rounds with a crossed consolidated book | 120 of 120 | 119 of 120 |
| Median gap | 1.03 basis points | 1.11 basis points |
| Largest gap | 3.73 basis points | 3.47 basis points |
| Rounds with a gap above 2 basis points | 10 | 14 |
| Median gap in dollars per coin | $8.32 | $0.27 |
So the textbook arbitrage condition was there almost the whole time. It was also about one basis point wide, roughly $0.10 on every $1,000 traded. That is the number to hold onto.
Gemini held the best BTC bid most often (59 rounds) and Coinbase the best BTC ask (67 rounds). Pause on that pattern. A crossed book that persists for twenty minutes is partly a sign that some quotes update more slowly than others. If it were free money, it would not still be sitting there.
The size behind those quotes was small too. The smaller side of the top of book on Coinbase BTC/USD had a median of $1,250, and on Gemini $500. Anything larger walks into the next price level, where the gap is thinner or gone.
The fee ladder a crypto arbitrage gap has to clear
A gap in basis points only means something next to a cost in basis points, and fees are where most arbitrage trading ideas end. These are the published spot taker fees, read from each exchange's schedule on November 5, 2026. Coinbase is in the quote sample but not in this table, because its Advanced fee tiers sit behind a sign-in.
| Exchange | Entry-tier taker fee | Top-tier taker fee | Top-tier maker fee |
|---|---|---|---|
| Kraken Pro spot | 0.80% | 0.05% | 0.0% |
| Gemini ActiveTrader | 1.200% | 0.020% | 0.000% |
| Bitstamp | 0.40% | 0.03% | 0.00% |
At entry tiers, the cheapest two-exchange round trip (Bitstamp 0.40% plus Kraken 0.80%) costs 120 basis points. The median BTC gap covered 0.86% of that. None of the 120 rounds came close.
At the top published tiers, which need hundreds of millions of dollars in monthly volume, the cheapest taker pair (Gemini 0.020% plus Bitstamp 0.03%) costs 5 basis points. The median gap covered about a fifth of it, and no round cleared it. Only with a resting maker order at 0.000% on one leg and a 0.020% taker on the other, a 2 basis point cost, did any rounds clear: 10 of 120 for BTC and 14 of 120 for ETH, each by less than two basis points.
One crypto arbitrage round in dollars
Here is the median BTC round, as of 08:39:37 UTC on November 5, 2026. Gemini's bid was $80,524.43 and Kraken's ask was $80,516.10, a gap of $8.33 per bitcoin, or 1.03 basis points.
| Line item | Entry-tier taker | Top-tier taker |
|---|---|---|
| Gross gap per bitcoin | $8.33 | $8.33 |
| Buy leg fee at Kraken | $644.13 | $40.26 |
| Sell leg fee at Gemini | $966.29 | $16.10 |
| Total fees | $1,610.42 | $56.36 |
| Net per bitcoin | -$1,602.09 | -$48.03 |
That is the arithmetic behind the usual line that arbitrage now belongs to firms. People usually blame speed. Speed matters, but the fee tier matters more. The firms that take these gaps pay near zero to trade, often earn maker rebates, and keep inventory on both exchanges so nothing has to move between them.
Two honest limits on this measurement. It is twenty minutes on one morning, so it says nothing about how the gap behaves in a fast market. And REST quotes are snapshots, so a gap that existed in the data may not have been fillable.
Triangular Arbitrage Priced on One Exchange
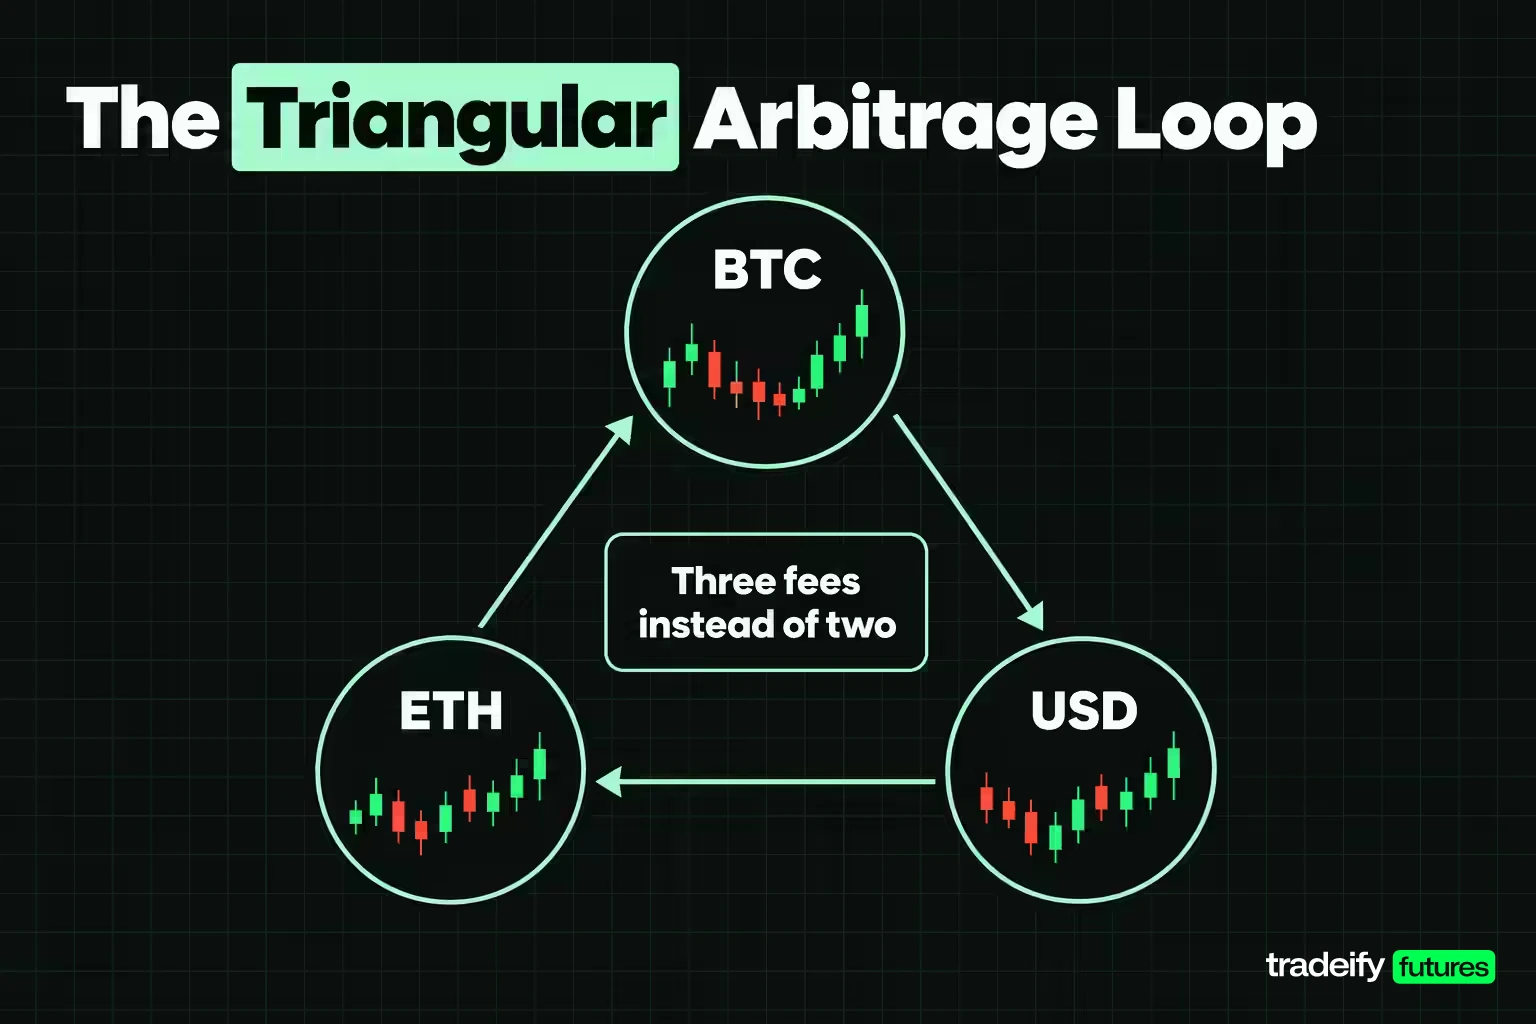
Triangular arbitrage uses three exchange rates instead of one asset in two places. You convert currency A into B, B into C, and C back into A. If the rate implied by two of the pairs disagrees with the third pair's own quote, the loop ends with more of A than it started with.
For arbitrage trading on a single venue, the appeal is that everything happens on one exchange, so nothing has to be transferred. The catch is three fees instead of two.
A real triangle on Kraken
The same sampling run priced the loop BTC to USD to ETH to BTC on Kraken's own three books, BTC/USD, ETH/USD and ETH/BTC, in whichever direction paid more each round. Every sell used the bid and every buy used the ask.
In the first round, 08:24:46 UTC, Kraken's BTC/USD and ETH/USD books implied an ETH/BTC rate of 0.030097, while the ETH/BTC book's own midpoint was 0.030092. The better loop turned 1 BTC into 1.00006287 BTC, a gain of +0.63 basis points before any fee.
| Triangular loop measure | Kraken | Coinbase |
|---|---|---|
| Rounds priced | 120 | 120 |
| Median loop result before fees | -0.11 basis points | -0.24 basis points |
| Rounds positive before fees | 53 | 39 |
| Best round before fees | +2.36 basis points | +1.36 basis points |
Now add the fees. Three Kraken taker legs cost 240 basis points at the entry tier and 15 basis points at the top published tier. The best single round, +2.36 basis points, was not within reach of either.
That is not triangular arbitrage being broken. It is the loop being priced correctly. An exchange that quotes three interlocking markets has market makers keeping them aligned, and the median gap between the implied and quoted ETH/BTC rate was 0.73 basis points. The ETH/BTC book's own spread had a median of 1.66 basis points, wider than the mispricing it was supposed to reveal.
Related lesson: How trade execution works
Forex Arbitrage and Covered Interest Parity
Forex arbitrage is where triangular arbitrage got its name, and it is the market where arbitrage trading has been competed hardest. Currency arbitrage comes in two main forms.
Triangular forex arbitrage with round numbers
Take illustrative rates of EUR/USD 1.1000 and GBP/USD 1.3000. Those two quotes imply EUR/GBP should be 1.1000 divided by 1.3000, about 0.8462. Now suppose a dealer quotes EUR/GBP at 0.8450, cheaper than implied.
Starting with $1,000,000:
- Buy pounds at 1.3000 and receive £769,230.77.
- Buy euros with those pounds at 0.8450 and receive €910,332.27.
- Sell the euros for dollars at 1.1000 and receive $1,001,365.50.
The loop makes $1,365.50, about 13.7 basis points, before spreads. In the real interbank market a mismatch that size is closed by algorithms almost as soon as it appears, which is why textbook FX triangles are teaching tools rather than retail opportunities.
Covered interest arbitrage
Covered interest parity ties four prices together: the spot exchange rate, the forward exchange rate and the interest rate in each currency. A forward contract removes the currency risk, so the return from depositing in either currency should match.
With illustrative numbers, spot EUR/USD at 1.1000, a dollar rate of 4.00% and a euro rate of 2.00%, the one-year forward should sit near 1.1000 × 1.04 ÷ 1.02, about 1.1216. If the quoted forward strays far enough from that level, a bank can borrow in one currency, convert, lend in the other and lock the forward, earning the difference.
In practice this is bank business. It needs cheap funding in both currencies and balance sheet to hold the position, and the deviations that persist tend to reflect those funding costs rather than free money. Currency futures carry the same relationship. A futures price above spot reflects the rate difference between the two currencies, not a forecast.
Futures Arbitrage Examples From Cash and Carry to Index Arbitrage
Futures give arbitrage trading its slower, more readable form. The gap is not a quote disagreement that lasts a second. It is a structural difference between a futures price and the spot price that must close by expiry.
A measured bitcoin cash and carry
At 08:27:49 UTC on November 5, 2026, Kraken's spot BTC/USD was $80,541.20 bid and $80,541.30 ask. Its dated bitcoin future expiring March 26, 2027, 141 days away, was $82,263 bid and $82,296 ask.
Buying spot at the ask and selling the future at the bid locks a basis of $1,721.70, or 2.14% over 141 days. Annualized, that is 5.53%. As of November 4, 2026, the 26-week Treasury bill yielded 4.29% on a coupon-equivalent basis and the 17-week bill 4.21%.
| Cash and carry line | Entry-tier fees | Top-tier fees |
|---|---|---|
| Gross basis over 141 days | 2.14% | 2.14% |
| Fees (spot in, spot out, futures leg) | 1.65% | 0.1125% |
| Net over 141 days | 0.49% | 2.03% |
| Net annualized | 1.26% | 5.24% |
| 26-week Treasury bill, November 4, 2026 | 4.29% | 4.29% |
At entry-tier fees, the trade earns well under a Treasury bill. At top-tier fees it earns about a point more, before the cost of the margin posted on the short future and any settlement fee. That extra point is payment for exchange counterparty risk and for the chance of a margin call if bitcoin rallies hard before March.
Why short-dated contracts mislead
Kraken's shorter-dated bitcoin futures, in the same November 5, 2026 snapshot as the March contract, show how annualizing flatters thin contracts. The December 25, 2026 contract had a $365 spread, 44.95 basis points. Its midpoint basis annualized to 6.01%, which looks better than the March contract, but the price you could actually trade annualized to 4.36%. The November 27, 2026 contract had a $544 spread, and its executable basis was negative, -4.17% annualized.
Always price a basis trade at the bid and ask you would actually hit. A midpoint basis is a number you cannot trade.
Index arbitrage on S&P 500 futures
Index arbitrage applies the same logic to stock index futures. An E-mini S&P 500 future (ES) is worth $50 times the index. Its fair value is roughly the index plus the cost of financing the stocks until expiry, minus the dividends the stocks would pay.
With illustrative numbers, the index at 7,000, financing at 4.00%, a dividend yield of 1.20% and 60 days to expiry, the net carry is 7,000 × 2.80% × 60/365, about 32.2 points. Fair value is about 7,032.2. If ES traded at 7,040, it would be 7.8 points rich, about $389 per contract.
An index arbitrage desk would sell the future and buy all 500 stocks in index weights. In reality, commissions, market impact on 500 stock orders and borrowing costs create a band around fair value where nothing is worth doing. The future drifts inside that band most of the time, and desks with the cheapest execution define how wide it is.
Commodity and bond arbitrage versions
Physical commodities run cash and carry with storage and insurance in the cost line. In a normal market a commodity future sits above spot by roughly financing plus storage, and when it sits further above, a holder of the physical can sell the future and deliver. Bond markets run the Treasury basis trade, buying cash bonds and selling bond futures. Both work for institutions that can finance cheaply and hold for weeks, and both can unwind violently when funding tightens.
Related lesson: Basis in futures
Merger Arbitrage and the Deal Spread
Merger arbitrage, also called risk arbitrage, is the form of arbitrage trading most open to individuals. It starts when a company announces it will buy another. The target's stock usually jumps toward the offer price but stops short of it. That shortfall is the deal spread.
A cash deal in round numbers
Suppose an acquirer offers $50 cash per share for a target that traded at $40 before the news. After the announcement the target trades at $48.50.
- Buy at $48.50 and the deal closes: you collect $1.50, or 3.09%.
- If closing takes six months, that is about 6.2% annualized.
- If the deal breaks and the stock falls back to $40, you lose $8.50.
Read that the other way round. You are risking $8.50 to make $1.50. The trade only pays over time if deals like this close more than 85% of the time (8.50 divided by 10.00), before costs. That is why merger arbitrage is closer to underwriting an insurance policy than to classic arbitrage. Many small gains, then occasionally a large loss.
Stock-for-stock deals
When the acquirer pays in its own shares, the arbitrageur buys the target and short-sells the acquirer at the exchange ratio, which locks the spread against market moves. The remaining risk is the same: regulators, financing or shareholders can stop the deal.
How to Find Arbitrage Opportunities Before Trading Them
Finding arbitrage opportunities is the easy part. Scanners and exchange APIs will show you gaps all day. Proving a gap is tradable is where most ideas die. Walk any idea through these six checks in order, and treat a single no as a reason not to trade, not a reason to size smaller.
- Quote both legs at the same moment. Query in parallel and timestamp every quote. A gap built from prices seconds apart is a chart artifact.
- Price every cost in the same unit as the gap. Convert taker or maker fees, spreads, transfer fees and financing into basis points and add them up. In this guide's November 5, 2026 crypto sample, a 1.03 basis point median gap met a 120 basis point entry-tier cost.
- Check the size at the quote. Compare the top-of-book size with the size you need. If you need $10,000 and the quote shows $500, price the second and third levels.
- Map the settlement path. Know how the asset or cash gets from one leg to the other, how long it takes, and what it costs. If inventory has to move, the gap has to survive the transfer.
- List what breaks the hedge. Write down what happens if one leg fills and the other doesn't, if margin is called, or if a counterparty freezes withdrawals.
- Paper-run it before risking money. Log every signal, the price you would have filled at and the full cost for a meaningful sample. A gap that only clears costs on paper at the midpoint is not an opportunity.
This is also the honest answer to whether arbitrage trading is still profitable. It is, for participants whose costs sit below the gap. For anyone paying retail fees, the crypto gaps measured on November 5, 2026 were one to two orders of magnitude too small.
Related lesson: Commission-adjusted futures breakeven
Arbitrage Trading Platforms and Automation
Arbitrage trading platforms fall into three groups, and the group you need depends on how long the gap lasts.
- Exchange APIs and direct feeds. Every serious arbitrage system reads quotes and sends orders through APIs, not screens. Firms competing on speed add co-location and direct exchange feeds.
- Scanners. Scanner tools and dashboards list price differences across venues. They are useful for research and for seeing that gaps exist. They rarely show the size behind a quote or your real fee tier.
- Execution bots. Bots fire both legs automatically. Off-the-shelf arbitrage bots usually run on public data with the same latency as everyone else using them, so they compete for the same small gaps.
Manual arbitrage trading rarely survives contact with these tools. The quotes in this guide's sample took about a third of a second just to collect, and a gap of one basis point is invisible on a normal price ladder. By the time a person sees it and clicks twice, an algorithm has taken it or the quote has moved.
Automation also adds its own risks: a bug that sends one leg and not the other, an API that rate-limits you mid-trade, or a bot vendor that misrepresents its results. Test any automated arbitrage system on a small size and log every fill.
Related lesson: High-frequency trading
Arbitrage Trading Risks That Break the Hedge
Arbitrage trading risks rarely come from market direction. They come from the hedge failing to hold. These are the common failure modes and the early signs of each.
| Risk | What happens | Early warning | What limits it |
|---|---|---|---|
| Execution or leg risk | One leg fills, the other misses or fills worse | Thin top-of-book size | Simultaneous orders, small size, limit prices |
| Stale quotes | The gap was never real | Gap persists for minutes | Timestamped, parallel quotes |
| Transfer delay | Price moves while assets move between venues | Withdrawal queues, network congestion | Pre-positioned inventory on both sides |
| Counterparty | A venue freezes withdrawals or fails | Unusual withdrawal delays | Spreading balances, limiting exposure per venue |
| Liquidity | Exit costs far more than entry | Spreads widening across all venues | Trading only deep markets |
| Leverage and margin | A temporary divergence forces liquidation | Margin usage rising on the hedge leg | Low leverage, cash buffer for margin calls |
| Convergence failure | Prices do not meet when expected | Model relationship drifting | Hard limits on size and holding time |
| Rule risk | The trade breaks a venue or account rule | Terms that mention delays or correlated positions | Reading the rules before trading |
Leverage deserves its own warning. Arbitrage trading returns per dollar are small, so the temptation is to borrow and scale. Long-Term Capital Management was running about $30 of debt per $1 of capital when its spreads diverged in 1998. A small edge times large leverage can produce a large loss from a move that would otherwise have been noise.
Related lesson: Risk of ruin
Is Arbitrage Trading Legal
Arbitrage trading is legal in most jurisdictions. Buying an asset in one market and selling it in another is ordinary market activity, and regulators generally see it as useful because it pulls prices together.
What gets prosecuted is what happens around the word. In February 2009 the SEC charged two men who had promised institutional investors, including educational institutions and public pension and retirement plans, that their money would run a stock index arbitrage strategy. According to the SEC, they misappropriated as much as $554 million of the $667 million invested. Arbitrage was the pitch, not the activity.
A few related activities are not arbitrage and can be illegal or against the rules:
- Trading on material nonpublic information is insider trading, whatever it is called.
- Placing orders to create a false price and trade against it is manipulation.
- Knowingly exploiting a platform's pricing errors or delayed feeds usually breaks the venue's terms, and many firms and exchanges reverse such trades or close accounts.
On suitability, pure arbitrage suits firms with low costs, fast systems and capital on several venues. Slower forms such as merger arbitrage are open to individuals but carry event risk. A strategy advertised as arbitrage that cannot show you the gap, the cost and the fill is a sales document. None of this is legal advice for your situation.
Arbitrage Trading Rules on Funded Futures Accounts
Funded futures programs and prop firms tend to restrict exactly the structures arbitrage depends on. Rules commonly prohibit opposite positions in closely related contracts, either in one account or spread across several. Many forbid exploiting delayed prices or platform errors, limit automated or high-frequency trading, and require positions to be flat by the session close. Read your own program's rules on correlated positions, automation and holding times before running any spread or arbitrage idea.
On our accounts, most arbitrage structures simply don't fit. We support CME Group futures plus some EUREX contracts and no cryptocurrency derivatives, including Bitcoin futures, so crypto arbitrage can't be traded with us. Opposing positions in two products from the same Product Group, such as long ES and short NQ, count as prohibited hedging in one account or across accounts. Every position closes by 4:45 PM ET, our Help Center bars knowingly exploiting delays or pricing discrepancies, and personal bots are allowed only if you own them exclusively and they are not high-frequency.
Arbitrage Trading FAQ
Is arbitrage trading still profitable?
Yes, for participants whose all-in cost sits below the gap, which mostly means exchanges' largest customers and market makers. In a 120-round sample this guide took on November 5, 2026, the median cross-exchange bitcoin gap was 1.03 basis points. The cheapest entry-tier two-exchange round trip cost 120 basis points, so retail arbitrage at those fees lost money every time.
Does crypto arbitrage still work in 2026?
The gaps still exist. In this guide's own sample of four exchanges on November 5, 2026, bitcoin's best bid and best ask were on different exchanges in 120 of 120 rounds. They were about one basis point wide, with roughly $500 to $1,250 at the top of the book, so they mainly pay traders on near-zero fee tiers with inventory already on both exchanges.
Is arbitrage trading risk-free?
No. It is risk-free only in the textbook case where both legs fill at once, at quoted prices, with no counterparty problem. Real trades carry leg risk, transfer delays, counterparty risk and margin risk, and leveraged convergence trades can fail badly.
What is regulatory arbitrage and how does it work?
Regulatory arbitrage is when firms use differences between regulatory regimes to cut costs or avoid stricter rules. They might restructure transactions, use financial engineering, or relocate activity to a friendlier jurisdiction. It is often legal, but regulators work to close the loopholes it relies on, and it has nothing to do with price gaps.
What is the 3-5-7 rule in trading?
The 3-5-7 rule says to risk no more than 3% of the account on one trade, keep total open risk at or under 5%, and look for winners of at least 7%. It is an informal heuristic, not a regulation, and versions differ. It has no special connection to arbitrage trading, so treat it as a starting point for your own risk limits.
Can a beginner do arbitrage trading?
A beginner can study arbitrage trading and paper-trade it, and the cost math is worth learning for any style. Running it with real money at retail fees usually loses, because the measured gaps are a fraction of entry-tier costs. Slower forms such as merger arbitrage need careful sizing for the deal-break case.
Arbitrage, futures, crypto and leveraged trading all carry risk, and losses can exceed what you expect, including on positions described as hedged. Every price, spread, fee and basis figure in this guide was sampled or read on November 4 and 5, 2026 and will have changed. Illustrative examples use round numbers, not quotes. Funded and evaluation accounts are simulated and governed by their program's rules. Nothing here is investment, legal or tax advice.


