



TL;DR: The DMI indicator shows which side controls price (+DI vs -DI) and how one sided the move is (ADX). Read them separately: a DI crossover is the trigger and ADX is the filter. On a year of daily E-mini S&P 500 bars, crossovers with ADX under 20 lost and the few taken above 25 carried the result.
You add the DMI indicator to a chart, the green line crosses above the red one, and the question is simple. Is this a trend worth trading, or another wiggle in a range?
The Directional Movement Index (DMI) was built to answer exactly that, but only if you read its three lines for what they are. Most of the frustration traders have with DMI comes from treating one line as if it did the job of another. Direction and strength are two different questions, and the DMI deliberately answers them on separate lines.
What the DMI Indicator Measures
The DMI indicator measures two things at once: which side of the market is producing more of the recent price travel, and how one sided that travel has been. J. Welles Wilder introduced it in his 1978 book New Concepts in Technical Trading Systems, the same book that introduced the Relative Strength Index (RSI), Average True Range (ATR) and the Parabolic SAR.
Wilder built the DMI from highs and lows rather than closing prices. A close tells you where a bar ended. The high and the low tell you how far price actually travelled, and directional movement is a statement about travel. If today's high pushes well past yesterday's high, buyers extended the range. If today's low breaks well under yesterday's low, sellers did.
Wilder was a commodity and currency trader, and he designed the system around commodities and daily bars. Charting references such as StockCharts' ChartSchool point out that it can be applied to stocks too, but that quieter instruments may need different settings or thresholds before the signals mean much.
In the share market, the DMI measures the same thing it measures anywhere: whether a stock's recent highs or recent lows are doing more of the work, and whether that imbalance is strong enough to call a trend. It does not measure value, earnings or momentum in the RSI sense.
Traders use the DMI for three practical jobs:
- Deciding whether a market is trending at all, which tells you whether a trend-following or a range approach fits.
- Identifying which side is in control right now.
- Filtering entries so you only act on directional signals when there is a trend to be directional about.
The Three Lines of the DMI Indicator
DMI stands for Directional Movement Index. On most platforms the DMI panel shows three lines, and each has a different job.
| Line | What it is | What it tells you | What it does not tell you |
|---|---|---|---|
| +DI (Plus Directional Indicator) | Smoothed upward directional movement divided by smoothed true range, times 100 | How much of the recent range came from up moves | Whether the trend is strong, because +DI can lead in a quiet drift |
| -DI (Minus Directional Indicator) | Smoothed downward directional movement divided by smoothed true range, times 100 | How much of the recent range came from down moves | Whether sellers will keep control, because it looks backward over the lookback |
| ADX (Average Directional Index) | A smoothed version of DX, the gap between +DI and -DI divided by their sum | How one sided the movement has been, on a 0 to 100 scale | Direction, because ADX rises in downtrends just as it does in uptrends |
The point traders most often miss is that ADX is direction blind. Fidelity's indicator guide puts it plainly: ADX and its rating line show whether there is a trend and how strong it is, not which way it points. A climbing ADX during a selloff means the selling has become more one sided. It is not good news for buyers.
Direction lives in the relationship between +DI and -DI. When +DI sits above -DI, up moves have been doing more of the work over the lookback. When -DI is on top, down moves have.
Some platforms add a fourth line, ADXR (Average Directional Movement Index Rating). It is the average of today's ADX and the ADX from 14 periods earlier, so it moves even more slowly and is used to check whether trendiness is sustained rather than a one-week spike. Wilder also used ADXR inside his Commodity Selection Index, a way to rank which markets were most worth trend trading.
Related lesson: Average directional index ADX
How the DMI Is Calculated
The DMI calculation runs in three stages: raw directional movement and true range for each bar, smoothing over the lookback, then the derived lines.
DMI directional movement and the single count rule
Each bar is compared with the bar before it.
- Up move = today's high minus yesterday's high.
- Down move = yesterday's low minus today's low.
- If the up move is larger and positive, it becomes +DM and -DM is zero.
- If the down move is larger and positive, it becomes -DM and +DM is zero.
- If both are zero or negative (an inside bar), both +DM and -DM are zero.
That last part is the single count rule, and it is what makes the DMI different from a pair of moving averages. On an outside bar, where price makes both a higher high and a lower low, only the larger move counts and the smaller one is thrown away. On an inside bar, nothing counts at all.
True range is calculated alongside, as the largest of three distances: today's high minus today's low, today's high minus yesterday's close, and yesterday's close minus today's low (both as absolute values). It measures how far price really travelled, including any gap.
The single count rule on ten E-mini sessions
Here is the DMI single count rule on ten real daily sessions of the E-mini S&P 500 futures continuous contract (Yahoo Finance ES=F data, read November 4, 2026). These are historical index levels used for illustration, not trade records.
| Session | High | Low | Up move | Down move | +DM | -DM | True range | What counted |
|---|---|---|---|---|---|---|---|---|
| Oct 21, 2026 | 7,812.25 | 7,751.00 | 20.75 | -46.50 | 20.75 | 0.00 | 61.25 | Up move alone |
| Oct 22, 2026 | 7,798.75 | 7,676.75 | -13.50 | 74.25 | 0.00 | 74.25 | 123.50 | Down move alone |
| Oct 23, 2026 | 7,714.25 | 7,648.50 | -84.50 | 28.25 | 0.00 | 28.25 | 65.75 | Down move alone |
| Oct 26, 2026 | 7,739.50 | 7,651.75 | 25.25 | -3.25 | 25.25 | 0.00 | 87.75 | Up move alone |
| Oct 27, 2026 | 7,772.75 | 7,699.75 | 33.25 | -48.00 | 33.25 | 0.00 | 73.00 | Up move alone |
| Oct 28, 2026 | 7,819.50 | 7,750.25 | 46.75 | -50.50 | 46.75 | 0.00 | 69.25 | Up move alone |
| Oct 29, 2026 | 7,773.75 | 7,709.50 | -45.75 | 40.75 | 0.00 | 40.75 | 73.75 | Down move alone |
| Oct 30, 2026 | 7,713.00 | 7,558.25 | -60.75 | 151.25 | 0.00 | 151.25 | 196.00 | Down move alone |
| Nov 2, 2026 | 7,693.75 | 7,570.75 | -19.25 | -12.50 | 0.00 | 0.00 | 123.00 | Nothing, inside bar |
| Nov 3, 2026 | 7,623.75 | 7,546.00 | -70.00 | 24.75 | 0.00 | 24.75 | 77.75 | Down move alone |
Look at November 2. The session had a 123.00-point range, one of the wider bars in the table, yet it contributed nothing to either directional line because it stayed inside October 30's high and low. Volatility and directional movement are not the same thing, and the DMI keeps them apart on purpose.
Over the full year from November 3, 2025 to November 3, 2026 (252 sessions), the rule counted an up move alone on 99 sessions (39.29%), a down move alone on 95 (37.70%), an outside bar where one side was discarded on 31 (12.30%), and nothing at all on 27 inside bars (10.71%). On the outside bars the discarded move averaged 15.35 points, and the largest was 74.50 points on March 23, 2026, a bar where a 74.50-point push below the prior low was ignored because the push above the prior high was bigger.
Wilder smoothing and the warm-up period
The raw +DM, -DM and true range values are smoothed over the lookback, 14 periods by default. Wilder's method seeds the first smoothed value with the sum of the first 14 readings. After that, each new value equals the prior value, minus one fourteenth of the prior value, plus the new raw reading.
Because each bar replaces only about 7.14% of the smoothed value, old data fades slowly. ChartSchool notes that roughly 150 periods are needed to absorb the smoothing. On a 14-period setting the first ADX value appears only on the 28th bar loaded, and it keeps drifting for many bars after that. If your platform has loaded only a couple of months of daily history, its ADX can differ from another platform's reading on the same market.
The derived lines, step by step
- +DI = 100 × smoothed +DM ÷ smoothed true range.
- -DI = 100 × smoothed -DM ÷ smoothed true range.
- DX = 100 × the absolute difference between +DI and -DI ÷ their sum.
- First ADX = the average of the first 14 DX values.
- Each later ADX = (prior ADX × 13 + current DX) ÷ 14.
Dividing by true range turns both directional lines into shares of the total range. That is why a quiet market and a violent one can print the same +DI value: the numerator and the denominator grow together.
A full DMI calculation on one session
Here is the full chain for the November 3, 2026 session, using the 14-period setting and every bar loaded since September 3, 2024.
| Step | Value on Nov 3, 2026 | Where it comes from |
|---|---|---|
| Up move | -70.00 points | High 7,623.75 minus prior high 7,693.75 |
| Down move | 24.75 points | Prior low 7,570.75 minus low 7,546.00 |
| Raw +DM and -DM | 0.00 and 24.75 | Only the positive, larger move counts |
| True range | 77.75 points | High minus low, larger than either gap to the prior close of 7,574.50 |
| Smoothed +DM | 168.36 | Prior value minus one fourteenth, plus 0.00 |
| Smoothed -DM | 367.12 | Prior value minus one fourteenth, plus 24.75 |
| Smoothed true range | 1,262.35 | Prior value minus one fourteenth, plus 77.75 |
| +DI | 13.34 | 100 × 168.36 ÷ 1,262.35 |
| -DI | 29.08 | 100 × 367.12 ÷ 1,262.35 |
| DX | 37.12 | 100 × the gap between the DI lines ÷ their sum |
| ADX | 18.82 | Prior ADX 17.41 × 13, plus 37.12, divided by 14 |
The reading as of November 3, 2026: -DI well above +DI, so down moves have dominated the last few weeks. ADX at 18.82 is rising (it was 10.86 fourteen sessions earlier) but still below 20. In Wilder's terms, sellers are in control of a market that has not yet become a trend.
Related lesson: Average true range ATR
How to Read DMI Signals
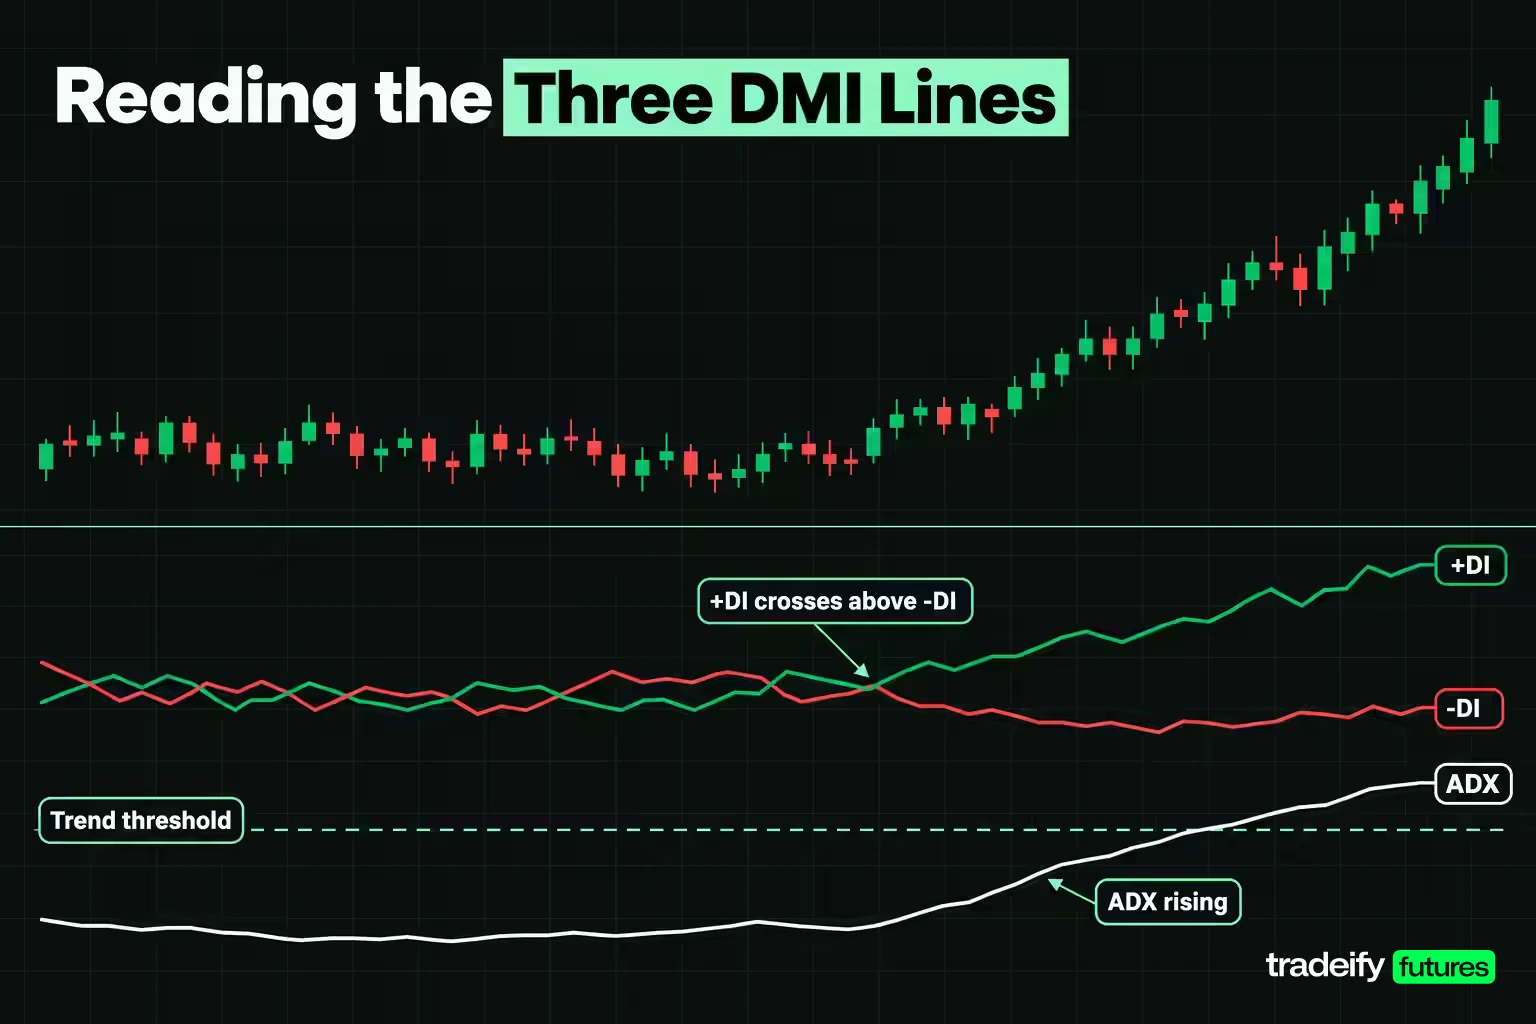
Reading DMI signals works best in a fixed order: ADX level, ADX slope, then the DI lines.
ADX level
Wilder treated ADX above 25 as a trending market and below 20 as a market with no trend, with 20 to 25 as a grey zone. Many traders use 20 as the main line.
Those bands are a scale, not a promise of how often each one shows up. On the E-mini S&P 500 over the year to November 3, 2026, the 14-period daily ADX looked like this.
| ADX band on daily ES bars | Sessions | Share of 252 sessions |
|---|---|---|
| Below 20 | 130 | 51.59% |
| 20 to 25 | 33 | 13.10% |
| 25 or above | 89 | 35.32% |
| 40 or above | 17 | 6.75% |
| 50 or above | 0 | None. The year's high was 47.86 on March 20, 2026 |
Half the year sat in the no-trend band. On a contract like that, most DI crossovers arrive when there is no trend for them to signal, which is why an unfiltered crossover rule tends to struggle.
ADX slope
The direction of ADX often matters more than its level. An ADX of 30 that is falling describes a trend losing its one-sidedness. An ADX of 21 that has climbed for a week describes a trend forming. A falling ADX does not mean price is reversing. It means the move has become less directional, which can be a pause, a range or the start of a turn.
+DI and -DI crossovers and spread
A bullish signal is +DI crossing above -DI. A bearish signal is -DI crossing above +DI. Watch the spread as well as the cross:
- Widening DI lines with a rising ADX mean one side is pulling further ahead.
- Narrowing DI lines mean the dominant side is losing its edge, and ADX usually rolls over soon after.
- Lines tangled together near the same value, with ADX below 20, mean neither side is in control and crossovers carry little information.
The distinction to keep is between observation and confirmation. A cross is an observation that one side took the lead over the lookback. Confirmation is ADX telling you that lead is part of a trend, and price then following through.
DMI Trading Strategies
DMI trading strategies fall into four families. Each uses the lines for a different job.
Crossover with an ADX filter
This is Wilder's own system as ChartSchool describes it. Require ADX above 25 (many traders use 20), then take +DI crossing above -DI as a buy signal and -DI crossing above +DI as a sell signal. Wilder placed the initial stop at the low of the signal day for a long (the high for a short), and the signal stayed in force as long as that level held, even if the DI lines crossed back. The invalidation is a price level, not another crossover, which keeps you from flipping long and short every time the lines touch.
The extreme point rule
Wilder also used an entry filter known as the extreme point rule: after a crossover, enter only if price trades beyond the crossover bar's high (for a long) or low (for a short). If price never breaks that extreme, there is no trade. The rule costs a little entry price in exchange for proof that the crossover had follow-through.
DMI breakout confirmation
Here the DMI is a second opinion on a price breakout rather than the trigger. A break of a range high is more credible when +DI is already above -DI and ADX is turning up from a low level, because the breakout is happening with directional movement behind it rather than into a market that has been flat for weeks.
Trend pullback with ADX rising
In an established trend (ADX above 25 and rising, DI lines widely separated), a pullback that does not flip the DI lines can be treated as a pause rather than a reversal. Traders use a separate tool for the entry (a moving average, a prior swing level) and use the DMI only to confirm that the trend condition still holds.
ADX as a regime switch
The simplest use is not a signal at all. When ADX on the DMI indicator is below 20, the trader turns off trend-following setups and either stands aside or uses range methods. When ADX rises above 25, the trader turns trend setups back on. Many traders find this more useful than the crossover itself, because it changes which playbook they run rather than adding another trigger.
DMI Crossovers on a Year of E-mini Data
A single example proves nothing about the DMI, so here is every +DI/-DI crossover on the daily E-mini S&P 500 over one year, tested with a stated rule. This is an illustrative study on one market, not a recommendation or a measured edge.
DMI crossover test data and rules
- Data: Yahoo Finance ES=F daily bars (the unadjusted continuous front-month E-mini S&P 500), September 3, 2024 to November 3, 2026, read November 4, 2026. The test window is the last 252 sessions, November 3, 2025 to November 3, 2026, with the earlier bars used to warm up the smoothing.
- Indicator: 14-period DMI with Wilder smoothing (the first value is the sum of 14 readings, then each new value is the prior one minus one fourteenth plus the new reading).
- Entry: after a crossover, a stop order at the crossover bar's high for a long or low for a short (the open if price gapped through it). The order is cancelled if the DI lines cross back before it fills.
- Stop: the crossover bar's opposite extreme.
- Exit: the stop, or the close of the 20th session after entry.
- Points only, one contract, no compounding. The series is not back-adjusted, so roll days in December, March, June and September carry small price jumps.
DMI crossover results
There were 26 DMI indicator crossovers in the year, a median of 3 sessions apart, and 9 of the 25 gaps between consecutive crosses were 2 sessions or less. Sixteen of the 26 crossovers (61.54%) arrived with ADX below 20, and the median ADX on a crossover bar was 16.39. The typical crossover arrived in exactly the condition Wilder's filter tells you to skip.
Results by ADX on the crossover bar
Of the 26 crossovers, 8 never triggered an entry, 1 was still open at the end of the sample (a bearish cross on October 14, 2026 with entry at 7,741.00 and its stop at 7,879.75), and 17 completed. Of those 17, 15 were stopped out and 2 reached the 20-session exit as winners, for a net of -562.00 points.
| ADX on the crossover bar | Completed trades | Winners | Net points | Net on one ES contract |
|---|---|---|---|---|
| All crossovers | 17 | 2 | -562.00 | -$28,100.00 |
| 25 or above | 3 | 2 | 745.25 | $37,262.50 |
| 20 to 25 | 3 | 0 | -359.75 | -$17,987.50 |
| Below 20 | 11 | 0 | -947.50 | -$47,375.00 |
Read this with care. Three trades is a tiny sample, and two winners (bullish crosses on April 8 and April 14, 2026, worth 515.75 and 461.50 points) produced the entire positive result. That is not evidence of an edge. What the table does show is the direction of the effect: eleven trades taken with ADX below 20 produced no winners and lost 947.50 points.
The harder lesson is behavioural. Following this rule meant sitting through 15 stop-outs to be present for 2 winners. Most traders abandon a rule well before the second winner shows up, which is why the ADX condition belongs in the plan before the first trade, not after the fifth loss.
The extreme point rule also earned its keep in one notable case. A bearish cross on April 13, 2026 never broke its own low, so no trade was taken. Holding that signal for 20 sessions from the crossover close would have lost 514.00 points.
A simpler version, holding every crossover for 20 sessions from the crossover close with no stop, scored 25 crosses (the last one had too few sessions left), won 12, and lost 617.85 points in total. Split by ADX, the 6 crosses at 25 or above gained 303.00 points, and the 15 below 20 lost 851.10 points.
Trading costs on a DMI signal
On the E-mini S&P 500, each index point is worth $50 and one tick (0.25 points) is $12.50. The Micro E-mini S&P 500 is one tenth the size, $5 per point and $1.25 per tick. With an illustrative cost assumption of one tick of slippage on each side plus $4.00 commission, an ES round turn costs $29.00, or 0.58 points. Across the 17 completed DMI crossover trades on daily ES bars that is $493.00, small next to the $28,100.00 those trades lost on price alone. On a daily chart the signal quality matters far more than the fees. On a one-minute chart the same fee is a much larger share of each move.
Related lesson: Tick size and tick value
DMI Settings and Lookback Periods
The default DMI setting is 14 periods, which Wilder used on daily bars. Many platforms split it into two inputs: the DI length (how many bars feed +DI and -DI) and the ADX smoothing (how many bars smooth DX into ADX). TradingView's built-in Directional Movement indicator, for example, has separate "ADX Smoothing" and "DI Length" inputs, both 14 by default. If two charts disagree, check both inputs before anything else.
Shorter lookbacks react faster and produce more crossovers. Longer ones react slower and produce fewer clean trend readings. The less obvious effect is on the ADX threshold itself.
DMI lookback comparison on E-mini data
Here is one year of daily E-mini S&P 500 data (Yahoo Finance ES=F, 252 sessions to November 3, 2026) recomputed at five DMI lookbacks.
| DMI lookback | Crossovers in 252 sessions | Median sessions between crosses | Crosses within 2 sessions of the last | Sessions with ADX at 25 or above | Net points, every cross held 20 sessions |
|---|---|---|---|---|---|
| 7 | 38 | 3 | 17 | 76.59% | -556.50 |
| 10 | 30 | 4 | 11 | 48.02% | -482.75 |
| 14 | 26 | 3 | 9 | 35.32% | -617.85 |
| 20 | 26 | 3 | 10 | 16.67% | -837.10 |
| 30 | 28 | 3 | 12 | 7.14% | -1,224.35 |
Three things stand out.
- An ADX of 25 means different things at different lookbacks. At 7 periods, ADX sat at 25 or above on 76.59% of sessions, so the filter barely filters. At 30 periods it reached 25 on only 7.14% of sessions, and not one of the 28 crossovers came with ADX at 25 or above.
- Lengthening the lookback did not remove whipsaw. The 30-period setting still produced 28 crossovers, 12 of them within two sessions of the previous one, because the DI lines spend long stretches close together.
- No lookback rescued the raw crossover. Every value in the last column is negative on this contract and year.
Choosing DMI indicator settings for your timeframe
The practical answer to "what are the best DMI settings" is to match the lookback to the holding period you actually trade, test any change on data you did not use to pick it, and then leave it alone. If you change the lookback, re-test the ADX threshold too, because 25 does not travel between settings.
Timeframe has a similar effect. A 14-period DMI on a five-minute chart covers just over an hour of trading. The same setting on a daily chart covers nearly three weeks. Both are valid, but they answer different questions.
Related lesson: Backtesting a trading strategy
The DMI Indicator in Sideways and Choppy Markets
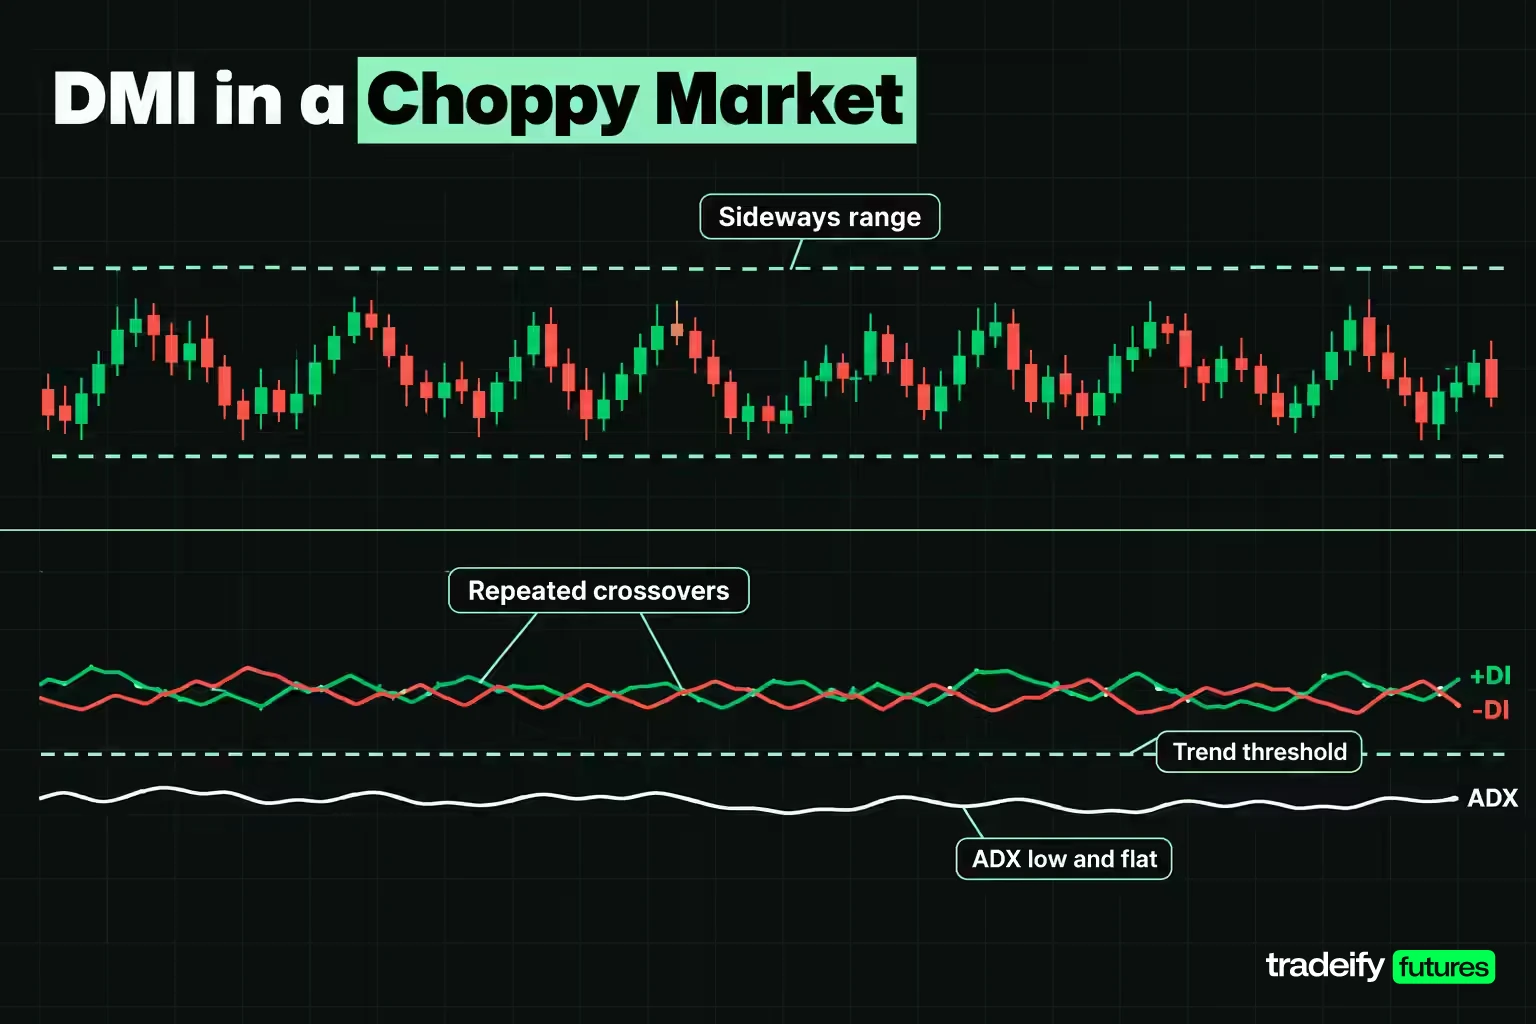
The DMI indicator is at its weakest in sideways markets. In a range, up moves and down moves take turns, so +DI and -DI swap places every few bars and each swap prints a crossover.
The year of ES data has a clear example. Between September 21 and October 2, 2026, the DI lines crossed five times in ten sessions: bullish, bearish, bullish, bearish, bullish. ADX on those crossover bars ranged from 10.65 to 16.04. Each cross looked like a signal in isolation. Taken together they described a market with no directional bias.
Practical rules for choppy conditions:
- Treat ADX below 20 as a "no trend" flag and turn crossover signals off, rather than trying to filter each cross after it prints.
- Count the sessions since the previous crossover. A cross within two sessions of the last one in the opposite direction is usually the same indecision, announced twice.
- Watch for both DI lines low and close together. That is a range, and range tools (support and resistance, mean-reversion setups) fit it better than a trend indicator.
- Wait for ADX to turn up from a low level with the DI lines separating. That combination often marks the end of a range, though it can still fail.
The hard part is behavioural. After a few false crossovers, the temptation is either to take the next one bigger "because it has to work", or to ignore the real breakout when it finally comes. A precommitted ADX rule removes that decision from the moment.
Combining DMI With Other Indicators
Combining the DMI with other indicators works when each tool answers a different question. Stacking tools that answer the same question just adds confirmation that is not independent.
- Moving averages. A moving average gives a price level and slope. Using a 50-period average as the trend side (only longs above it) and DMI as the strength check (ADX above 20 or 25) splits direction and strength cleanly.
- ATR. Average True Range comes from the same Wilder book and uses the same true range. ATR tells you how far price typically moves per bar, which is what you need for stop distance and position size once DMI has said the trend is worth trading.
- RSI. RSI measures the speed and size of closing-price changes on a 0 to 100 scale, with 70 and 30 as the usual overbought and oversold marks. In a strong DMI trend, RSI can stay overbought for a long time, so many traders read high RSI as trend strength when ADX is high, and as a reversal warning only when ADX is low.
- MACD. MACD is built from closing-price moving averages. Pairing a MACD signal-line cross with a DMI reading can help, but both lag, so expect late confirmation rather than early entries.
- Bollinger Bands. Narrow bands with ADX below 20 describe a quiet range. A band expansion with ADX turning up and the DI lines separating is a common breakout check.
- Volume. On futures and stocks, a DI crossover on rising volume shows more participation behind the move than one on thin volume.
A widely taught core set of trading indicators is a moving average, RSI and MACD. There is no agreed "top three", but those three each cover a different job (trend, momentum, momentum shift). The DMI adds the one thing none of them measures directly: whether there is a trend at all.
DMI vs ADX, RSI, MACD and Aroon
DMI and ADX are not rivals. ADX is one line inside the DMI study. ADX alone tells you trend strength without direction, which is enough for a regime filter. For a directional signal you need +DI and -DI as well.
| Indicator | Built from | Question it answers | Typical default | Main weakness |
|---|---|---|---|---|
| DMI (+DI, -DI, ADX) | Highs, lows and true range | Which side is in control, and is it a trend | 14 periods | Lags, whipsaws in ranges |
| ADX alone | Same as DMI | How strong is the trend, either way | 14 periods | No direction |
| RSI | Closing-price gains and losses | How fast and how far price has moved | 14 periods, 70 and 30 levels | Stays overbought or oversold in strong trends |
| MACD | 12 and 26-period EMAs of closes, 9-period signal | Are the short and long averages separating or converging | 12, 26, 9 | Unbounded, lags turns |
| Aroon | Bars since the highest high and lowest low | How recently a new high or low printed | 25 periods | Ignores how big the move was |
ADX vs RSI and MACD vs DMI signals
Is ADX better than RSI? They do different jobs, so neither is better in general. ADX tells you whether a trend exists. RSI tells you how stretched recent price movement is. A common pairing uses ADX to choose the playbook and RSI within it: pullback entries in a trend when ADX is high, overbought and oversold fades when ADX is low.
The difference between MACD and DMI signals comes down to inputs. A MACD crossover says two closing-price averages changed relationship. A DMI crossover says one side's share of the high-low range took the lead, and ADX says how convincingly. MACD can cross on a slow drift in closes. The DMI ignores closes for direction and reacts only to range extension.
Aroon compared with the DMI
Aroon, developed by Tushar Chande in 1995, is the closest cousin to the DMI. It measures time since the last 25-period high and low rather than the size of directional moves. Aroon is designed to flag the start of a new trend, while the DMI is better at describing how strong and one sided an existing move is.
Related lesson: MACD indicator
Using the DMI Indicator in Futures, Forex, Stocks and Crypto
The DMI indicator works on any market with reliable high and low data, but the readings behave differently across them.
- Futures and commodities. This is where Wilder built the tool. Futures trade nearly around the clock, so daily highs and lows are complete and gaps are smaller. Continuous contracts are the catch. An unadjusted continuous chart jumps on roll days, and that jump enters the true range and can push one DI line. Charting a single contract month, or a back-adjusted series, avoids it.
- Forex. Spot forex trades around the clock during the week, and currency futures follow the CME session. Highs and lows can differ by data provider, so the same pair can print slightly different DMI values on two platforms.
- Stocks. Overnight gaps are common, and true range captures them, which can inflate ADX after earnings. ChartSchool notes that low-volatility stocks may not produce signals at Wilder's original thresholds, so testing a lower threshold or a shorter lookback per stock is reasonable.
- Crypto. Spot crypto venues keep trading through weekends and holidays, so "daily" bars depend on the platform's cutoff time. Large wicks on thin venues can create directional movement that a deeper market would not show.
Day traders usually run the DMI on intraday bars and use a higher timeframe reading as context. A daily ADX below 20 is a warning that intraday trends may not extend far. Swing traders use daily or weekly bars, where the 14-period default covers a few weeks to a few months.
Risk Management With DMI Signals
Risk management with DMI signals starts with accepting that most individual crossovers fail. In a test of every DMI indicator crossover on 252 daily E-mini S&P 500 sessions (Yahoo Finance ES=F data to November 3, 2026, extreme point entry, stop at the crossover bar's opposite extreme), 15 of 17 completed trades were stopped out. A plan built on that signal needs small losses, rare large winners, and a size small enough to survive a long losing streak.
Stop placement on a DMI signal
Wilder's stop for a DMI crossover sits at the crossover bar's opposite extreme. That gives a logical invalidation point, since a break of that level means the move that created the signal has failed. It also gives variable risk. In the 252-session E-mini crossover test, stop distances ranged from 35.75 to 232.00 points, with a mean of 107.18 points.
On one ES contract at $50 per point, that is $1,787.50 at the narrowest and $11,600.00 at the widest. On one Micro E-mini at $5 per point, it is $178.75 and $1,160.00. A bar-based stop can be far wider than the risk you planned, so check the distance before you place the order, not after.
Position sizing from a DMI stop
Size from the stop, not from conviction. With an illustrative risk budget of $500 per trade and an 87.00-point stop (the distance on the October 2, 2026 bullish DMI crossover on daily E-mini bars), one Micro E-mini risks $435.00 and one ES risks $4,350.00. Only the micro fits the budget. On the 232.00-point stop, even one micro risks $1,160.00, more than double the budget, so the correct size is zero.
Exits when ADX turns
- A falling ADX after a strong run is a reason to tighten a trailing stop, not a reason to reverse.
- A DI cross against your position is information, but under Wilder's rule the stop level, not the cross, ends the trade.
- An ATR-based trailing stop adapts to volatility better than a fixed point distance once the trend is under way.
Measure all of this in a journal. If a DMI rule is losing, the data will show whether the problem is the signal, the stop or the sizing. One rough month is one line in the sample, not a verdict.
Related lesson: Stop loss orders and placement
Setting Up the DMI on a Charting Platform
Setting up the DMI indicator takes a minute on most charting platforms, but three checks keep the numbers honest.
- Add the study. It is usually listed as "Directional Movement", "DMI", or "ADX/DMI". Some platforms ship ADX and the DI lines as separate studies, so make sure you have all three lines.
- Check the inputs. Look for both the DI length and the ADX smoothing input, and confirm they match your plan (14 and 14 by default). On TradingView these are the "DI Length" and "ADX Smoothing" inputs.
- Load enough history. Because the smoothing needs around 150 bars to settle, set the chart to load several hundred bars before trusting the values.
- Add reference lines at 20 and 25 on the ADX scale so the bands are visible at a glance.
- Check the formula notes. Most platforms use Wilder's smoothing, but some describe it as an exponential moving average. WealthCharts, for example, publishes its ADX/DMI formula in its knowledge base. If two platforms disagree after loading plenty of history, a different smoothing method is the likely reason.
On our accounts, every position is closed by 4:45 PM ET and nothing is held overnight, so a daily DMI reading is context for the session rather than a 20-day hold. You can chart the DMI on TradingView through the Tradovate connection or on WealthCharts, which offers 200+ indicators and Chart Replay for practising on historical bars. Our funded accounts are simulated.
Advantages and Limitations of the DMI Indicator
The DMI indicator's biggest advantage is that it separates direction from strength. Few common indicators do that in one panel.
Advantages:
- It answers "is there a trend?" directly, which most momentum tools do not.
- It works from highs, lows and true range, so it reflects how far price travelled, not just where it closed.
- ADX gives a single number for regime filtering, useful across strategies that have nothing to do with DMI crossovers.
- It is built into nearly every charting platform with consistent core logic.
Limitations and common mistakes:
- Lag. Two rounds of smoothing mean ADX confirms trends after they are under way and flags their end after the range has begun.
- Whipsaw. In ranges the DI lines cross repeatedly. In the ES year, 9 of 25 gaps between crossovers were two sessions or less.
- Reading ADX as direction. A high ADX in a selloff is a strong downtrend.
- Cold readings. A chart with too little history gives an ADX that is still warming up.
- Thresholds that do not travel. An ADX of 25 at a 7-period setting is common, while at 30 periods it is rare.
- Variable stop distance. The signal bar's extreme can sit far from the entry, and that is where risk plans break.
The way to avoid most false signals is to decide the ADX condition before looking for a crossover, not after. If you want to understand why every smoothed indicator confirms late, the lagging-indicator concept is worth knowing.
DMI Indicator FAQ
What does DMI stand for?
DMI stands for Directional Movement Index. It is J. Welles Wilder's 1978 system of three lines: +DI, -DI and ADX. The DI lines show which side is in control, and ADX shows how strong the trend is.
What does the Directional Movement Index measure in the share market?
In stocks, the DMI measures whether recent highs or recent lows are extending the range more, and whether that imbalance is strong enough to call a trend. It does not measure value or fundamentals. Gaps after earnings are included through true range, which can lift ADX quickly.
Is ADX better than RSI?
Neither is better in general, because they measure different things. ADX measures trend strength regardless of direction, and RSI measures how stretched recent price changes are. Many traders use ADX to decide whether to trade trends or ranges, then use RSI inside that choice.
What are the top 3 trading indicators?
The most widely taught three are a moving average for trend, RSI for momentum and MACD for momentum shifts, though there is no agreed top three. The DMI is a useful addition because it measures whether a trend exists, which those three do not answer directly.
What is a good ADX value in the DMI indicator?
Wilder treated ADX above 25 as trending and below 20 as no trend, with 20 to 25 as a grey zone. Those levels assume the 14-period default. At shorter or longer lookbacks the same number means something different, so re-test the threshold if you change the setting.
Is the DMI a leading or lagging indicator?
The DMI is a lagging indicator. It smooths past directional movement and true range, then smooths DX again to get ADX. That makes it better at confirming a trend than at calling the start of one.
Trading Risk With the DMI Indicator
This article is general education about how the DMI indicator is calculated and read. It is not investment advice or a recommendation to trade any product. Futures and other leveraged products can lose more than you expect, quickly, and a stop order does not guarantee your exit price. The E-mini figures here are historical and illustrative, from a small sample on one market, and do not predict future results. Evaluation and funded accounts are simulated, and simulated results do not represent live trading.


