




TL;DR: Dow Theory is a test for whether a market trend is real, built on one rule: two related averages must confirm each other. An uptrend counts when both print higher highs and higher lows, and it holds until both break the last secondary low. It tells you what the trend is and what would end it, never how far it runs. The confirmation rule is late by design, and the published record on whether it works is mixed.
What Is Dow Theory
Dow Theory is a framework for deciding whether a price move is a genuine trend or noise. You see an index break to a new high and feel the pull to buy it. Dow Theory makes you ask one question first: does a second, related average agree?
It does not predict where a market is going. Given what two related averages have done, it says whether the trend is up, down, or unresolved, and "unresolved" is a valid answer.
The evidence comes from swing structure. Rising highs and rising lows define an uptrend, falling highs and falling lows define a downtrend, and the theory only accepts that reading when a second average shows the same structure. Volume is the supporting witness.
That makes Dow Theory a filter rather than a signal service. Its best work is often invisible: the trade you skipped because only one chart agreed.
It also comes with a built-in limit that the theory's own writers stated plainly. Robert Rhea wrote that there is no known method of forecasting the extent or duration of a primary movement. Dow Theory tells you the direction of the trend and what would end it, nothing more.
Charles Dow himself never used the term "Dow theory" and never presented it as a trading system. The Library of Congress describes his editorials as a "window" into the market and economy rather than a formal theory. The name, and the numbered tenets, came after his death.
Related lesson: Market structure highs lows and trends
Where Dow Theory Came From
Dow Theory starts with the first stock averages. Charles H. Dow and Edward Jones formed Dow Jones & Company in 1882. In 1884 they created the first index, the Dow Jones Railroad Average, built from 11 stocks and published in the Customer's Afternoon Letter, the daily bulletin that became The Wall Street Journal.
The Dow Jones Industrial Average followed on May 26, 1896. It held twelve industrial companies and started at 40.94 points. The industrial list grew to 20 stocks by 1916 and to 30 in 1928.
Dow wrote the editorials behind the theory in The Wall Street Journal between 1899 and 1902, and he died in 1902. Three later writers turned those editorials into the version most traders now quote:
- William Peter Hamilton took over as editor on Dow's death and wrote market editorials for the next 27 years, until his own death in late 1929. His 1922 book, The Stock Market Barometer, set out the framework, and he added the "dual indicators" rule that both averages must move together.
- Robert Rhea published The Dow Theory through Barron's in 1932, giving it the defined, numbered form that most summaries still follow.
- E. George Schaefer wrote on applying the theory in 1960, adding his own refinements.
This matters when you read criticism of Dow Theory. Most of the precise definitions, including the retracement band and the line, are Rhea's wording, not Dow's. Arguing with Dow Theory usually means arguing with Hamilton and Rhea.
The Six Tenets of Dow Theory
Hamilton, Rhea and Schaefer are usually credited with the six tenets of Dow Theory. Read each one as a filter that removes something you might otherwise believe:
- The averages discount everything. Known information is already in the price.
- The market has three movements. Primary, secondary and minor trends run at the same time.
- Primary trends have three phases. Accumulation, public participation and distribution.
- The averages must confirm each other. A move in one average alone is unconfirmed.
- Volume confirms the trend. Participation should expand in the direction of the primary trend.
- A trend persists until a clear reversal. The burden of proof sits with the reversal.
The last tenet is the one traders feel. It means you give the existing trend the benefit of the doubt through pullbacks, and you only call it over when the structure breaks on both averages. That is uncomfortable in a sharp pullback, which is exactly when the rule earns its keep.
The averages discount everything
The discounting tenet is the foundation for the other five. In Rhea's wording, the daily closing prices of the averages are a composite of the hopes, disappointments and knowledge of everyone who knows anything about financial matters, so the effects of coming events are already anticipated, "excluding acts of God".
The practical consequence is that reading the news is not an edge in Dow Theory. A headline that everyone has already read is, by this tenet, already in the price. The job is to read what price is doing, not to second-guess it. On this point Dow Theory overlaps with the efficient-market hypothesis, which also holds that prices absorb new information quickly.
The tenet has a weakness worth knowing. Burton Woodward's 1968 University of Florida study of the theory put it bluntly: the axiom can neither be proved nor disproved. Treat it as a working assumption that justifies chart reading, not a tested fact.
Rhea added a related point: the primary trend can never be manipulated, although shorter movements can be pushed around to a limited degree. That is one reason Dow Theory gives so little weight to single sessions.
The Three Market Movements in Dow Theory
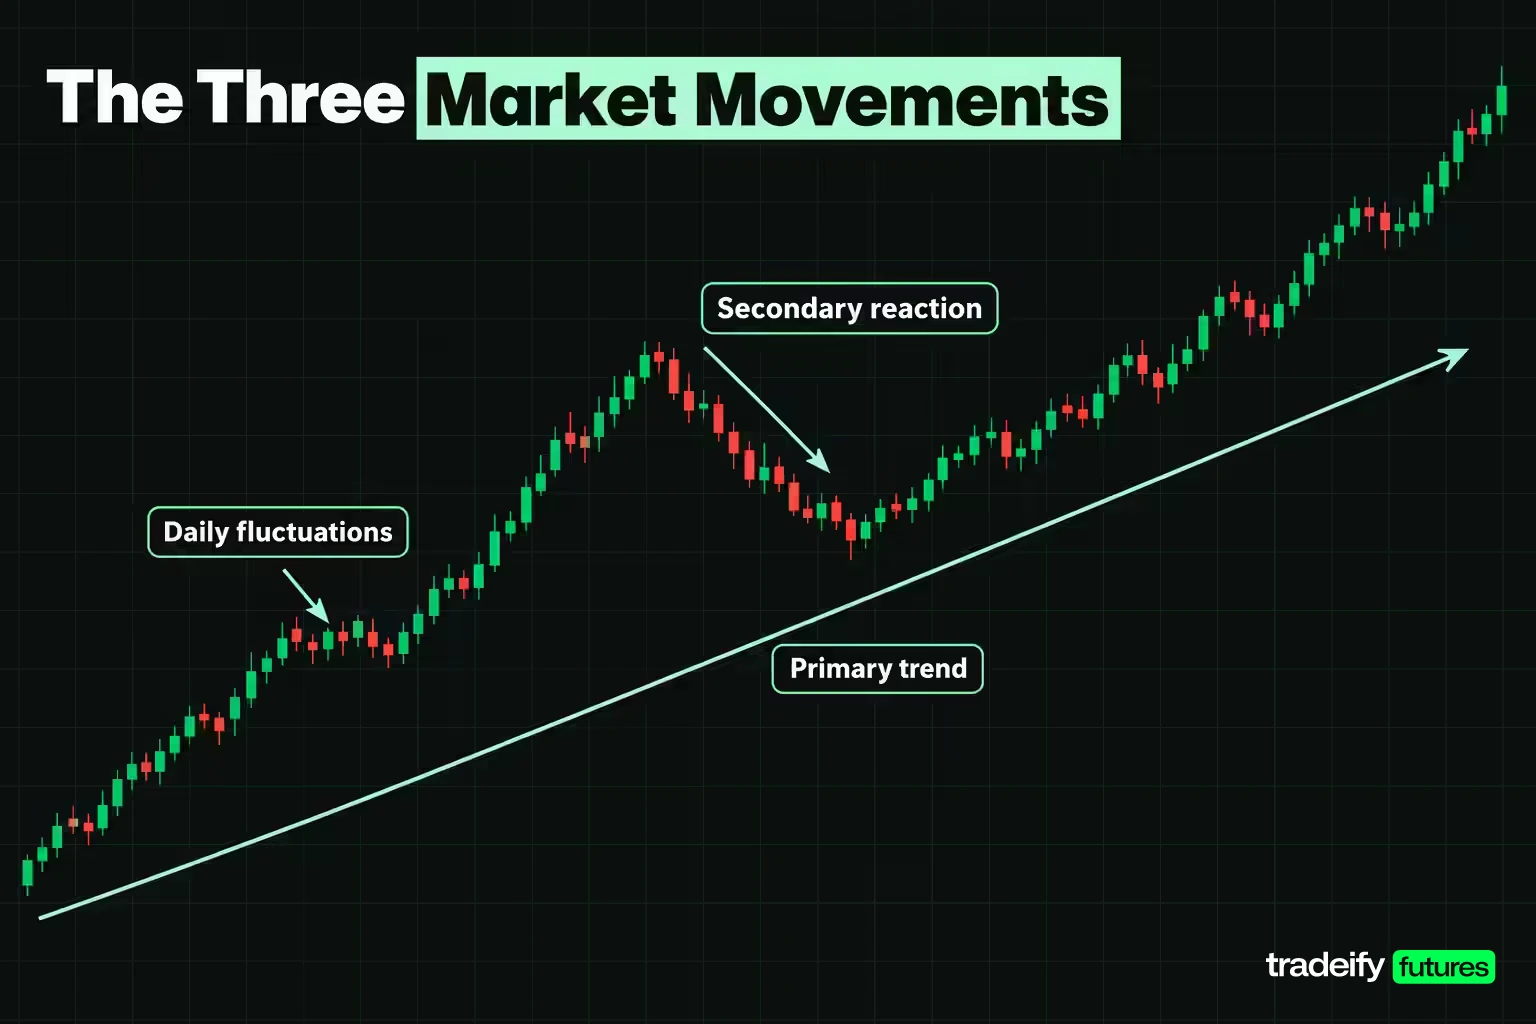
Dow Theory splits every market into three movements that run at the same time, and most arguments about whether a market is "still trending" are two people watching different layers. Rhea's definitions are the cleanest version:
| Movement | Rhea's description | Typical duration | What it means for a decision |
|---|---|---|---|
| Primary trend | The broad bull or bear market | Less than a year to several years | Sets the direction you give the benefit of the doubt |
| Secondary reaction | An important countermove against the primary trend | Usually three weeks to as many months | The most deceptive layer, often mistaken for a reversal |
| Daily fluctuation | Day-to-day movement of the averages | One session | Almost certain to mislead when read alone |
Rhea added two numbers that make the layers usable. A secondary reaction generally retraces 33% to 66% of the primary price change since the last secondary reaction ended. And a rally or decline only counts as a swing when it produces a net reversal of more than 3% of the price of either average.
That 3% threshold is the most practical part of the definitions. On an average at 44,000, a swing has to cover more than 1,320 points to count. On an average at 15,000, it has to cover more than 450 points. Anything smaller is daily fluctuation and does not change the trend labels.
Sources differ slightly on the bands. Some summaries give the secondary reaction as ten days to three months rather than three weeks. Treat both as descriptive ranges, not hard rules.
Rhea described the primary bull market as averaging longer than two years. A trader acting on daily moves inside a secondary reaction inside a primary bear market can be right several times in a row and still be on the wrong side of the layer that matters most.
The Three Phases of a Primary Trend
In Dow Theory, the three phases describe how a primary trend develops over time. That is a separate idea from the three market movements (primary, secondary and daily), and blending the two is one of the most common Dow Theory reading errors.
- Accumulation. Informed buyers build positions while the general opinion is still negative. Price changes little because they are absorbing supply that the rest of the market is happy to release.
- Public participation. The improvement becomes visible, trend followers join, and price moves fastest.
- Distribution. Speculation is widespread, and the early buyers sell into that demand.
Rhea wrote the phases in economic terms. A bull market moves through reviving confidence in the future of business, then the response of prices to known improvement in earnings, then a period when "speculation is rampant and inflation apparent". A bear market moves through the abandonment of hopes on which stocks were bought at inflated prices, then selling due to falling business and earnings, then distress selling of sound securities regardless of value.
The phases are easier to label afterwards than in real time. Their practical use is as a warning. When a primary trend is in a phase that looks like distribution, a new high on one average that the second average does not confirm deserves more suspicion, not less.
Why the Averages Must Confirm Each Other
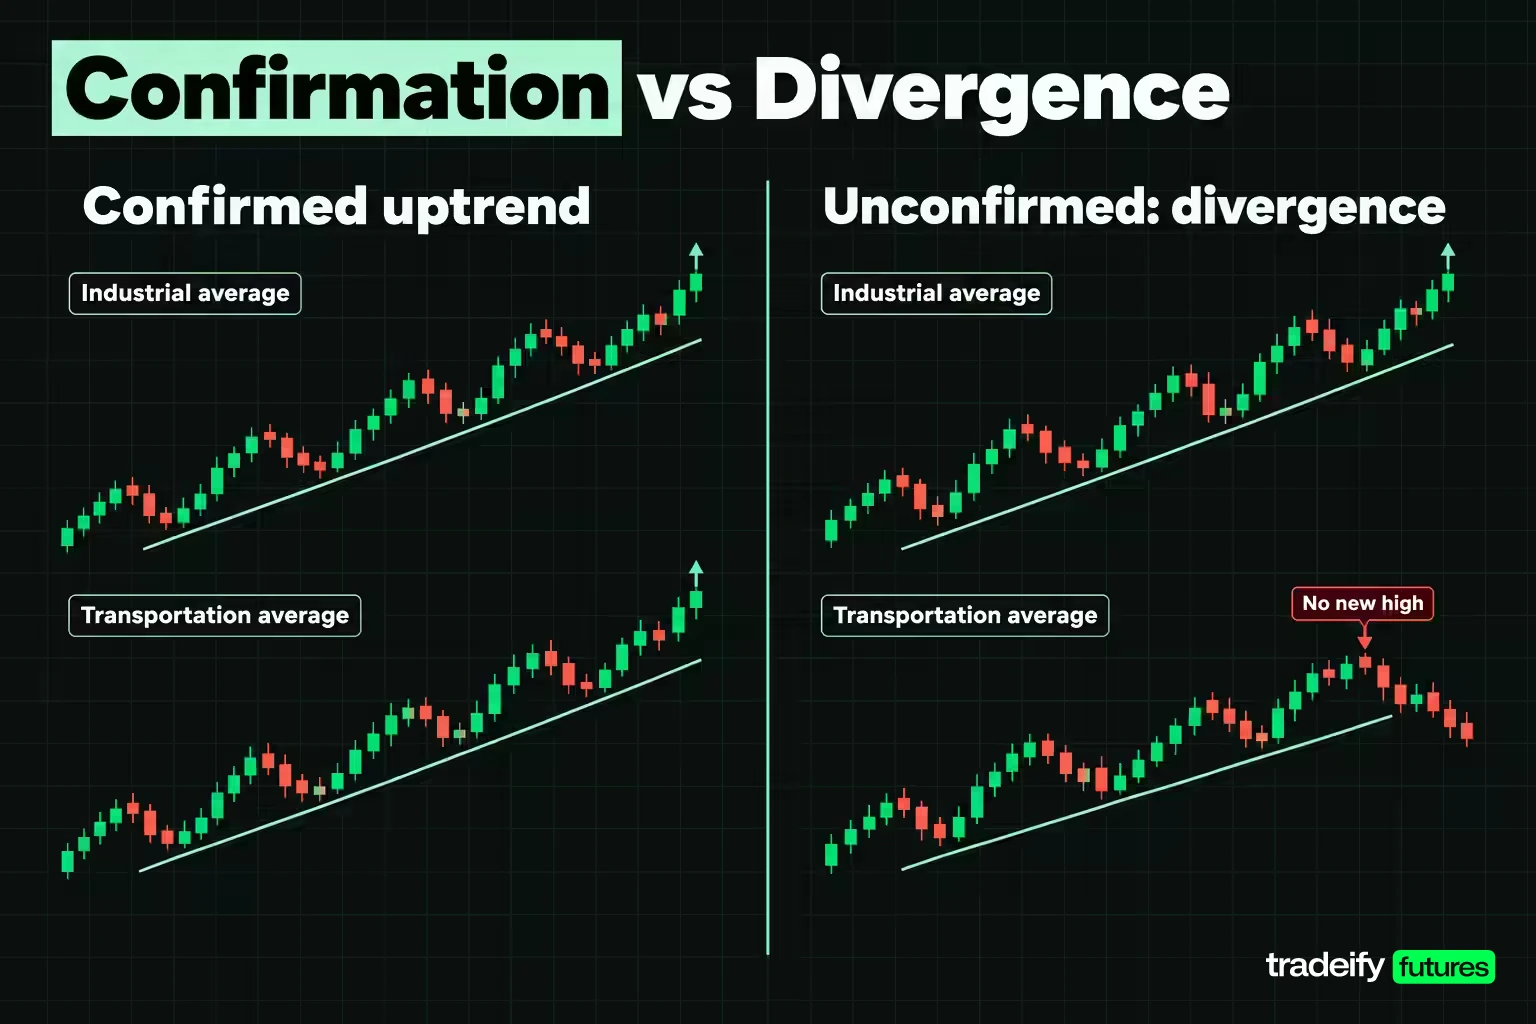
The confirmation principle is the core of Dow Theory, and it only makes sense against its origin. Dow's two averages measured two halves of the same economic story. If factories were busy and profits were rising, they had to ship more goods, and in that era that meant the railroads. A rising industrial average with a flat railroad average meant the two halves disagreed.
Rhea's rule is strict. The movement of one average must be confirmed by the other before reliable inferences can be drawn, and conclusions based on one average alone "are almost certain to prove misleading". The confirmation does not need to happen on the same day.
Both averages still exist, and both have changed beyond recognition:
| Average | Today's construction | Base date and value |
|---|---|---|
| Dow Jones Industrial Average | 30-stock, price-weighted index of large U.S. companies, excluding transportation and utilities | May 26, 1896 at 40.94 |
| Dow Jones Transportation Average | 20-stock, price-weighted index of large U.S. transportation companies | October 26, 1896 at 51.72 |
The railroad average was renamed the Transportation Average in 1970, and today it covers airlines, trucking, logistics and air freight alongside railroads. That change is the strongest structural criticism of the classic pairing, because the link between manufacturing output and freight volume is looser than it was in Dow's time.
The principle survives in a more general form, often called intermarket confirmation. Traders compare a broad index with a related index or sector, equities with credit or interest rates, or an asset with the currency it is priced in. The question stays the same: does evidence outside this chart agree with the story on it?
Volume Confirmation in Dow Theory
Volume is Dow Theory's secondary witness. The idea is that a move on heavy participation reflects the market's real view, while a move on thin participation could be one aggressive buyer or seller.
Rhea's version is more specific than the usual summary. An overbought market becomes dull on rallies and active on declines. An oversold market becomes dull on declines and active on rallies. Bull markets end in a period of excessive activity and begin with comparatively light trading.
That gives a practical reading:
- Healthy uptrend. Volume expands on rallies and contracts on pullbacks.
- Tiring uptrend. Rallies come on lighter volume while declines draw heavier volume.
- Possible climax. A burst of unusually heavy volume near a high, after a long advance.
Not every Dow theorist agreed volume belonged in the theory. Hamilton wrote in an editorial of January 5, 1911 that he preferred to neglect volume, believing the averages already allowed for it. Rhea later accepted volume as a useful guide. That history is why most modern versions treat volume as supporting evidence rather than a signal on its own. Price structure on both averages decides the trend, and volume only raises or lowers your confidence in it.
Related lesson: What is volume
A Worked Dow Theory Example of Confirmation and Divergence
The clearest way to understand Dow Theory is to run two averages through a full cycle. The levels below are illustrative round numbers for two unnamed averages, chosen so the logic stays visible. They do not describe any real market episode. Every swing exceeds Rhea's 3% threshold, so each row counts as a rally or decline.
| Point in the cycle | Industrials | Industrials move | Transports | Transports move | What the pair shows |
|---|---|---|---|---|---|
| Primary low | 40,000 | Origin | 15,000 | Origin | Both averages start from a reference low |
| First peak | 44,000 | Up 10.00% | 16,500 | Up 10.00% | Higher high on both, confirmed |
| First pullback low | 42,400 | Down 3.64% | 15,800 | Down 4.24% | Higher low on both, confirmed |
| Second peak | 45,320 | Up 6.89% | 16,300 | Up 3.16% | Industrials make a new high, transports do not |
| Second pullback low | 43,700 | Down 3.57% | 15,600 | Down 4.29% | Industrials hold a higher low, transports make a lower low |
| Lower high | 45,100 | Up 3.20% | 16,100 | Up 3.21% | Both averages fail to reach their prior peak |
| Reversal | 42,900 | Down 4.88% | 15,300 | Down 4.97% | Both break their last pullback low |
Reading the Dow Theory example row by row
Here is how a Dow theorist reads the two illustrative averages, one decision at a time.
First three rows, a confirmed uptrend. Both averages make a higher high, then a higher low. The pullbacks retrace 40.00% of the advance on the industrials and 46.67% on the transports, both inside Rhea's 33% to 66% band for a secondary reaction. The primary trend is up.
Second peak, an unconfirmed high. The industrials break their first peak by 3.00%. The transports stall 1.21% below theirs. Under the confirmation tenet, the industrial high proves nothing on its own. This is the row that tempts you most, because the headline average is making new highs. The disciplined response is to hold existing risk rather than add to it, and to note that the trend is now waiting on the transports.
Second pullback low, a divergence. The industrials retrace 55.48% and still hold a higher low, 3.07% above their first low. The transports break their first low by 1.27%. The transports now show a lower high and a lower low on their own. That is a warning, not yet a signal, because the industrials have not agreed. Calling the top here would be the same mistake as buying the unconfirmed high, just in the other direction.
Lower high, the first bearish agreement. Both averages rally and fail below their prior peaks, the industrials by 0.49% and the transports by 1.23%. The structure is weakening on both.
Reversal, the signal. The industrials fall to 42,900, 1.83% below their last pullback low of 43,700. The transports fall to 15,300, 1.92% below 15,600. Now both averages show lower highs and lower lows, and the primary uptrend is called over.
Notice what the signal is not. It is not the unconfirmed high, not the divergence, and not a fixed percentage drop. It is a structural break on both averages, and it arrives well after the top. At the reversal print the industrials sit 5.34% below their 45,320 peak.
What Waiting for Dow Theory Confirmation Costs
The fair objection to Dow Theory is that a rule requiring a second average to agree will always fire late. That objection is correct, so it is worth pricing rather than arguing about.
Using the same illustrative industrial levels, compare three exit rules after the advance from 40,000 to the 45,320 peak, a gain of 13.30%. Each rule is priced at its own trigger level.
| Exit rule | Industrials exit level | Given up from the peak | Kept from the origin | Points surrendered |
|---|---|---|---|---|
| Exit on the first lower high | 45,100 | 0.49% | 12.75% | 220 |
| Exit on the break of the last confirmed pullback low | 43,700 | 3.57% | 9.25% | 1,620 |
| Wait for the primary low to fail | 40,000 | 11.74% | 0.00% | 5,320 |
Choosing a Dow Theory exit rule
The fast exit on the first lower high keeps the most, but only if you decide in real time that a lower high is the last high. In practice that rule also exits every ordinary pullback that later resumes, so its cost shows up as many small whipsaws rather than one large giveback.
The Dow Theory exit gives up 3.57% from the peak, roughly the size of one secondary reaction, and in exchange it never asks you to forecast. Waiting for the primary low to fail gives back the whole advance.
Whether the middle rule is a good bargain depends on how many unconfirmed highs you would otherwise have traded as reversals. That count only exists in your own journal, measured over a meaningful sample.
Related lesson: Trend following
Dow Theory Lines and Sideways Markets
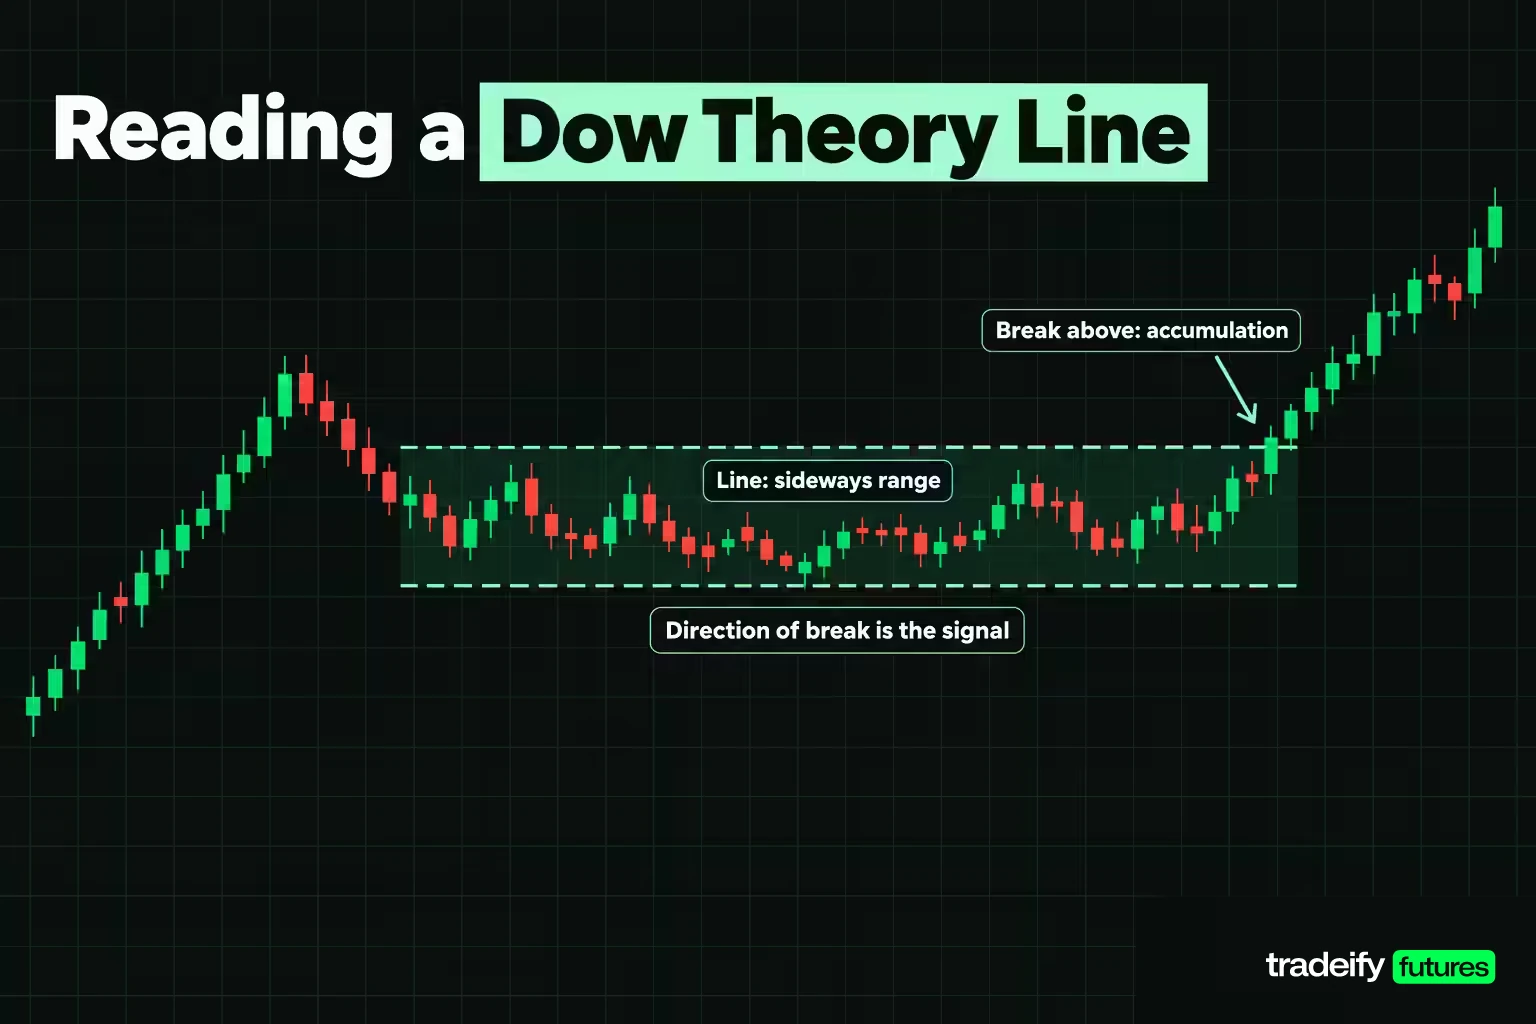
A line is Dow Theory's name for a sideways market, and it is one of the most practical parts of Rhea's version. He defined a line as a movement lasting two to three weeks or longer during which both averages stay within a range of roughly 5%. It signals accumulation or distribution, and the direction of the eventual break is the information.
The band is a percentage for a reason. A 5% line on an average starting at 44,000 runs to 46,200, a band 2,200 points wide. The same 5% line on an average starting at 15,000 runs to 15,750, only 750 points wide. A line described in points would mean something different on each average.
How to read a line in Dow Theory:
- Both averages inside the band. The trend question is unresolved. Doing nothing is a legitimate decision.
- One average breaks out, the other does not. Still unconfirmed. Rhea warned that conclusions from one average alone generally prove incorrect.
- Both break above the band. Read as accumulation, with higher prices more likely.
- Both break below the band. Read as distribution, with lower prices more likely.
The judgment call is deciding when a band has formed, and that is where Dow Theory stops being mechanical.
Related lesson: Support and resistance
How to Apply Dow Theory as a Trend Checklist
Dow Theory works best as a checklist you run before you make a trend claim, not after you have taken a position. A practical routine:
- Choose the pair before you choose the trade. Pick two instruments with a genuine economic link, not two tickers that happen to move together for a few weeks.
- Label the swings with a minimum threshold. Use closing prices and Rhea's 3% rule, or a threshold scaled to your timeframe, so the labels do not change every session.
- Classify both instruments the same way. Higher high and higher low, or lower high and lower low. If the two classifications differ, write "unconfirmed" and stop there.
- Check volume as supporting evidence. Expanding volume with the trend raises confidence. Volume never overrides the price structure.
- Write the invalidation level before you need it. In an uptrend, that is the last confirmed pullback low on both instruments. Keep the exit rule fixed for a full sample of trades so you can judge it honestly.
Mistakes that break a Dow Theory checklist
Two temptations break a Dow Theory routine more often than anything else. The first is acting on an unconfirmed high because it looks strong and you are afraid of missing it. The second is moving the invalidation level after a bad week because the last exit felt too early. Both turn a testable filter into a story you tell yourself.
Dow Theory also leaves out the decisions that protect an account. It has no position size rule, no stop placement rule and no loss limit. Those are separate choices you make before any trend reading.
Applying Dow Theory Confirmation to Futures, Forex, Commodities and Crypto
Dow Theory was written for two U.S. stock averages, the industrials and the railroads, but its confirmation rule can be applied to other markets if you choose the second instrument carefully. The pair should share an economic reason to move together.
| Market | Common confirmation pairing | What to watch for |
|---|---|---|
| Equity index futures | A broad index against a related index, such as large caps against small caps or industrials against transports | Pairs can diverge for long stretches when one sector leads |
| Forex | A currency pair against a broad index of the base or quote currency | Using one index instead of a second average changes what confirmation means |
| Commodities | A commodity against producers or a related commodity | Supply shocks can move one side without the other |
| Crypto | A large coin against the broader market of coins | Short history and fast regime changes weaken the comparison |
Dow Theory for intraday futures traders
Timeframe is the bigger adjustment when applying Dow Theory outside its original setting. Rhea's movements run for weeks to years. An intraday trader who applies Dow Theory to five-minute bars is borrowing the swing logic, not the original theory, and should test the thresholds on their own market before trusting them.
For intraday futures traders, the most useful version of Dow Theory is context. The daily and weekly structure on two related indexes tells you which direction deserves the benefit of the doubt, and intraday trades are taken or skipped with that context in mind.
On our accounts, positions are closed by 4:45 PM ET on regular trading days and cannot be held overnight, so Dow Theory's primary trend works as a filter for intraday setups rather than a holding period. The equity index futures we support include the E-mini Dow (YM) and Micro E-mini Dow (MYM) alongside ES, NQ and RTY, which makes the confirmation idea easy to check across related indexes. Use the second index as a read, not a trade: holding opposite positions in two products from the same Product Group, such as long ES and short NQ, counts as hedging and is not allowed. Our funded accounts are simulated.
Related lesson: Multiple timeframe analysis
Dow Theory Compared With Modern Indicators
Dow Theory is often compared with modern trend tools. The main difference is that Dow Theory asks a yes or no question about structure across two instruments, while most indicators summarize one instrument's price with a formula.
| Tool | What it measures | Main strength | Main weakness |
|---|---|---|---|
| Dow Theory | Swing structure across two related averages, with volume as support | Clear invalidation level and a demand for outside evidence | Slow, discretionary swing labels, needs a natural pair |
| Moving averages | Average price over a set lookback | Mechanical and easy to test | Lags price and whipsaws in sideways markets |
| MACD | Gap between two moving averages and its signal line | Shows momentum shifts earlier than a crossover of price | Gives many false signals in ranges |
| Elliott Wave | Position of the current move inside a repeating wave pattern | Offers a sequence and possible targets | Wave counts are highly subjective and often revised |
| Market structure on one chart | Higher highs and lows on a single instrument | Fast and easy to apply intraday | No outside confirmation |
These tools are not rivals. A common approach uses Dow Theory to set direction on a higher timeframe and a mechanical indicator to time entries on a lower one. The risk is stacking so many tools that one of them always agrees with what you already wanted to do. If you add a tool, decide in advance which one wins when they disagree.
Related lesson: Elliott Wave theory
Dow Theory Accuracy and the Academic Record
There is a real academic record on Dow Theory, and it does not point in one direction. Both major studies use the same material: Hamilton's editorials from 1902 to 1929.
Cowles, 1934. Alfred Cowles coded Hamilton's editorials as bullish, bearish or neutral and traded them. His result was that the strategy returned 12% a year while staying fully invested in stocks returned 15.5%. He read that as evidence that Dow Theory does not work. Cowles also noted that Hamilton was long 55% of the time, short 16% and out of the market 29%.
Brown, Goetzmann and Kumar, 1998. Writing in the Journal of Finance, they argued that Cowles never adjusted for risk. A strategy that spends much of its time out of the market or short should earn less than a fully invested one. With risk adjustment, they found Hamilton's timing strategies "yield high Sharpe ratios and positive alphas" for 1902 to 1929. They also found that his calls followed a momentum pattern.
Neither study gives a hit rate for the confirmation rule today. The fair summary is that Dow Theory was not the failure the 1934 study suggested, and it is not a proven edge either.
The 1929 Dow Theory signal
One historical case shows Dow Theory working as designed. On October 25, 1929, Hamilton published an editorial in The Wall Street Journal titled "A Turn in the Tide". It reported that the twenty railroad stocks had, on October 23, confirmed a bearish indication the industrials had given two days earlier, signalling a bear market after a bull market of almost six years.
The 1929 sequence is the Dow Theory confirmation rule in action. The industrials gave the first warning, the railroad average confirmed it, and the signal came after the peak rather than at it. A single episode proves nothing about future reliability, but it shows what the rule looks like in practice.
Dow Theory Limitations and Common Mistakes
Dow Theory has real strengths: it defines a trend precisely, it forces you to look for outside evidence, and it gives you an invalidation level before you need one. Its weaknesses are just as specific.
- The lag is structural. Confirmation means a reversal is identified after it starts, typically at a cost of about one secondary reaction.
- Swing labels are discretionary. Two traders can place the last secondary low at different prices on the same chart, which changes the invalidation level.
- The original pairing has changed. Both Dow averages have been rebuilt many times, and the manufacturing and freight link is weaker than it was.
- The record is small and old. It rests largely on one editor and one market over 27 years.
- It cannot be tested in real time. Whether a move was a secondary reaction or a reversal is settled by what happens next.
The common mistakes are behavioral:
- Treating one average's new high as a signal. That is exactly what the theory says not to do.
- Mixing layers. Calling a daily fluctuation a reversal of the primary trend.
- Using delayed or inconsistent data. Swing labels built on different closing times for two instruments can create false divergences.
- Ignoring position size. Dow Theory says nothing about how much to risk, so it needs a separate risk plan.
Related lesson: Technical analysis complete beginner guide
Dow Theory FAQ
What does the Dow Jones represent?
The Dow Jones Industrial Average is a 30-stock, price-weighted index of large U.S. companies across most sectors, excluding transportation and utilities. It launched on May 26, 1896 at 40.94. Because it is price-weighted, a high-priced stock moves it more than a low-priced one.
What is the Dow Theory and how does it explain stock market trends?
Dow Theory explains trends through swing structure confirmed across two related averages. Higher highs and higher lows on both define an uptrend, and lower highs and lower lows on both define a downtrend. The trend is assumed to continue until both averages break their last secondary swing.
How do you determine the direction of the stock market?
Under Dow Theory, you label the swing highs and lows on a broad index and on a related index, using a minimum swing size. If both show higher highs and higher lows, the direction is up. If they disagree, the direction is unconfirmed.
What is the 3-5-7 rule in trading and how does it work?
The 3-5-7 rule is a risk rule of thumb that caps risk at 3% of the account per trade and 5% across all open trades, and aims for winners at least 7% larger than losers. It is not part of Dow Theory. Versions vary between sources, so treat it as a starting framework rather than a standard.
What are the top 3 trading strategies?
Trend following, mean reversion and breakout trading are three of the most widely taught trading strategies, although there is no official top three. Dow Theory sits closest to trend following. Any strategy needs testing on your own market and timeframe before you trust it.
Is Dow Theory still relevant today?
The structure is still relevant: swing labelling, trend definition and the demand for confirmation all underpin modern technical analysis. The classic pairing of the industrial and transportation averages measures a weaker relationship than it did in Dow's time.
What is the difference between Dow Theory and Elliott Wave Theory?
Dow Theory asks whether two averages confirm a trend and supplies an invalidation level. Elliott Wave Theory tries to place the current move inside a repeating wave pattern and supplies a sequence. Dow Theory needs a second instrument, while Elliott Wave works on one chart.
This article is general education about one framework for reading market trends and is not investment advice or a recommendation to trade any product. Futures and other leveraged instruments can lose more than expected, and trends that look confirmed on a chart can reverse quickly. Funded and evaluation accounts are simulated, and simulated results do not represent results in a live account. The worked example uses illustrative numbers, not real market data.


