




TL;DR: Technical analysis is the study of price, volume and time to read market context and find where a trade idea is wrong. Its core tools are support and resistance, chart patterns, moving averages and the 14-period RSI. A 2007 review of 95 studies found 56 with positive results but flagged data snooping, so treat charts as odds, not predictions. Write every read as an if-then with a stop, and judge it over a sample set in advance.
Most beginners meet technical analysis as a screen full of lines, and the first thing they ask is which indicator works. It's a fair question. It's just not the first one. Technical analysis is a way of reading the record of what traders actually did, so the better question is what that record can honestly tell you, and what it cannot.
This guide covers the definition, the assumptions underneath it, the main tool families, support and resistance, chart patterns, two indicators calculated by hand, entries and exits, the comparison with fundamental analysis, and an honest look at the evidence. Worked examples use illustrative E-mini S&P 500 prices so you can see what each idea costs in dollars.
What Technical Analysis Is
Technical analysis is the practice of studying market data, mainly price, volume and time, to describe current conditions and estimate the odds of what happens next. It looks at the transactions themselves rather than at what an asset should be worth.
Every price on a chart is a trade that a buyer and a seller agreed to. Stack enough of those trades together and you get a record of where buyers kept stepping in, where sellers kept winning, how fast price moved and how much volume it took to move it. Technical analysis reads that record.
The output is a description with conditions attached, not a forecast. A useful technical read sounds like this: buyers have defended this area three times, so longs make sense while price holds above it, and the idea is wrong on a close below it. That sentence has an observation, a condition, an action and an invalidation. A prediction like "the market goes up from here" has none of those.
The academic name for the craft is sometimes simply charting. Researchers Andrew Lo, Harry Mamaysky and Jiang Wang described it as part of financial practice for many decades, while noting its main weakness: the shapes traders see in charts are often in the eye of the beholder.
There is a regulatory reason to keep the description honest too. In the US, FINRA Rule 2210 says broker communications may not predict or project performance or imply that past performance will recur, with narrow exceptions. Anyone selling a chart method with promised returns is making a claim a regulated broker could not make. Treat it as marketing, not information.
Related lesson: What is price
The Assumptions Behind Technical Analysis
Technical analysis rests on three assumptions. They are assumptions, not laws, and knowing where each one bends saves you from trusting a chart more than it deserves.
- Price reflects what participants know and expect. Public news, earnings expectations and rate changes show up in the price as traders act on them. The chart is the net result of everyone's opinion, weighted by the money behind it.
- Prices tend to move in trends. Moves come in stretches rather than as unrelated single steps, so an existing direction is more likely to continue than to reverse without warning. This is the assumption that trend-following rests on.
- Behavior repeats. Traders react to fear, greed, round numbers and old highs in similar ways over time, so similar shapes recur on charts. This is the shakiest of the three, because pattern recognition depends on the person doing the recognizing.
Each assumption has a place where it bends. The first breaks most visibly around scheduled news, when price jumps to a new level in seconds and the chart before the release says little about the chart after it. The second breaks in ranges, where a trend tool keeps flipping direction. The third breaks when you start seeing patterns because you want a trade, which happens more often after a loss than anyone likes to admit.
Dow Theory and the Origin of Trend Analysis
Dow Theory is the oldest framework in technical analysis and the source of most trend vocabulary. Charles Dow was part-owner and editor of The Wall Street Journal until his death in 1902, and he wrote editorials on how the rail and industrial averages behaved. William Hamilton refined the ideas in Journal articles from 1902 to 1929, and Robert Rhea organized them in his 1932 book, The Dow Theory.
Its core ideas still show up in modern charting:
- The averages discount everything, which is the same idea as the classic premise that price reflects what participants know.
- Markets have three kinds of movement. Primary movements last from a few months to many years, secondary movements run against them for a few weeks to a few months, and daily fluctuations last from a few hours to a few days.
- A primary trend stays in effect until it is proved otherwise.
- The averages must confirm each other, so a new high in one average needs a matching move in the other.
- Volume confirms a trend, but price is the deciding factor.
You do not need to trade Dow Theory to use it. Its main gift is the habit of asking which trend you are looking at, and whether the evidence confirms it or only one chart does.
Related lesson: Dow theory
How Traders Use Technical Analysis
Technical analysis is used for five practical jobs, and each one uses the chart differently.
- Choosing what to watch. A trader scans for markets that are trending cleanly, sitting at an obvious level, or unusually quiet before a known event. The chart narrows the list before any trade is considered.
- Timing an idea. An investor who has already decided a stock is worth owning may use a pullback to a moving average or a support area to pick an entry, rather than buying at a random moment.
- Placing risk. The chart shows where a trade idea is wrong. That price becomes the stop, and the distance to it sets position size.
- Managing an open trade. Trailing a stop under each new higher low, or taking partial profit at a prior high, are technical decisions.
- Reviewing results. Screenshots of entries and exits, tagged by setup, show whether a method works or only felt like it did.
The same tools serve very different holding periods. A long-term investor may only look at weekly charts. A futures day trader may watch one-minute and five-minute charts and never hold past the session.
How the Chart Timeframe Changes Technical Analysis
Your timeframe decides what a setting really measures. E-mini S&P 500 futures trade on CME Globex from 6:00 PM to 5:00 PM ET, Sunday to Friday, with a one-hour daily maintenance break. That is 23 hours a session and roughly 115 hours across a five-session week.
| Chart timeframe | Bars in a 115-hour week | What a 20-bar average covers |
|---|---|---|
| 1 minute | 6,900 | 20 minutes |
| 5 minute | 1,380 | 100 minutes |
| 15 minute | 460 | 300 minutes, or 5 hours |
| 1 hour | 115 | 20 hours |
| 4 hour | about 29 | 80 hours, about three and a half sessions |
The same "20-period" setting looks back 20 minutes on one chart and most of a trading week on another. So when someone says a 20-period average is reliable, the first thing to ask is which market and which timeframe. A setting means nothing until it is attached to both.
Related lesson: Multiple timeframe analysis
The Four Families of Technical Analysis Tools
Almost every tool on a charting platform belongs to one of four families. Each family measures something different and fails in a different way, so sorting a tool into its family tells you what evidence it can give you.
| Tool family | Examples | What it can tell you | What it cannot tell you |
|---|---|---|---|
| Descriptive | Candlestick, bar, line and Renko charts, volume bars | How the market is shaped and where activity sat | Whether anything happens next |
| Structural | Support and resistance, trendlines, swing highs and lows, gaps | Where price reacted before and what would invalidate that | How strong a level is or who else sees it |
| Indicator | Moving averages, RSI, MACD, stochastics | How recent prices compare with their own recent history | Anything the price series does not already contain |
| Context | Volatility, volume, session timing, scheduled news | What conditions a trade is taken in, and so how much size it deserves | Which way price resolves |
The indicator family causes the most beginner trouble. An indicator is arithmetic applied to price or volume, so it can never hold information the price series lacks. A moving average, a MACD line and a stochastic built from the same closing prices are three views of one input. When they all agree, you have one observation counted three times, not three confirmations.
A sounder check combines families. A support level (structural) with rising volume on the test (context) and a bar that closes well off its low (descriptive) gives you three different kinds of evidence. That is real agreement.
Related lesson: Trading chart types
Price Action and Supply and Demand
Price action is the branch of technical analysis that reads price itself, with little or no help from indicators. It treats every bar as a short report on the fight between buyers and sellers.
The logic is supply and demand. When buyers want more contracts than sellers will offer at the current price, they have to pay up, and price rises until enough sellers appear. When sellers are more eager, price falls until buyers step in. A chart is the visible trail of those imbalances.
Price action traders look at a few things:
- Where the bar closes inside its range. A bar that trades down and then closes near its high shows sellers pushed and buyers took it back. A close near the low shows the opposite.
- Range size. Bars that suddenly get wider show more urgency. Bars that shrink show a market losing interest or waiting for news.
- Swing structure. A run of higher highs and higher lows is an uptrend; lower highs and lower lows are a downtrend. When a market in an uptrend makes a lower low, the description has changed.
- Volume. Volume shows participation. A breakout on heavy volume tells you many traders acted. A breakout on thin volume tells you few did, and it has less behind it.
Price action is not a separate discipline from technical analysis. It is the base layer. Indicators summarize price action after the fact, which is why many traders learn to read bars first.
Related lesson: Price action trading
Support and Resistance Levels
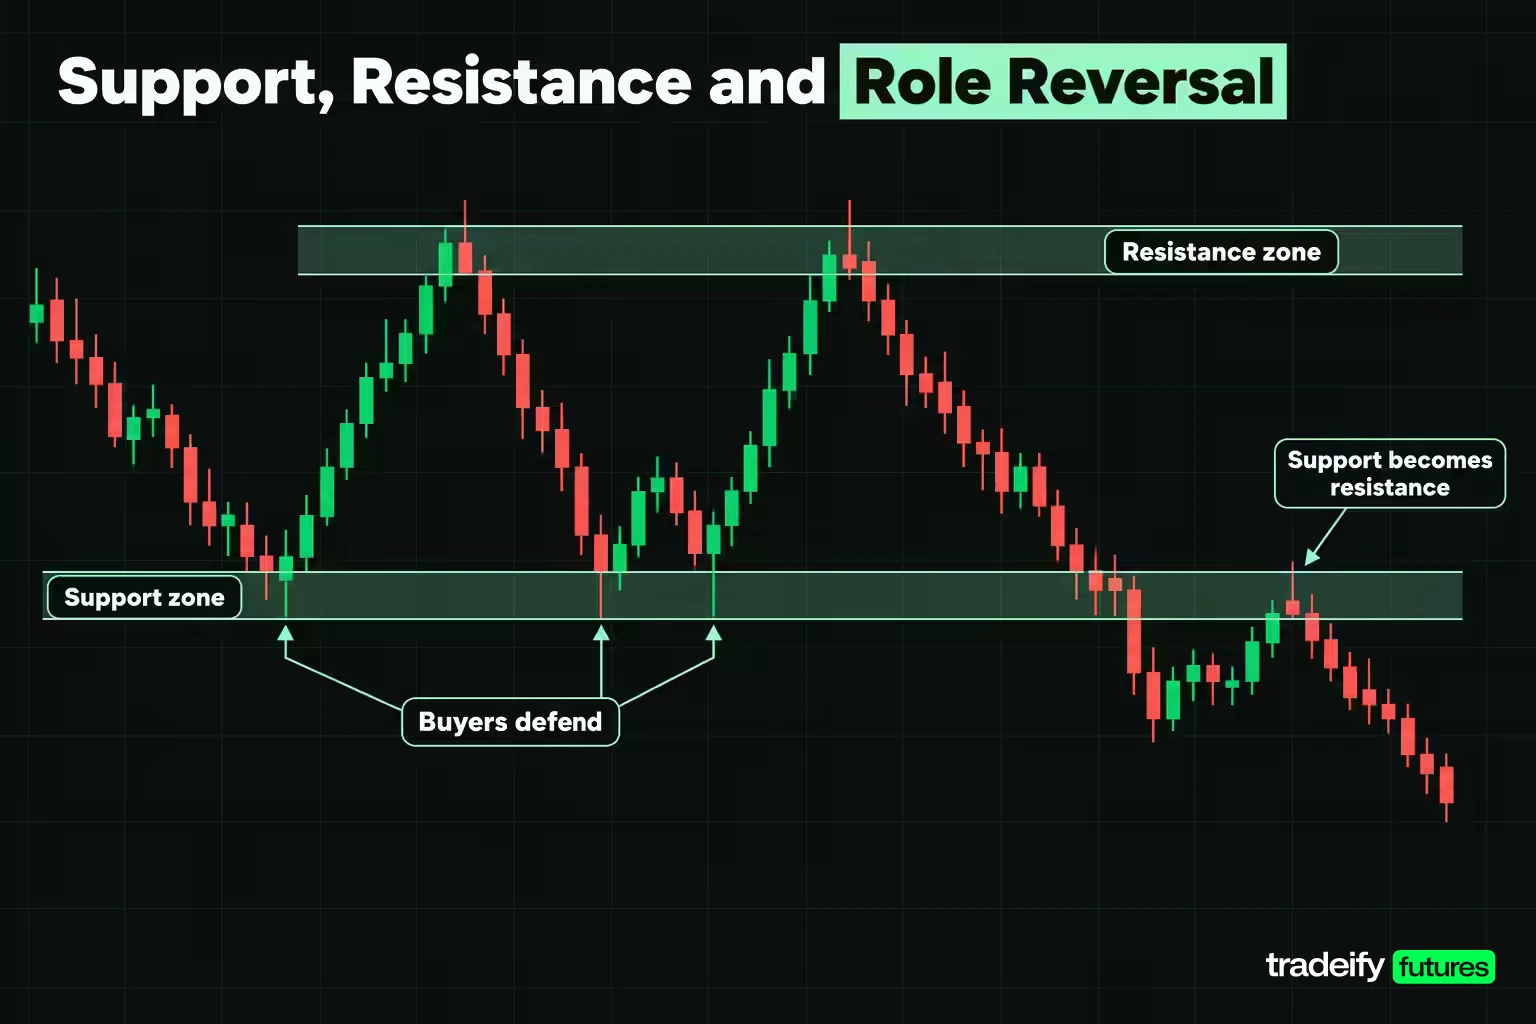
Support is a price area where buying has repeatedly stopped a decline. Resistance is an area where selling has repeatedly stopped a rally. They form because traders remember prices: buyers who missed the last bounce wait for the same area, and traders stuck in losing positions sell when price returns to where they got in.
Mark these as zones, not single ticks. Price rarely turns at the exact same tick twice, and a zone a few points wide reflects how orders actually cluster. Give every level a reason: "buyers absorbed selling here on three tests" is a reason; "it looks like a line" is not.
Two habits make levels more useful:
- Count the tests, but don't trust the count too much. Each test shows the level mattered. Each test also uses up some of the resting buy orders, so a level hit many times can be weaker, not stronger.
- Watch for role reversal. Once support breaks and price holds below it, the same area often acts as resistance, because traders who bought there now want out at break-even.
When a Support Level Breaks
Here is an illustrative case. Say E-mini S&P 500 futures held support near 6,000.00 three times. A trader buys at 6,004.00 with a stop at 5,994.00, ten points below entry. On the E-mini at $50 per point that is $500 of risk per contract. On the Micro E-mini at $5 per point it is $50.
On the fourth test, price closes at 5,990.00 and stays there. The stop fills. Nothing about the analysis was fake: buyers really did defend 6,000.00 three times. The read was still wrong, because support describes past behavior and never obliges the future.
What separated a planned loss from an ugly one was a stop sitting at a price before the trade opened. The temptation in that moment is to give the level "one more chance" and move the stop lower. That turns a $500 loss into an open-ended one. "I will get out if the level fails" is a hope. A stop order at 5,994.00 is a decision already made. The other lesson is that 6,000.00 now has a new job: buyers trapped above it may sell into any rally back to that area.
Related lesson: Support and resistance
Chart Patterns in Technical Analysis
Charts turn a list of trades into a visual record of price history. The chart type you choose changes how that history looks, not what happened.
- Line charts connect closing prices. They are clean but hide the range of each period.
- Bar charts show open, high, low and close (OHLC) for each period.
- Candlestick charts show the same four prices, with a filled or colored body between open and close. Most traders use them because the body makes the winner of each period easy to see.
Continuation and Reversal Chart Patterns
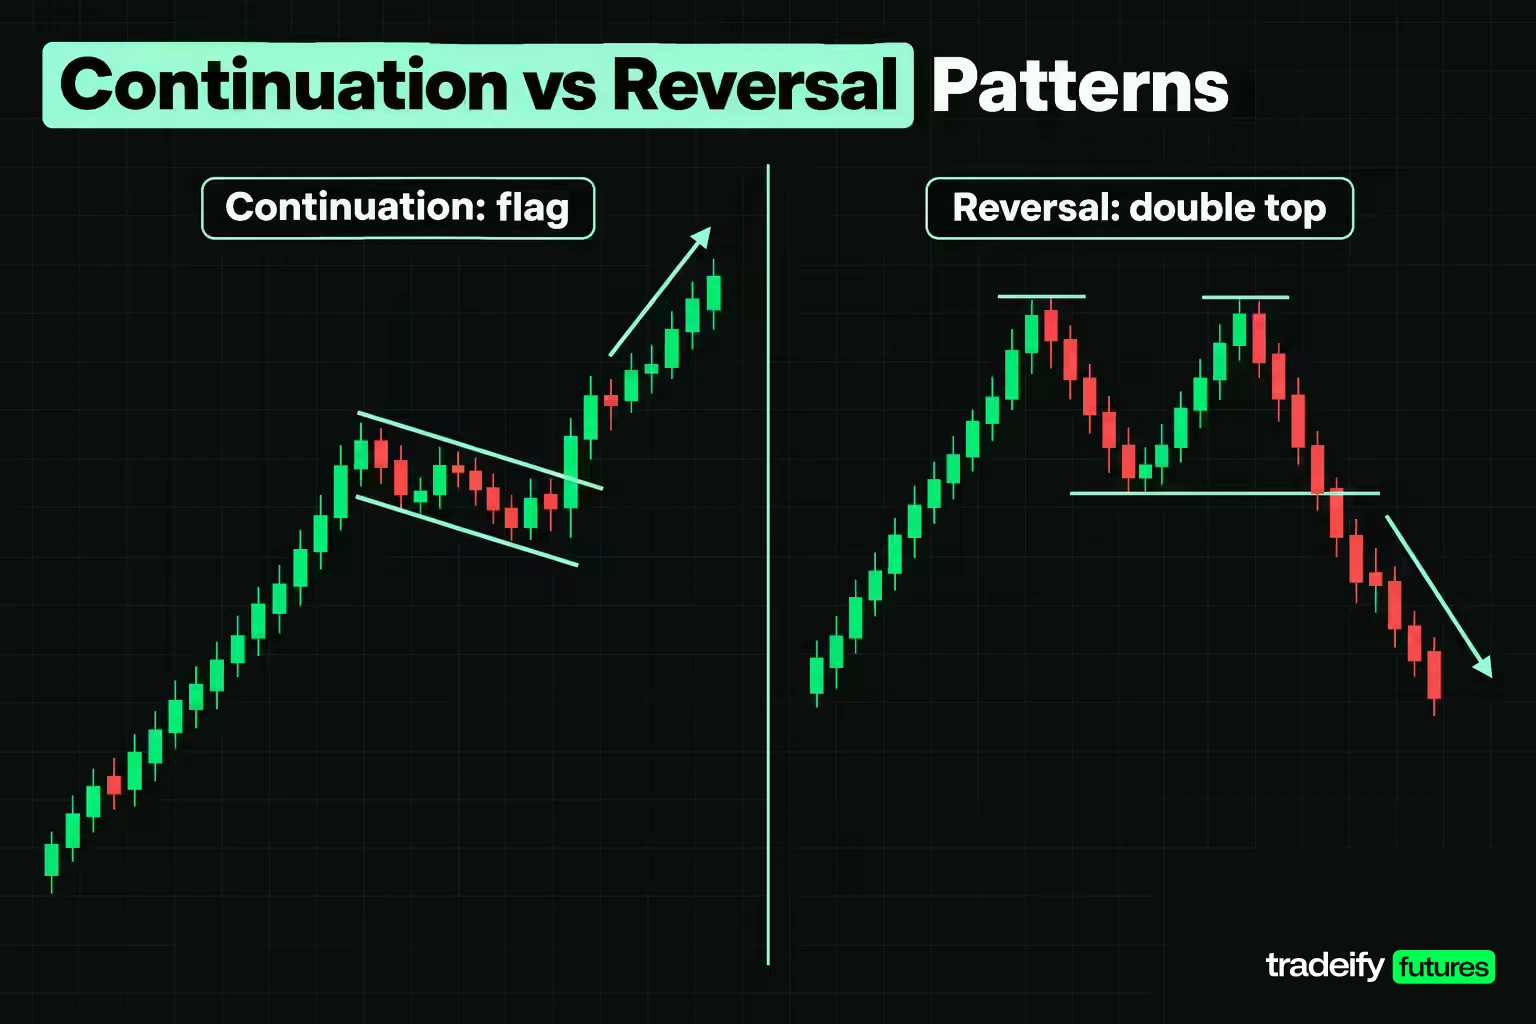
Chart patterns are recurring shapes in price history. They fall into two broad groups, plus single-bar candlestick signals:
| Pattern group | Common examples | What the pattern suggests | What would cancel it |
|---|---|---|---|
| Continuation | Flags, pennants, ascending and descending triangles | A pause before the existing trend resumes | Price breaking the opposite side of the pattern |
| Reversal | Head and shoulders, double tops and bottoms, rounded bottoms | The existing trend is losing force and may turn | Price reclaiming the pattern's extreme |
| Candlestick | Engulfing bars, hammers, dojis | A shift in control within one to three bars | The next bars failing to follow through |
The honest problem with patterns is subjectivity. Two traders can look at the same chart and see different shapes, and a trader who wants to buy tends to see bullish ones.
Research tried to fix that by defining patterns mathematically. Lo, Mamaysky and Wang used a computer method called kernel regression to detect patterns such as head-and-shoulders and double bottoms on a large number of US stocks from 1962 to 1996. They found several technical patterns did provide incremental information and may have some practical value. Note the careful wording: information, not reliable profit.
The practical takeaway is to define a pattern so precisely that a stranger could mark it on your chart without asking you a question. If you cannot, you are trading a feeling.
Indicators Worked by Hand
Indicators look like black boxes until you compute one yourself. Doing it once by hand shows you exactly what an indicator knows, and what it does not.
Moving Average Lag in Points and Dollars
A simple moving average (SMA) is the mean of the last N closes. An exponential moving average (EMA) weights recent closes more heavily using a multiplier of 2 divided by N plus 1. For a 5-period EMA that multiplier is 0.3333, meaning each new close gets about a third of the weight.
Here are ten illustrative E-mini S&P 500 session closes. The EMA starts from the first SMA value.
| Session | Close | 5-period SMA | 5-period EMA | Close minus SMA |
|---|---|---|---|---|
| 1 | 6,000.00 | not enough data | not enough data | none |
| 2 | 6,008.00 | not enough data | not enough data | none |
| 3 | 6,004.00 | not enough data | not enough data | none |
| 4 | 6,012.00 | not enough data | not enough data | none |
| 5 | 6,016.00 | 6,008.00 | 6,008.00 | 8.00 |
| 6 | 6,012.00 | 6,010.40 | 6,009.33 | 1.60 |
| 7 | 6,020.00 | 6,012.80 | 6,012.89 | 7.20 |
| 8 | 6,028.00 | 6,017.60 | 6,017.93 | 10.40 |
| 9 | 6,024.00 | 6,020.00 | 6,019.95 | 4.00 |
| 10 | 6,032.00 | 6,023.20 | 6,023.97 | 8.80 |
In session 10 the close is 6,032.00 and the SMA is 6,023.20, so the average trails price by 8.80 points. That gap is the lag. On the E-mini at $50 per point it is $440 per contract. On the Micro E-mini at $5 per point it is $44.
That changes how you use the average. A trader who waits for price to pull back to a 5-period SMA in a steady uptrend is waiting for a move worth $440 per E-mini contract before the "signal" even appears. Longer averages lag more. The average is a summary of where price has been, so it can never warn you before price turns.
Related lesson: Moving averages SMA vs EMA
A 14-Period RSI Calculation
The Relative Strength Index (RSI) is a momentum oscillator developed by J. Welles Wilder and published in his 1978 book, New Concepts in Technical Trading Systems. It runs from 0 to 100. Readings above 70 are commonly called overbought and readings below 30 oversold.
The math is short:
- Measure each close-to-close change and split it into gains and losses.
- The first average gain is the sum of gains over 14 periods divided by 14. The first average loss works the same way.
- After that, each new average equals the previous average times 13, plus the current gain or loss, divided by 14.
- Relative strength (RS) equals average gain divided by average loss.
- RSI equals 100 minus 100 divided by (1 plus RS).
Take 20 illustrative closes: 100.00, 100.50, 100.25, 101.00, 101.75, 101.50, 102.25, 102.00, 102.75, 103.50, 103.25, 104.00, 104.50, 104.25, 105.00, 104.50, 104.00, 104.25, 103.50 and 103.00. Over the first 14 changes, gains total 6.25 and losses total 1.25.
| Bar | Close | Average gain | Average loss | RS | RSI |
|---|---|---|---|---|---|
| 15 | 105.00 | 0.4464 | 0.0893 | 5.0000 | 83.33 |
| 16 | 104.50 | 0.4145 | 0.1186 | 3.4946 | 77.75 |
| 17 | 104.00 | 0.3849 | 0.1459 | 2.6390 | 72.52 |
| 18 | 104.25 | 0.3753 | 0.1354 | 2.7708 | 73.48 |
| 19 | 103.50 | 0.3485 | 0.1793 | 1.9431 | 66.02 |
| 20 | 103.00 | 0.3236 | 0.2022 | 1.6000 | 61.54 |
What the RSI Example Shows
In this 14-period RSI example, at bar 15 the RSI reads 83.33, well above 70. Over the next five bars price gives back 2.00 points, yet the RSI is still 61.54, above the 50 midpoint, because gains from earlier in the window still dominate the averages.
Two lessons come out of this. First, "overbought" describes a lopsided run of recent gains, not a price that has to fall. In a strong trend RSI can sit above 70 for a long time. Second, RSI reacts to its own window, so a change of period setting gives a different number from the same prices. Use RSI to describe whether recent closes are dominated by gains or losses, and to flag when that stops agreeing with price.
Related lesson: Relative strength index RSI
Entry and Exit Points in Technical Analysis
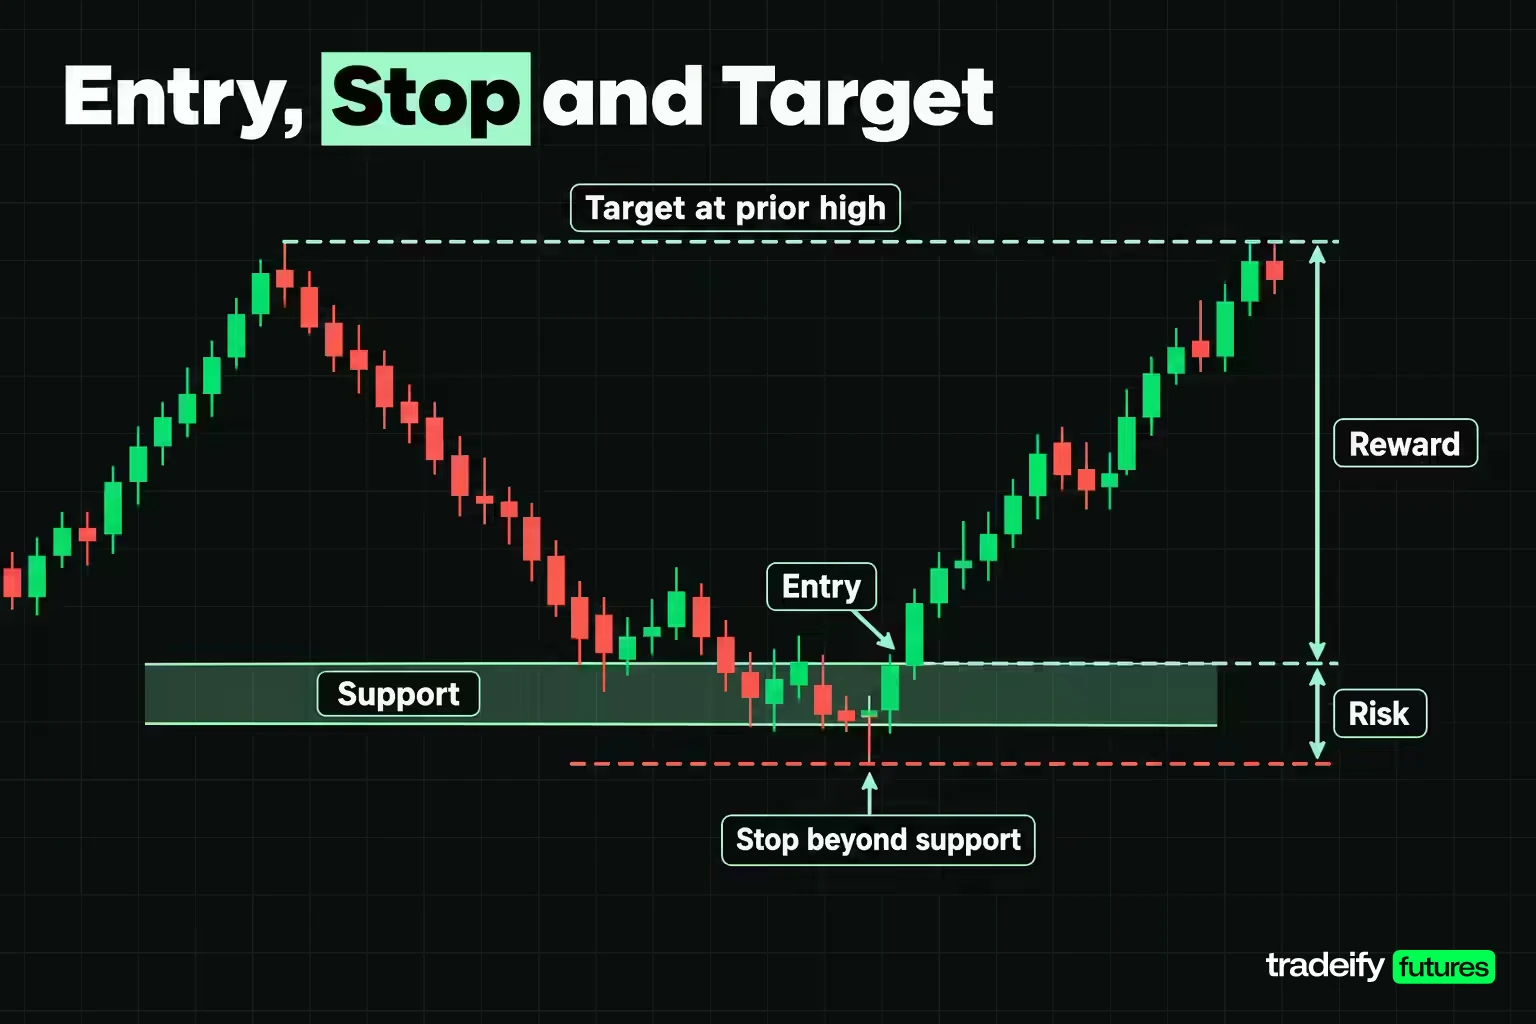
Technical analysis is most useful at the point where a read becomes a trade. Every trade needs three prices decided before you click: entry, stop and target.
- Entry comes from the condition you wrote. "Long on a bar that closes back above support after a test" is a condition; "long because it feels low" is not.
- Stop goes where the read is wrong, not where the loss feels comfortable. If the idea is that buyers defend a level, the stop belongs beyond that level, because a sustained trade through it disproves the idea.
- Target usually sits at the next structural area, such as a prior swing high or an obvious resistance zone.
Then check whether the trade is worth taking. Take an illustrative E-mini S&P 500 long above support near 6,000.00: entry at 6,004.00 and a stop at 5,994.00 risk 10 points. A target at a prior high of 6,024.00 offers 20 points. That is a 2 to 1 reward-to-risk ratio: $1,000 potential gain against $500 risk on one E-mini, or $100 against $50 on one Micro E-mini.
At 2 to 1, the method breaks even before costs if it wins about 33.3% of the time (1 divided by 3). Commissions and slippage push that number higher. If the nearest resistance is only 5 points away, the trade offers 0.5 to 1 and needs a win rate above 66.7% to break even, which is a good reason to skip it.
Size comes last. Decide the dollar risk you accept per trade, divide by the stop distance in dollars per contract, and round down. Price action decides where the stop goes; your risk limit decides how many contracts you can carry to it.
Related lesson: Position sizing
Technical vs Fundamental Analysis
Technical and fundamental analysis answer different questions. Fundamental analysis asks what an asset is worth. Technical analysis asks what traders are doing with it right now and where the trade idea fails.
| Comparison point | Technical analysis | Fundamental analysis |
|---|---|---|
| Main question | What is price doing, and where is the idea wrong | What is the asset worth |
| Main data | Price, volume, time, order flow | Earnings, balance sheets, economic data, interest rates |
| Typical horizon | Minutes to months | Months to years |
| Typical users | Day traders, swing traders, trend followers | Long-term investors, analysts, macro traders |
| Typical failure | Reading patterns into noise, lag, overfitting | Being right on value while the market stays wrong for a long time |
| Output | Levels, conditions, entries and stops | Fair value estimates and long-term theses |
They are not rivals. A common split is fundamentals for deciding what to own or which direction to favor, and technicals for deciding when and where to act. A futures day trader still watches the economic calendar, because a scheduled data release can overwhelm any chart pattern in seconds.
Related lesson: Trading vs investing
Strengths of Technical Analysis
Technical analysis has real strengths, and most of them are practical rather than predictive.
- It works on any liquid market with a price history. The same reading of support, trend and volatility applies to an index future, a currency or a stock.
- It defines risk. A chart gives you a specific price where the trade idea is wrong. Fundamental analysis rarely tells you where to put a stop.
- It fits any timeframe. A position trader and a scalper can use the same concepts on different charts.
- It forces written conditions. A good technical rule can be stated precisely, recorded and reviewed, which makes your own results testable.
- It shows crowd behavior quickly. Price reacts to news before most reports are written. The chart shows how the market took the information, not just what the information was.
The strength that matters most for a beginner is the second one. Knowing where you are wrong before you enter is the base of every risk plan, and charts are the most direct way to find that price.
Limitations of Technical Analysis
The evidence on technical analysis is mixed, and an honest guide has to say so.
One widely cited study, by Brock, Lakonishok and LeBaron in 1992, tested simple moving average and trading range break rules on the Dow Jones Index from 1897 to 1986 and found strong support for the strategies. A later review by Park and Irwin in 2007 counted 95 modern studies: 56 found positive results, 20 negative and 19 mixed. The same review found technical strategies generated profits in many markets at least until the early 1990s, and warned that most studies suffer from data snooping, choosing rules after the fact, and difficulty estimating risk and transaction costs.
In plain terms, some rules worked in some markets for some periods, results weakened later, and many published tests were less clean than they looked.
Common Technical Analysis Mistakes
| Failure | What it looks like | What it costs | The fix |
|---|---|---|---|
| Treating a description as a prediction | Buying because a level held before | A position held on belief | Write each read as if-then with an exit price |
| Counting one input many times | An average, MACD and stochastic all agree | False confidence | Combine different tool families instead |
| Borrowed settings | A 20-period average copied from another market | A tool that behaves nothing like the example | State the market and timeframe for every setting |
| No invalidation | A support line with no stop below it | An open-ended loss | Put a price on the invalidation before entry |
| Hindsight patterns | Shapes that are obvious only after the move | Trades that never matched a rule | Define patterns precisely before the session |
| Judging on a handful of trades | Confidence after three wins | Keeping or dropping a method for the wrong reason | Set the sample size in advance |
| Ignoring scheduled news | A clean setup into a data release | A gap through the stop | Check the economic calendar before trading |
Why Small Samples Mislead
Short winning runs say very little. Suppose a read is right 60% of the time. The chance it goes five for five is about 7.8%, and the chance of exactly four wins in five is about 25.9%. Now flip it: a method with no edge at all, a pure 50% coin flip, wins 12 or more of 20 trades about 25% of the time.
That means a beginner who goes 12 for 20 has learned almost nothing about whether the method works. Decide your sample size before you start, record every instance including the ones you skipped, and judge the method on the full record.
Related lesson: Common beginner trading mistakes
Technical Analysis in Futures, Stocks, Forex and Crypto
Technical analysis travels across markets, but the data underneath the chart does not behave the same everywhere. Knowing what changes keeps you from applying a tool where its input is weak.
| Market | Session shape | Volume data | What to adjust |
|---|---|---|---|
| Futures | Nearly 24-hour electronic sessions, with a daily maintenance break on CME Globex | Exchange-reported volume for each contract | Account for contract rolls and thin overnight hours |
| Stocks | Main exchange session plus pre-market and after-hours | Consolidated volume across venues | Expect overnight gaps between sessions |
| Spot forex | Around-the-clock trading on weekdays across many dealers | No single central exchange, so many charts show tick counts rather than true volume | Treat volume readings with care |
| Crypto | Continuous trading, weekends included | Volume split across many separate venues | Expect different prints and wicks on each venue |
Futures suit volume-based tools well because each contract trades on one exchange, so the volume you see is the contract's full volume. E-mini S&P 500 futures trade on CME Globex from 6:00 PM to 5:00 PM ET. US stocks have a main session on the NYSE from 9:30 AM to 4:00 PM ET, so a stock chart has a gap every night where a futures chart keeps printing.
Timing also changes the read. The first half hour after the 9:30 AM stock open is often the most active and erratic stretch of the day, because overnight orders and news are being absorbed. That is why some stock traders follow an informal "10 AM rule": wait until 10:00 AM ET, after the opening rush, before acting on a setup. It is a habit, not a market rule, and its value depends on the instrument and your own data.
How to Learn Technical Analysis in 30 Sessions
The fastest way to get lost in technical analysis is to learn a new tool every week. A narrower plan teaches you more.
Write an Edge Statement Before Adding Tools
Before learning a second indicator, write one page that answers these questions:
- Which market, contract and one or two timeframes will you study?
- What exact condition do you trade, written so precisely that a stranger could mark it on a chart?
- What market behavior are you trying to capture: trends continuing, ranges holding, a level being defended, or a quiet market expanding?
- What price proves the read wrong, and where do you get out?
- How many recorded instances will you collect before judging it?
Writing this first decides which tools you need. A trader studying trend continuation in an index future needs swing structure, a moving average and volatility context, and can ignore most oscillators.
The 30-Session Practice Plan
- Sessions 1 to 3. One market, one timeframe. Mark each session's open, high, low and close.
- Sessions 4 to 6. Add swing highs and lows, then support and resistance zones. Note what price did at each.
- Sessions 7 to 10. Add one indicator. Compute a 5-period average by hand at least once so the lag becomes real.
- Sessions 11 to 15. Write your edge statement, and put a stop price on every read.
- Sessions 16 to 20. Practice the read in a simulator or replay tool, and record every instance, including ones you would have skipped.
- Sessions 21 to 25. Tally results by condition, not just by profit. A trade can win and still have been a bad read.
- Sessions 26 to 30. Review the sample and write down whether you keep, change or drop the method, with the numbers behind the decision.
Judging the 30-Session Technical Analysis Results
Thirty sessions is still a small sample for any technical analysis method. It is enough to catch a method with no defined condition, and not enough to prove one works. If the numbers are unclear at session 30, that is an answer too: keep collecting before you add size or a second tool.
On our accounts, you can chart and trade on supported platforms including Tradovate, NinjaTrader, TradingView through the Tradovate connection, Tradesea, Quantower, Sierra Chart, R Trader Pro and WealthCharts. WealthCharts includes Chart Replay for practicing reads on historical data. All positions must be closed by 4:45 PM ET, so any technical read you take with us has to play out within a single session, and evaluation and funded accounts are simulated.
Related lesson: How to keep a trading journal
Technical Analysis FAQ
What is technical analysis in simple terms?
Technical analysis means reading a market's trading record, mainly price and volume, to describe its current condition and where a trade idea would be wrong. It studies what traders did rather than what an asset is worth. It describes odds; it does not predict prices.
What are the limitations of technical analysis?
It cannot predict, indicators lag price, and pattern spotting is subjective. Research on its profitability is mixed, and many studies suffer from data snooping. Scheduled news can also jump price straight through any level.
What is the 10 am rule in stocks?
It is an informal habit of waiting until 10:00 AM ET before acting on a stock setup. The NYSE opens at 9:30 AM ET, and the first half hour is often erratic while overnight orders clear. It is not an exchange rule, so test it on your own data.
What is the RSI indicator?
The Relative Strength Index is a momentum oscillator created by J. Welles Wilder that ranges from 0 to 100. It compares average gains with average losses, usually over 14 periods. Readings above 70 are called overbought and below 30 oversold, but strong trends can stay there for a long time.
What is the Dow Theory?
Dow Theory is the framework built from Charles Dow's Wall Street Journal editorials and later refined by William Hamilton and Robert Rhea. It says the market has primary, secondary and daily movements, and that a primary trend holds until proved otherwise. It also asks the major averages to confirm each other.
Does technical analysis actually work?
The evidence is mixed. Some studies found simple rules profitable in some markets and periods, but a 2007 review by Park and Irwin found them profitable in many markets at least until the early 1990s and flagged weak testing methods. Your own recorded sample is the only test that applies to your method.
How many indicators should a beginner use?
Start with one, and add another only for a written reason. Indicators built from the same closing prices repeat one input. Combining a structural tool, a context tool and one indicator gives better evidence than three oscillators.
What is the difference between technical analysis and price action trading?
Price action is one branch of technical analysis that reads bars, swings and levels directly, with few or no indicators. Technical analysis is wider, adding indicators, volume tools and pattern work on top of that base.
This article is educational and is not financial advice or a recommendation to buy or sell any instrument. Futures and other leveraged products can lose money quickly, and losses can exceed what you expected. Examples use illustrative prices, and chart patterns, indicators and past results do not predict future outcomes. Evaluation and funded prop accounts are simulated and follow their own rules, so check the current rules of any market, platform or program before you trade.


