




TL;DR: How to read a futures quote comes down to three things, read in order: the symbol, the tick and the settlement price. Every number on the line means something only after you convert it with the contract unit and the tick value. On the E-mini S&P 500 one 0.25-point tick is $12.50, so a 123.75-point change is $6,187.50 a contract. The settle, not the last trade, drives margin and the daily profit or loss on an open position.
A futures quote looks like a stock quote, and that resemblance causes most of the mistakes. A screen shows ES up 120 points, you were long, and your account is still red on the day. Nothing was wrong with the quote. It was read with stock-market assumptions. A stock price is the price of one share. A futures quote is the price of one standardized contract for one delivery month, quoted in units that change from market to market: index points, dollars per barrel, dollars per troy ounce, or cents per bushel.
This guide reads real quotes from CME Group's final settlement report for the trading day of November 4, 2026, field by field, and converts each field into ticks and dollars. By the end you should be able to look at any quote line and say what contract it is, what one tick is worth, what the day's move cost a single contract, and which number your broker will use to mark your account.
What a Futures Quote Shows
A futures contract is an exchange-written agreement. CME Group's introduction to futures makes the key point plainly: the specifications are identical for every participant, so the only contract variable left to the market is price. Quantity, quality, delivery month and the last trading day are fixed before anyone trades.
That is why a futures quote can be so short. It does not need to describe the asset. It only needs to name the contract and report what happened to its price during one trading day.
The CFTC's guide to futures price tables calls price the key statistic a futures market produces, with volume and open interest as the other two numbers worth reading. A quote line therefore answers three questions about one contract month:
- Where did it trade? Open, high, low and last.
- Where did the exchange officially value it? The settlement price, and the change from the prior settlement.
- How much business was there? Volume for the day and open interest outstanding.
Every futures market lists several delivery months at once, and each month has its own quote line. When people say "ES is up 120 points", they almost always mean the most active month. The other months are separate contracts with separate prices, which matters once you look at the whole ladder of months.
Related lesson: How futures contracts work from opening to expiry
Reading the Symbol on a Futures Quote

The symbol is the first field to read, because it tells you which contract the price belongs to. CME's lesson on contract trading codes describes the format as a one to three letter product code, then a letter for the expiration month, then the year.
The month letters are standard across US futures:
| Month | Code | Month | Code |
|---|---|---|---|
| January | F | July | N |
| February | G | August | Q |
| March | H | September | U |
| April | J | October | V |
| May | K | November | X |
| June | M | December | Z |
So ESZ6 is the E-mini S&P 500 (ES), December (Z), 2026 (6). CLF7 is crude oil for January 2027, and ZCH7 is corn for March 2027. CME's own example builds ESF9 for a January 2019 contract the same way.
Two details trip people up when they read a futures symbol.
First, platforms print the year differently. CME notes that contract codes can vary across platforms. Some show one year digit (ESZ6), others show the full year (ESZ2026). Both point to the same contract.
Second, not every market lists every month. The CME specifications read today show very different calendars:
- E-mini S&P 500: quarterly months only (March, June, September, December), listed 21 quarters out.
- Crude oil: every month, for the current year and the next 10 calendar years plus 2 more months.
- Gold: 26 consecutive months, plus any June and December in the nearest 72 months.
- Corn: March, May, July, September and December only.
If you type ESX6 expecting a November S&P contract, you will not find one. The month letter has to match a month that market actually lists.
Related lesson: The full root and month code list
How to Read a Futures Quote Line Field by Field
Here is a real line: the E-mini S&P 500 December 2026 contract from CME's final settlement report for trade date November 4, 2026.
| Field | ESZ6 on November 4, 2026 | What it tells you |
|---|---|---|
| Open | 7610.25 | First trade of the trading day |
| High | 7746.25 | Highest traded price of the day |
| Low | 7490.00 | Lowest traded price of the day |
| Last | 7734.50 | Last price traded |
| Change | +123.75 | Today's settle minus yesterday's settle |
| Settle | 7720.50 | Official end-of-day price set by the exchange |
| Volume | 2,329,405 | Contracts traded during the trading day |
| Open interest | 1,958,622 | Contracts still open, from the previous trading day |
Read it in this order.
Open, high and low on a futures quote
The open, high and low describe trades. CME's settlement page defines the high as the highest price the contract traded during the trading day, and the low as the lowest. On November 4 the December contract traded between 7490.00 and 7746.25, a range of 256.25 index points.
Watch for a letter after a price. On the same report, the March 2027 contract shows a high of 7821.25B. CME's definitions say a "B" after a high means a bid that was higher than the highest traded price, and an "A" after a low means an ask that was lower than the lowest trade. In other words, that number was quoted, not traded. Thin back months show these letters often.
Last, settle and change
The last and the settle are different numbers, and the difference is not trivial. On November 4 the December contract's last was 7734.50 and its settle was 7720.50, a gap of 14.00 points. On one E-mini contract that is 56 ticks, or $700.
The CFTC explains why both exist. The closing minutes are often the busiest of the day, so the exchange computes a settlement price from the range of closing prices, and the clearing house uses that settlement to value every open position. For the E-mini S&P 500, CME's mark-to-market course describes the daily settlement as a volume-weighted average of lead-month trades between 3:14:30 PM and 3:15 PM Central time.
The change is measured settle to settle. CME defines it as the trade date settlement minus the previous day's settlement, and the arithmetic checks out: the November 3 settle was 7596.75, and 7720.50 minus 7596.75 is 123.75. Your own profit is measured from your entry, so a trade can lose money on a day the quote shows a green change.
Volume and open interest
Volume counts contracts traded during the trading day. Open interest counts contracts still open, with one side of each trade counted.
One quirk is worth knowing before you compare the two. CME states that its settlement page always displays the previous trading day's open interest, so a Wednesday report carries Tuesday's figure. The 1,958,622 on the November 4 line is a one-day-old number. Volume is the current day's activity, and open interest is yesterday's inventory.
Volume also tells you which month is the one people trade. The December contract printed 2,329,405 contracts of the 2,336,291 traded across all ES months that day, or 99.7%. The March contract, one quarter further out, traded 6,882.
Futures Contract Specs to Check First
The quote line gives you prices. The contract specification tells you what those prices are worth. Exchanges publish a specification page for every product, and a handful of fields decide how you read the quote.
| Spec field | E-mini S&P 500 (ES) | Crude oil (CL) | Gold (GC) | Corn (ZC) |
|---|---|---|---|---|
| Asset class | Equity index | Energy | Metal | Grain |
| Contract unit | $50 x S&P 500 Index | 1,000 barrels | 100 troy ounces | 5,000 bushels |
| Price quotation | Dollars per index point | Dollars and cents per barrel | Dollars and cents per troy ounce | Cents per bushel |
| Minimum tick | 0.25 index points = $12.50 | $0.01 per barrel = $10.00 | $0.10 per troy ounce = $10.00 | 1/4 cent per bushel = $12.50 |
| Settlement method | Financially settled | Deliverable | Deliverable | Deliverable |
| Last trading day | 9:30 AM ET, 3rd Friday of the month | 3 business days before the 25th of the prior month | Third last business day of the month | Business day before the 15th of the month |
How each spec field changes the quote
Each row of a specification changes how you read a quote.
- Contract unit is the multiplier. It turns a price into a contract value.
- Price quotation tells you what unit the number on the screen is in. Corn at 444 is not $444. It is 444 cents, or $4.44 per bushel.
- Minimum tick sets which prices can print and what the smallest move is worth.
- Settlement method tells you what happens at expiry. The E-mini settles in cash. Crude, gold and corn are deliverable, so a speculator who has no use for 1,000 barrels needs to be out of that month before delivery starts.
- Last trading day tells you when a quote for that month stops existing.
Futures quote units by asset class
Futures cover several broad asset classes, and each tends to quote in its own unit. Reading the unit is what stops you from comparing a corn quote with a gold quote as if the numbers meant the same thing.
- Equity index futures (ES, NQ) quote index points, with a dollar multiplier per point: $50 on ES and $20 on NQ.
- Energy (CL) quotes dollars and cents per barrel.
- Metals (GC) quote dollars and cents per troy ounce.
- Grains (ZC) quote cents per bushel, written in eighths of a cent.
- Currencies (6E) quote US dollars per euro on a 125,000 euro contract, with a tick of 0.00005 worth $6.25.
Interest-rate futures have their own price conventions again, so read the specification before assuming a number is a yield or a dollar price. The CFTC also notes that some publications quote grains in dollars per bushel rather than cents, so check the header of any price table before you trust a number.
Related lesson: The specification page field by field
Tick Size and Valid Prices on a Quote
The tick, or minimum price fluctuation, is the smallest step a futures price can take. On the E-mini S&P 500 it is 0.25 index points, so every traded price ends in .00, .25, .50 or .75. On crude oil it is one cent per barrel. On gold it is ten cents per ounce. On corn it is a quarter of a cent per bushel.
The tick tells you two practical things. A stop or target has to sit on a valid price, so a stop 20.1 points away on ES cannot exist; the order rests at the nearest tick. And every distance on the screen converts cleanly into a whole number of ticks, which is how you price it.
Grain quotes in eighths of a cent
Corn quotes look odd the first time you see them. CME's November 4 report shows the December corn settle as 444'2 and the change as +1'6.
The digit after the apostrophe is eighths of a cent. Broker education material describes grain quotes as unreduced eighths, so '2 is 2/8 (a quarter cent), '4 is a half cent and '6 is three quarters. The CME numbers confirm it: the November 3 settle was 442'4, or 442.50 cents, and 442.50 plus 1.75 cents gives 444.25 cents, which is 444'2. Because the tick is a quarter cent, the only digits that can follow the apostrophe on a corn quote are 0, 2, 4 and 6.
When a quote price falls off the tick grid
Because every trade sits on the tick grid, a price that does not is a clue that you are not reading a traded price.
The test is easy to run. Take ten years of ES daily bars from a free continuous front-month series (Yahoo Finance's ES=F, November 2, 2016 to November 4, 2026, 2,517 completed sessions) and check every high, low and close against the 0.25 grid. Twenty-nine sessions fail. All 29 are contract expiration days between March 2019 and September 2026: 28 fell on the third Friday of March, June, September or December, and the other on Thursday, June 18, 2026, because the NYSE was closed for Juneteenth on Friday, June 19. Not one is an ordinary trading day. The September 18, 2026 close, for example, prints as 7,657.35.
The rulebook explains the pattern. CME Rule 35803.A sets the E-mini S&P 500's final settlement price as a special opening quotation of the index on the third Friday of the delivery month (or the preceding business day if the index is not published that Friday). CME's settlement file layout says a special final settlement price may not follow the normal tick rules. The free series stitched that value in as the close.
The lesson for reading a quote: a price that is not a multiple of the tick is a settlement value, an index value or an adjusted chart value. It is not a price you could have traded. Check the contract month and the source before you base a stop on it.
Related lesson: Why a chart series and a contract are not the same thing
Tick Value and Notional Value in Dollars
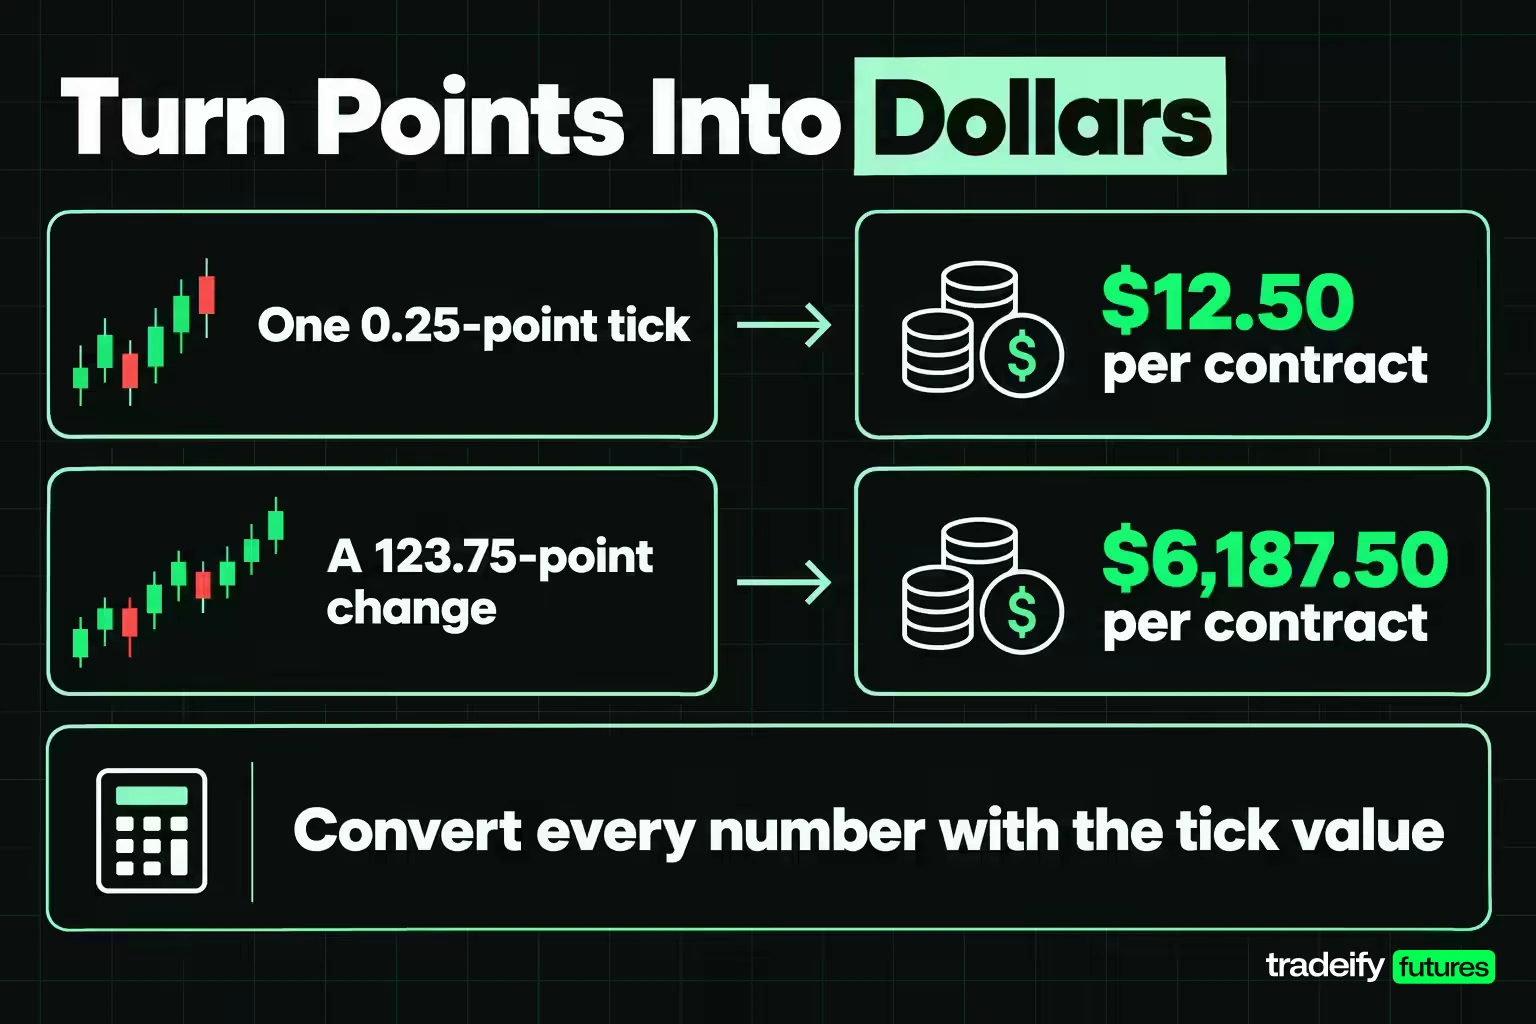
Two multiplications turn a quote into money:
- Tick value = tick size x contract unit. For ES, 0.25 x $50 = $12.50.
- Notional value = price x contract unit. For ES at the 7720.50 settle, 7,720.50 x $50 = $386,025.
Here are the November 4 settlements converted the same way:
| Contract | Settle on November 4, 2026 | Tick value | Notional value | Change in ticks | Change per contract |
|---|---|---|---|---|---|
| E-mini S&P 500 (ESZ6) | 7720.50 | $12.50 | $386,025 | +495 | +$6,187.50 |
| Micro E-mini S&P 500 (MESZ6) | 7720.50 | $1.25 | $38,602.50 | +495 | +$618.75 |
| Crude oil (CLZ6) | 88.12 | $10.00 | $88,120 | -797 | -$7,970 |
| Gold (GCZ6) | 4073.0 | $10.00 | $407,300 | +1,326 | +$13,260 |
| Corn (ZCZ6) | 444'2 | $12.50 | $22,212.50 | +7 | +$87.50 |
Three things stand out.
The ES and MES rows carry the same price and the same change in points, yet the dollar change is ten times larger on ES. Nothing on the quote line tells you that. Only the contract unit does.
Crude fell 7.97 a barrel, which reads like a small number, and it was a $7,970 loss on one long contract. The quote is in dollars per barrel and the contract is 1,000 barrels.
Corn's change of +1'6 looks tiny next to gold's +132.6, and in dollars it was: $87.50 versus $13,260 per contract. Comparing raw changes across markets tells you almost nothing until you convert them.
A useful shortcut for corn: one full cent is $50 per contract, because 0.01 x 5,000 bushels is $50.
Related lesson: Turning points and ticks into account currency
How Far ES Futures Move in One Session
A quote line looks calm on the page. The distance between its high and its low often is not, and reading that distance correctly changes how you size a position.
Here is each session's high minus low in ticks on the same ten-year ES=F series (2,517 sessions, November 2016 to November 2026, nearest-rank percentiles):
| Period | Quiet session (10th percentile) | Typical session (median) | Busy session (90th percentile) | Median range on one ES | Median range on one MES |
|---|---|---|---|---|---|
| Full decade | 65 ticks | 196 ticks | 449 ticks | $2,450 | $245 |
| 2017 | 33 ticks | 58 ticks | 99 ticks | $725 | $72.50 |
| 2026 to November 4 | 207 ticks | 323 ticks | 571 ticks | $4,037.50 | $403.75 |
The typical 2026 session covered 323 ticks, about 5.6 times the 2017 median of 58. Part of that is the index level roughly tripling (the median close went from 2,434.50 to 7,446.25), and part is a more volatile year. Either way, a stop that felt normal in 2017 sits inside ordinary noise today, and a trader who carried the old habit forward would be stopped out by routine movement.
November 4 itself covered 256.25 points, or 1,025 ticks, wider than 99.6% of the decade's sessions and 99.1% of 2026's. On a single ES contract, high to low was $12,812.50. The day before, November 3, covered 311 ticks, an ordinary 2026 session.
So when you read the high and low on a quote, read them as a measure of how much room the market needed that day. If your stop is 20 ticks and the median day is over 300, the quote is telling you that stop sits well inside ordinary noise.
Related lesson: How the daily session and maintenance window frame this range
Margin and the Settlement Price Behind a Quote
The notional value on a quote is not the cash you put up. Futures use margin, and CME's margin course is careful about the word: futures margin is the money you deposit and keep with your broker while a position is open. It is not a down payment, and you do not own the underlying.
CME describes futures margin as typically 3-12% of a contract's notional value, against up to 50% for stocks bought on margin. Applied to the November 4 ES settle, that band runs from $11,580.75 (3% of $386,025) to $46,323 (12%). That is a percentage illustration, not a margin quote. Actual requirements are set by CME Clearing per contract, change with volatility, and your broker may require more.
Two margin levels matter:
- Initial margin is what you need to open the position.
- Maintenance margin is the minimum you must keep. CME says that if the account drops below it, you may get a margin call to bring it back to the initial level, or the position may be reduced or liquidated.
Settlement price and daily mark-to-market
This is where the settle earns its place on the quote. Every open futures position is marked to the settlement price each day, and CME's mark-to-market course describes the result simply: losers pay winners every day, using a settlement price that is the same for everyone.
Take one long ES contract held from the November 3 settle of 7596.75 to the November 4 settle of 7720.50. The account is credited 123.75 points x $50, or $6,187.50, that evening, whether or not the position is closed. A short position is debited the same amount. If the next settle is lower, the cash moves back the other way.
That is why the quote's change column is settle to settle. It is the number that moved cash between accounts overnight.
Contango and Backwardation Across Contract Months

Each delivery month has its own quote, and lining them up shows the futures curve. The CFTC glossary defines contango as later months priced progressively higher than the nearest month, and backwardation as the reverse.
The settlements as of November 4, 2026 show both:
| Market | Nearest month settle | Next month settle | Further out | Curve shape |
|---|---|---|---|---|
| E-mini S&P 500 | Dec 2026 7720.50 | Mar 2027 7795.25 | Sep 2027 7954.75 | Contango |
| Crude oil | Dec 2026 88.12 | Jan 2027 87.10 | Mar 2027 84.27 | Backwardation |
| Corn | Dec 2026 444'2 | Mar 2027 458'2 | Jul 2027 473'4 | Contango |
Reading the curve changes how you read any single quote.
The March ES contract settled 74.75 points above December. That is not a forecast that the S&P 500 will rise 74.75 points by March. The CFTC glossary describes a carrying charge market, where each later maturity is priced higher to cover the cost of carrying the asset, including interest. For a stock index, CME's lesson on equity index basis explains the gap as financing cost set against the dividends a futures holder does not receive. When financing costs more than the dividends pay, later months price higher.
On the same day, November 4, 2026, crude did the opposite: December at 88.12, March at 84.27, a $3.85 discount. The quote alone does not tell you why. It tells you the market was paying more for barrels delivered sooner than for barrels delivered later, and a trader comparing months has to account for that gap.
Spot price and basis on a futures quote
The futures price is also not the spot price, and the gap between them is called basis. CME quotes equity index basis as the futures price minus the spot index, while the CFTC glossary writes the general definition the other way round (cash minus futures), so check the sign convention of any basis figure you read. On November 4 the S&P 500 index closed at 7,688.62 and December ES settled at 7,720.50, so the futures sat 31.88 points above spot. Part of that gap is carry and part is timing: the NYSE closing auction is at 4:00 PM ET, and the ES settlement window ends at 4:15 PM ET. CME notes that the basis shrinks as expiration nears and disappears when futures and spot settle to the same figure.
The practical point for quote reading: if you compare a futures quote to the cash index, a stock ETF or a different contract month, expect a gap. Comparing two months, or futures to spot, is comparing two different prices.
What a Futures Quote Leaves Out
A quote line summarizes trades that already happened. Before you send an order, four things it does not show matter as much as the fields it does.
- Bid and ask. The last is where the market last matched. What you pay to get in is the ask, and what you receive to get out is the bid. A one-tick spread on ES is $12.50 per contract each way through it.
- Depth. A high tells you a trade happened there. It does not tell you how many contracts are available at the price you want now.
- Timing. CME's own public quote pages state that prices are delayed at least 10 minutes. On a contract that trades nearly around the clock, a delayed quote without a timestamp can be badly out of date.
- Whether it is a real contract. On CME's delayed pages, a small "a" or "b" after a price means it was an ask or a bid, not a trade. A continuous chart series that splices months together is a study tool, not a contract you can trade.
The temptation is to chase the number on the screen, especially after a fast move. If any of these four is missing, treat the quote as context, not as a price you can act on.
Related lesson: Bid and ask explained
Turning a Futures Quote Into a Trade Plan
Reading a quote only matters if it changes a decision, and the decision it changes most often is size. Here is how the fields feed the three most common uses.
Outright long or short from a quote
An outright long profits if the contract settles or exits above your entry, and a short profits below it. The quote gives you three inputs before entry: the contract (symbol), the dollar value of distance (tick value), and the normal size of a day (the high-low range).
Turn the plan into ticks first, then dollars. An illustrative 20-point stop on the S&P 500 contracts is 80 ticks, which is $100 on one MES and $1,000 on one ES. If the most you are prepared to lose on the trade is a few hundred dollars, the quote has already told you the full-size contract is the wrong tool at that stop.
Calendar spreads between quoted months
A calendar spread, in the CFTC glossary's terms, is buying one delivery month and selling another of the same commodity. A spread trader reads the gap between quote lines rather than either price. On November 4 the ES March-December gap was 74.75 points. CME lists ES calendar spreads with their own tick of 0.05 index points, worth $2.50, which is finer than the 0.25 outright tick.
Futures quote checklist before placing an order
- Write out the symbol in words: product, month, year.
- Note the contract unit and tick value next to the price.
- Convert your stop and target into whole ticks, then dollars.
- Compare the stop with a typical day's range in ticks.
- Check whether the quote is live or delayed, and look at the bid and ask, not just the last.
On our accounts, the Help Center asks traders to use the contract shown as the current Globex code on the CME calendar. Tradovate, Rithmic, WealthCharts and NinjaTrader show one year digit (ESZ6), while TradingView and Tradesea show the full year (ESZ2026). A TradingView symbol ending in "1!" such as ES1! is chart-only and cannot be traded, and an orange symbol name on Tradovate means the data is delayed. Our accounts use contract limits for sizing (a 50K account allows 4 minis or 40 micros, and 10 micros count as one mini), positions close by 4:45 PM ET, and funded accounts are simulated.
Futures Quote FAQ
How do you read futures prices?
Start with the symbol to identify the product and month. Then find the contract unit and tick so you know what one point and one tick are worth. Only then read the open, high, low, last and settle, and finish with volume and open interest.
How much is 1 point worth in futures?
One point is worth the contract's multiplier, so it is $50 on the E-mini S&P 500 and $5 on the Micro E-mini. One dollar per barrel is $1,000 on crude oil, one dollar per ounce is $100 on gold, and one cent per bushel is $50 on corn.
What is the difference between the last price and the settlement price?
The last is the final trade. The settle is calculated by the exchange from trading near the close and is used to value every open position. On November 4, 2026 the E-mini S&P 500 December contract's last was 7734.50 and its settle was 7720.50.
What does a B or A after a futures price mean?
On CME's settlement report, a "B" means a bid that was higher than the highest trade and an "A" means an ask that was lower than the lowest trade. On the last price, either letter means the final figure was a bid or an ask rather than a trade. These letters are common in thinly traded months.
Why does open interest look a day old?
CME's settlement page shows the previous trading day's open interest. A report for a Wednesday trade date carries Tuesday's open interest next to Wednesday's volume.
Futures are leveraged and losses can exceed what you expected when you entered; the quotes here are dated examples and an illustrative study, evaluation and funded accounts are simulated, and none of this is investment advice.


