




TL;DR: ICT trading concepts map where stops rest and where price left imbalances, but each one is a location, not a signal. On two years of ES and NQ daily bars, about 80% to 93% of fair value gaps were revisited within 10 sessions. Swept swing levels reversed no more often than any break of the prior day's high or low. Decide your stop and your break-even win rate before the entry, because that is where these setups win or lose.
You see a clean fair value gap, price pulls back into it, and every ICT video you have watched says this is the entry. The hard part is not spotting the pattern. It is knowing how often it works and where your stop has to sit for it to work at all.
ICT trading concepts promise a map of where large orders sit and where price is likely to go next. The vocabulary is dense, the charts look convincing in hindsight, and most explanations stop at the definition.
This guide does two things. It decodes every major ICT term in plain language, and it measures the claims behind the most popular ones on real E-mini S&P 500 (ES) and E-mini Nasdaq-100 (NQ) futures data, so you can see which ideas hold up and which ones need more than a label before you risk money on them.
What ICT Trading Concepts Are and Where They Come From
ICT stands for Inner Circle Trader, the name Michael J. Huddleston teaches under. ICT trading concepts are a discretionary price-action method built on one central claim: large participants need resting orders to fill size, so price is driven toward the places where those orders sit before it makes the move that matters.
Everything else in the ICT vocabulary is machinery for finding those places and timing an entry near them. The umbrella term is the PD array (premium and discount array), which ICT teachers use as the collective name for fair value gaps, order blocks, breakers, mitigation blocks and the optimal trade entry zone. A PD array is any price zone the method treats as a candidate entry.
PD arrays matter because they turn the vocabulary into a ranking job. On any chart there are several gaps, blocks and old highs at once, and the ICT approach is to pick the one that sits in the right half of the range (discount for longs, premium for shorts) and in the path of the expected move. A PD array that sits on the wrong side of equilibrium is not a long entry, however clean it looks.
ICT trading concepts in plain language
The working ICT vocabulary is smaller than it looks once the overlapping names are stripped away.
| ICT term | What it means in plain language | The claim behind it |
|---|---|---|
| Buy-side liquidity | Resting buy orders above prior highs, mostly short sellers' stops and breakout buy orders | Price is drawn up to that pool before it turns |
| Sell-side liquidity | Resting sell orders under prior lows, mostly long traders' stops | Price is drawn down to that pool before it turns |
| Swing high and swing low | A bar whose high or low is more extreme than the bars on either side | These points define structure and mark where stops cluster |
| Market structure shift | Price breaks the most recent opposing swing point | The side in control may have changed |
| Displacement | A fast, one-directional move of large-bodied candles with small wicks | Real buying or selling pressure arrived |
| Fair value gap (FVG) | A three-bar imbalance where bar one and bar three do not overlap | Price returns to the untraded band to rebalance it |
| Order block | The last opposing candle before a displacement move | Unfilled orders remain there and get worked on a retest |
| Breaker block | An order block that failed and was broken through | The failed zone now acts from the opposite side |
| Premium and discount | The upper and lower halves of a dealing range, split at 50% | Buy in discount, sell in premium |
| Optimal trade entry (OTE) | The 62% to 79% Fibonacci retracement of the latest impulse leg | The best risk-to-reward entry sits in that pullback |
| Kill zone | A named time window such as the London or New York open | Most of the day's useful movement happens inside it |
| Power of Three | Accumulation, manipulation and distribution within a session | A range, a false break, then the real move |
Here is the useful part, even if you never adopt the method. Every row in that table makes a claim you can count. A fair value gap claims price comes back. A sweep claims price reverses. A kill zone claims a time window carries the move. ICT is taught as a discretionary read, so two traders can disagree about the same chart, but once you write a mechanical definition, the claim becomes a number.
The ICT studies in this guide use explicit definitions, stated each time, on front-month continuous ES and NQ futures data from Yahoo Finance. Treat them as an illustrative study with stated rules, not as a verdict on every way the method can be traded.
Related lesson: Smart money concepts
ICT Market Structure, Swing Highs and Swing Lows
Market structure in ICT is the sequence of swing highs and swing lows. A swing high is a bar whose high sits above the highs of the bars around it; a swing low is the mirror. The ICT studies here use a common mechanical version: a swing high is a daily bar whose high is higher than the two bars before it and the two bars after it.
Those points do two jobs at once. They define trend, and they mark where stops are likely resting, which is why ICT treats them as both structure and liquidity.
The structure vocabulary reduces to four events:
- Bullish structure. Higher highs and higher lows. The method looks for longs in discount.
- Break of structure (BOS). Price breaks the prior swing in the direction of the existing trend, which continues the sequence.
- Change of character (CHoCH). The first break against the prevailing trend, an early sign the sequence may be ending.
- Market structure shift (MSS). A break of the most recent opposing swing, usually with displacement, which ICT treats as confirmation that the side in control changed.
The decision this creates is simple to state and hard to execute. Structure tells you which side you are allowed to trade; it does not give you an entry. A trader who reads a bullish ICT market structure correctly can still have no trade for hours, because price is in premium or there is no fresh displacement. Reading the direction and receiving a valid entry are two separate decisions.
What changes the read: a close beyond the opposing swing, not a wick through it. Wicks through swing points are exactly the sweeps the liquidity section of this guide measures, and they are common.
Related lesson: Market structure, highs, lows and trends
ICT Liquidity, Sweeps and Stop Runs
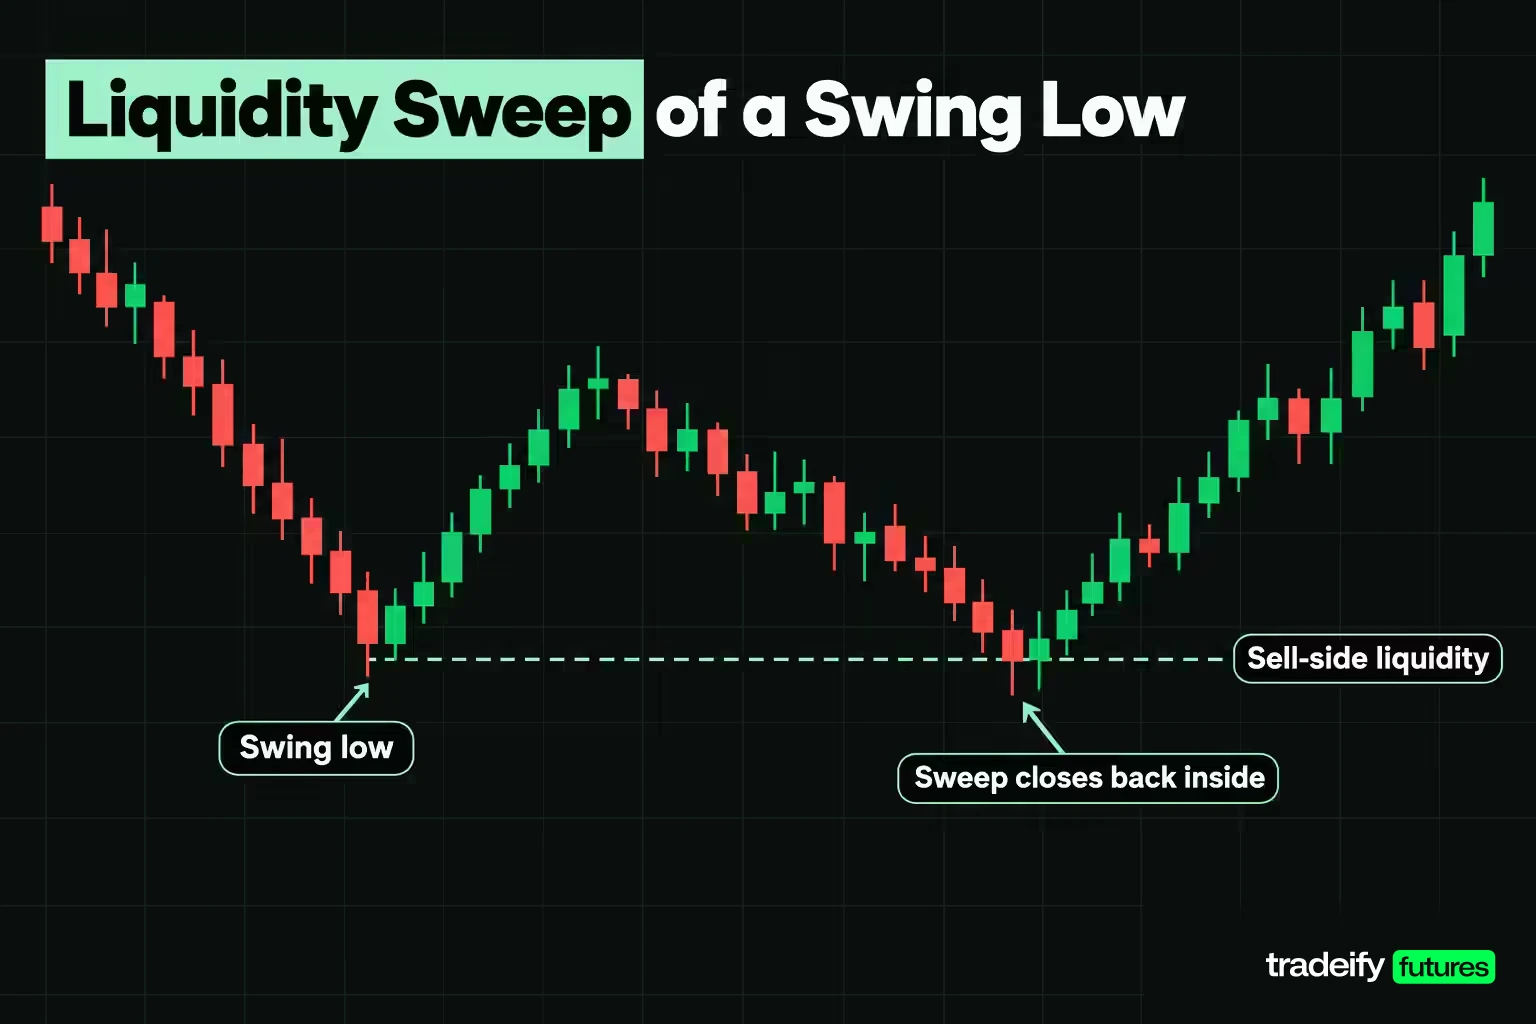
ICT liquidity means clusters of resting orders, not market depth or trading volume. Buy-side liquidity sits above swing highs, where short sellers keep protective stops and breakout traders keep buy stops. Sell-side liquidity sits under swing lows, where long traders keep stops.
A sweep (also called a stop run or liquidity grab) is price trading through one of those levels, triggering the orders, and then turning. The common ICT teaching is that a sweep marks the turn: the stops fill the large participant's order, and the real move goes the other way.
That is the most repeated claim in ICT content, so it is the one worth testing first.
What a two-year sweep test showed
This guide's own test used 502 completed daily sessions of ES and NQ futures from Yahoo Finance, from November 5, 2024 to November 3, 2026. A swing high was a daily bar whose high topped the two bars before and the two bars after it (a swing low is the mirror). A sweep was the first later session that traded beyond that swing level, and it "worked" if that session closed back inside the level.
The fair comparison is not "any session." It is every session that traded beyond the prior session's high or low, because breaking an obvious level and closing back inside it happens all the time. If swing-level sweeps carry an edge, they should close back inside more often than that baseline. The table shows this guide's measured results.
| Instrument and level swept | Sweeps found | Closed back inside the level | Any break of the prior session's extreme | Closed back inside, baseline |
|---|---|---|---|---|
| ES swing high | 61 | 40.98% (25 of 61) | 276 | 44.20% (122 of 276) |
| ES swing low | 53 | 49.06% (26 of 53) | 228 | 55.26% (126 of 228) |
| NQ swing high | 62 | 40.32% (25 of 62) | 280 | 43.21% (121 of 280) |
| NQ swing low | 53 | 58.49% (31 of 53) | 221 | 51.58% (114 of 221) |
In this guide's ES and NQ test, three of the four swept-level cells came in under the ordinary baseline, and the one that beat it (NQ swing lows, 58.49% against 51.58%) did so on 53 events, which is too small a sample to separate from noise.
Sweep follow-through after five sessions
A same-day close is a narrow definition of a sweep reversal, so this guide's daily ES and NQ test also checked whether price was further in the reversal direction five sessions later. The ES swing-low sweeps did best at 65.38% (34 of 52) against a 58.22% (131 of 225) baseline. ES swing highs came in at 41.67% (25 of 60) against 42.91% (118 of 275), NQ swing highs at 45.90% (28 of 61) against 45.52% (127 of 279), and NQ swing lows at 56.86% (29 of 51) against 57.14% (124 of 217).
The plain reading: on daily ES and NQ bars from November 2024 to November 2026, a sweep of a swing level was not a reversal signal on its own. It behaved much like any other break of an obvious level. That does not make liquidity useless. It makes it a map of where turbulence is likely and where your own stop should not sit, and it means the sweep needs the confirmation you already use (a market structure shift with displacement) before it becomes a trade.
What would change this conclusion: a different timeframe, a stricter sweep filter (for example, requiring a close back inside plus a lower-timeframe structure shift), or a larger sample. Test the version you actually trade.
Related lesson: Liquidity sweeps and stop runs
Displacement and the Fair Value Gap
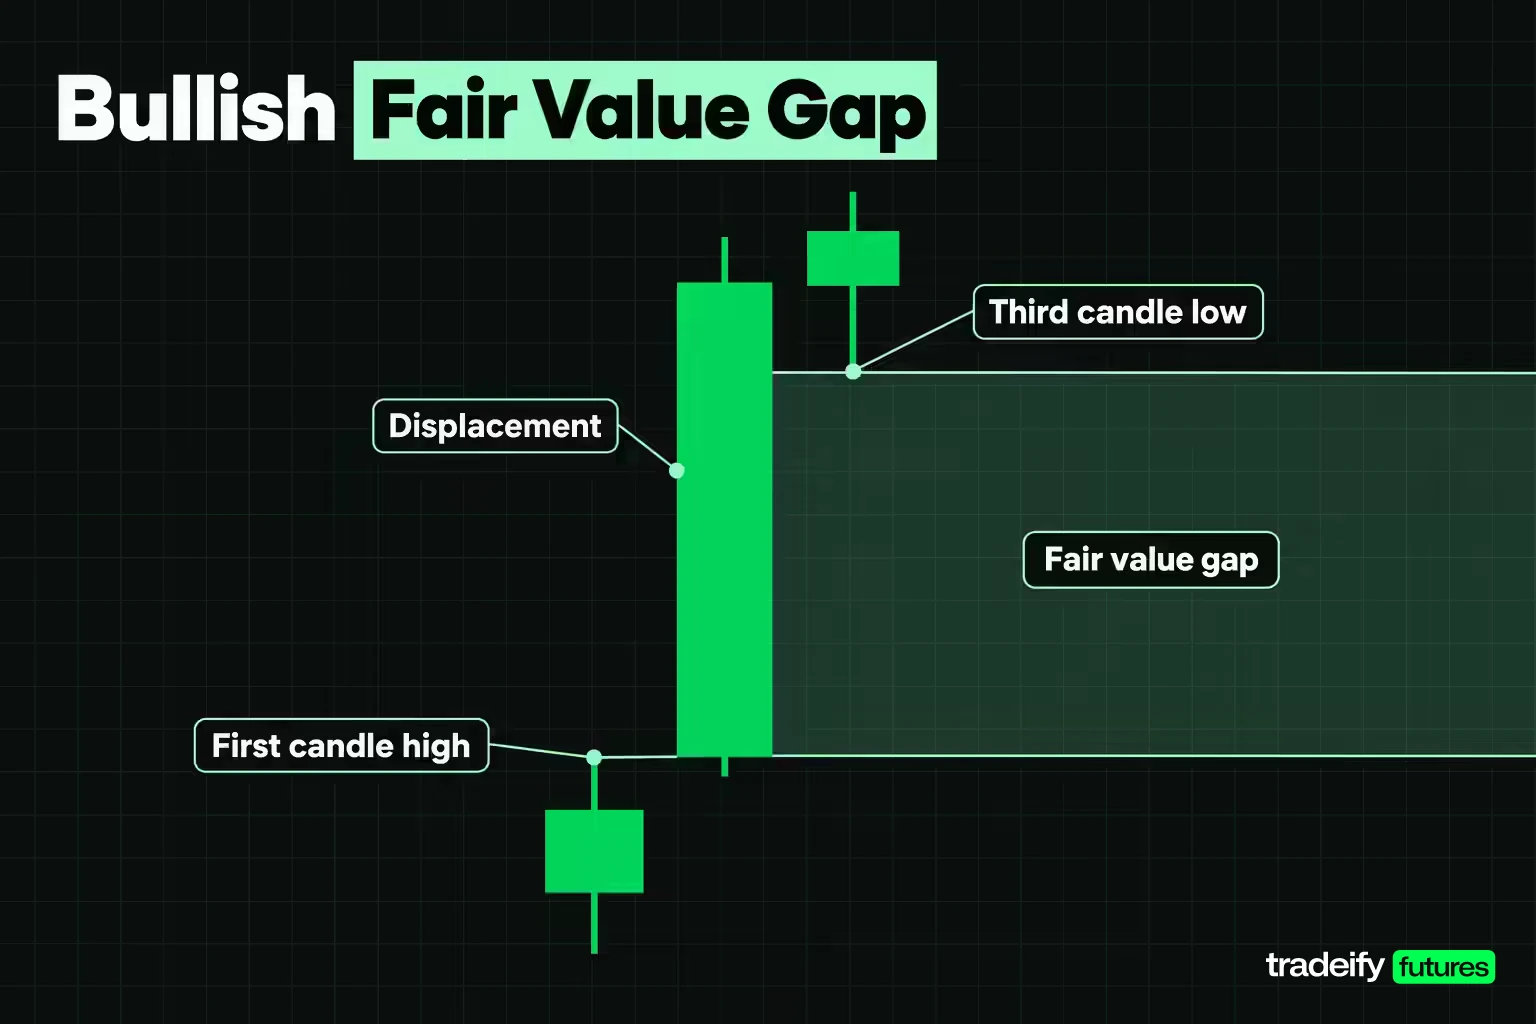
Displacement is the ICT name for a fast, one-sided move: consecutive candles with large bodies and small wicks, meaning little two-way trading happened inside the move. It is the closest thing ICT has to a mechanical trigger, and it does two jobs. It often breaks structure, and it leaves a fair value gap behind.
A fair value gap is a three-bar pattern. In a bullish gap, the low of bar three sits above the high of bar one, so the middle bar's range left a band that only traded one way. A bearish gap is the mirror: bar three's high sits under bar one's low. ICT calls the bullish version BISI (buy-side imbalance, sell-side inefficiency) and the bearish version SIBI.
The claim is that price returns to rebalance the band. The setup most traders take is a limit order inside the gap, often at its midpoint, with the trend that created it.
A related term is the balanced price range (BPR): the zone where a bullish fair value gap and a bearish fair value gap overlap. It usually forms after a sharp move one way leaves a gap, and an equally sharp move back leaves an opposing gap across some of the same prices. Only the overlapping band counts, so a BPR is always narrower than either gap.
ICT teaches the balanced price range as a tighter, higher-quality zone because two imbalances share the same prices. The practical benefit is a smaller zone, which means a tighter stop for the same idea. The cost is that a narrower band gets traded through more easily, so the BPR is a claim to test like any other, not a given.
How often fair value gaps get revisited
This guide's own test scanned 502 daily sessions of ES and NQ futures (Yahoo Finance data, November 5, 2024 to November 3, 2026) for three-bar gaps and followed each one for the next 10 sessions. "Revisited" means price traded back into the band. "Fully filled" means price traded all the way through it to the far edge.
| Instrument and gap direction | Gaps found | Revisited within 10 sessions | Fully filled within 10 sessions | Median gap width |
|---|---|---|---|---|
| ES bullish | 71 | 80.28% (57 of 71) | 59.15% (42 of 71) | 30.25 points |
| ES bearish | 41 | 92.68% (38 of 41) | 82.93% (34 of 41) | 22.50 points |
| NQ bullish | 83 | 79.52% (66 of 83) | 67.47% (56 of 83) | 106.00 points |
| NQ bearish | 44 | 88.64% (39 of 44) | 79.55% (35 of 44) | 130.12 points |
The fair value gap rebalance claim holds up in this guide's two-year ES and NQ sample. Roughly four out of five daily gaps saw price come back into the band, and the median wait to the first touch was one session in every row.
The difference between a revisited fair value gap and a fully filled one is the part that changes trade planning. In this guide's measurement, only 59.15% of ES bullish gaps traded all the way through. If your target is the far side of a gap, the full-fill rate, not the revisit rate, is the ceiling on how often that target gets reached.
Bearish gaps filled more completely than bullish ones on both contracts. ES closed the sample at 7,596.75 against 5,812.25 two years earlier, and NQ at 28,305.75 against 20,341.75, so this was a rising market where downside imbalances got reclaimed faster. That asymmetry is a property of this sample and this trend, not a permanent law.
Also note the size. A median ES daily gap of 30.25 points is $1,512.50 per contract at $50 per point. A gap that looks thin on a daily chart can be a very wide zone for an intraday entry.
Order Blocks and Breaker Blocks
An order block is the last opposing candle before a displacement move. A bullish order block is the last down-close candle before a strong move up; a bearish order block is the last up-close candle before a strong move down. The ICT reading is that the candle marks where large orders were placed, and that the unfilled remainder gets worked when price returns.
ICT traders often watch the order block's mean threshold, its 50% level, as the line that should hold if the block is valid. A close through the mean threshold is the usual warning that the read is wrong.
The decision points for an order block trade:
- Location. A bullish order block is only interesting in discount, after displacement has already broken structure upward.
- Freshness. A block that price has already returned to and traded through has done its job. Repeated retests usually weaken it.
- Invalidation. A close through the far side of the block ends the idea. If you cannot accept the loss to that point, the trade is too large.
A breaker block is a failed order block. Price sweeps liquidity, trades through an order block in the wrong direction, then shifts structure the other way. The broken block now acts from the opposite side: a failed bullish block becomes resistance, and a failed bearish block becomes support. In ICT terms, it is a reversal entry that only exists after a sweep and a market structure shift.
The honest limit on both: order blocks are harder to define mechanically than fair value gaps, because "the last opposing candle" depends on which move you decide counts as displacement and on your timeframe. That is also why order block results vary so widely between traders. Write down which candle qualifies before the session, not after the move.
Related lesson: Order blocks in trading
Premium, Discount and Optimal Trade Entry
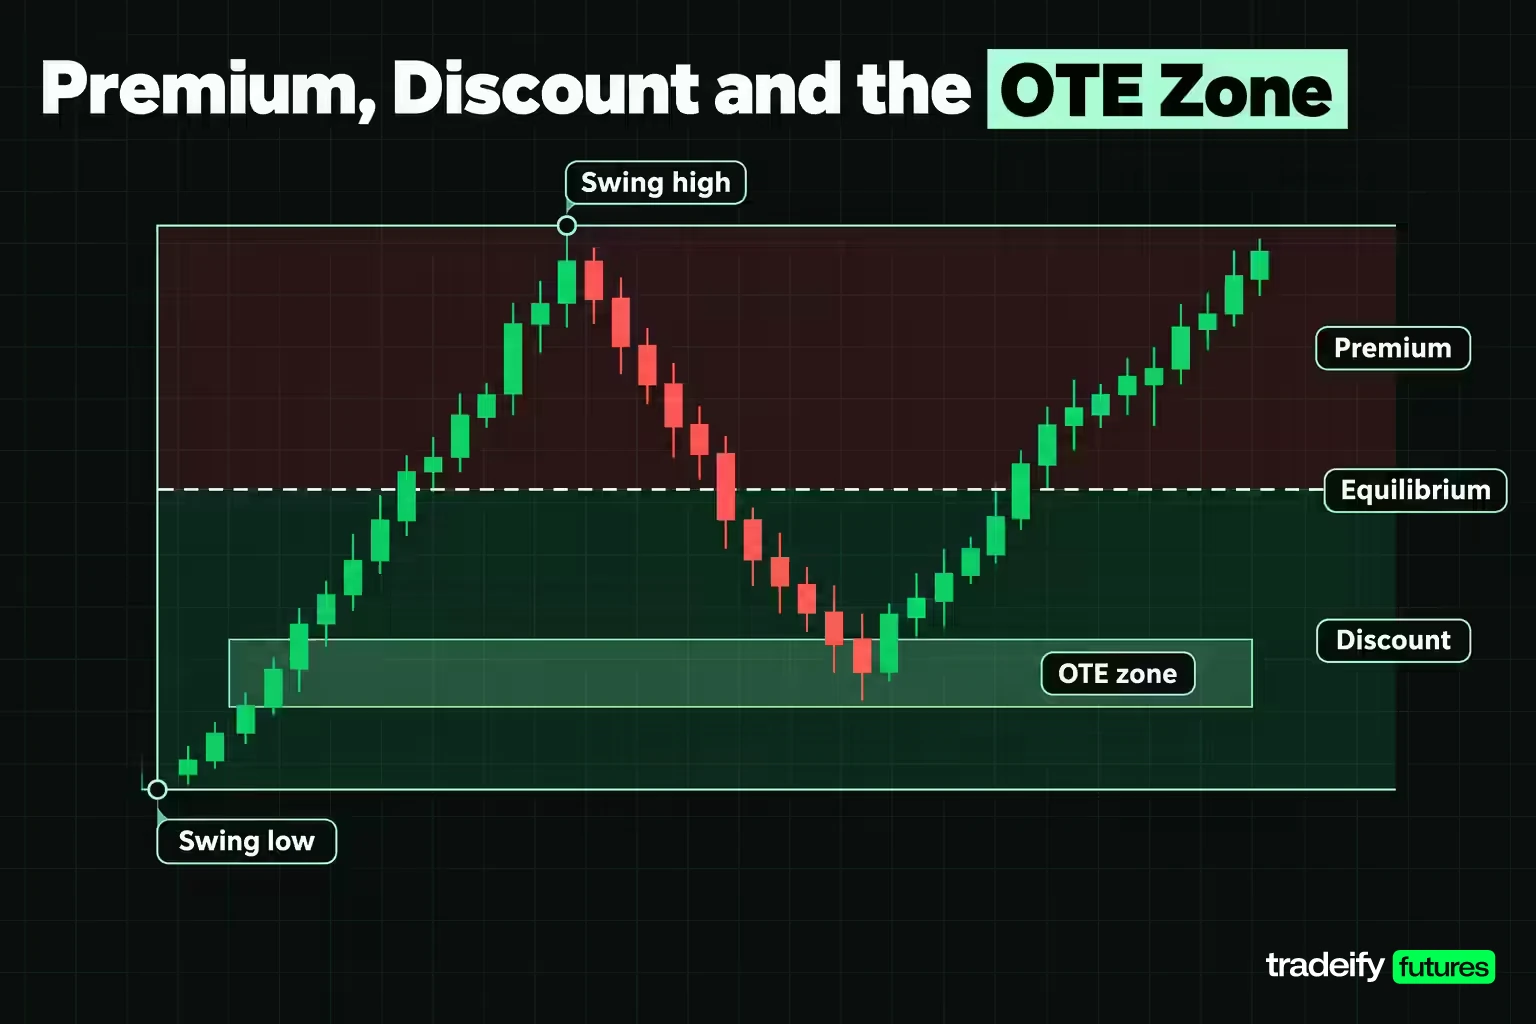
Premium and discount split a dealing range at its midpoint. Take the most recent swing low to swing high: the upper half is premium, the lower half is discount, and the 50% line is equilibrium. ICT looks for longs in discount and shorts in premium. In practice, this is a sizing and patience rule as much as a signal, because it stops you buying the top half of a range after the move already happened.
Optimal trade entry (OTE) narrows that further. Huddleston's Fibonacci settings mark 0.62 and 0.705 as OTE levels and 0.79 as the optimal trade entry, so the OTE zone is the 62% to 79% retracement of the latest impulse leg, with 70.5% as its center.
An illustrative example, with round prices: a bullish impulse runs from 5,000 to 5,100 on ES.
- Equilibrium (50%) sits at 5,050. Anything above it is premium.
- The OTE zone runs from 5,038 (62% retracement) down to 5,021 (79% retracement), with 70.5% at 5,029.50.
- A stop at the 5,000 swing low risks 29.50 points from an entry at 5,029.50, or $1,475 on one ES contract.
- A target back at the 5,100 high pays 70.50 points, so the break-even win rate is 29.50 divided by 100.00, or 29.50%.
That is why ICT likes the OTE: deep pullbacks give a better reward-to-risk ratio on paper. The tradeoff is fill rate. The deeper your limit order sits, the more often price turns before reaching it, and the missed trades never show up in a screenshot of the ones that worked. A missed entry does not make the next price a good entry; it makes it a different trade.
ICT Kill Zones Measured on 46 Sessions
Kill zones are ICT's named time windows. As published by innercircletrader.net in New York time, the four kill zones are the Asian kill zone (7:00 PM to 10:00 PM), London (2:00 AM to 5:00 AM), New York (7:00 AM to 9:00 AM) and London close (10:00 AM to 12:00 PM). The Silver Bullet model adds three one-hour windows: 3:00 AM to 4:00 AM, 10:00 AM to 11:00 AM and 2:00 PM to 3:00 PM.
The claim is that these windows carry the day's meaningful movement. To test it, the study took 46 complete ES and NQ futures sessions (August 28 to November 3, 2026) of five-minute bars, defined each session as 6:00 PM to 5:00 PM New York time, and compared each window's high-to-low range with the full session's range. It also counted how often the window contained the session's high or low.
| Window, New York time | ES median share of session range | NQ median share of session range | ES window held the day's high or low | NQ window held the day's high or low |
|---|---|---|---|---|
| Asian kill zone, 7:00 PM to 10:00 PM | 20.62% | 24.31% | 17.39% | 15.22% |
| London kill zone, 2:00 AM to 5:00 AM | 27.55% | 30.89% | 23.91% | 17.39% |
| London Silver Bullet, 3:00 AM to 4:00 AM | 15.16% | 15.64% | 4.35% | 2.17% |
| New York kill zone, 7:00 AM to 9:00 AM | 30.96% | 26.04% | 13.04% | 10.87% |
| Cash open hour, 9:30 AM to 10:30 AM | 40.56% | 43.15% | 15.22% | 19.57% |
| AM Silver Bullet, 10:00 AM to 11:00 AM | 32.85% | 33.19% | 23.91% | 15.22% |
| London close kill zone, 10:00 AM to 12:00 PM | 45.16% | 42.63% | 45.65% | 30.43% |
| PM Silver Bullet, 2:00 PM to 3:00 PM | 20.13% | 18.03% | 15.22% | 8.70% |
For scale, in the same 46-session measurement the median one-hour window across all 23 clock hours covered 15.19% of the session range on ES and 16.06% on NQ, and the quietest hour (midnight to 1:00 AM) only 7.46% and 9.97%.
What the kill zone measurements show for ES and NQ
In this guide's 46-session measurement of ES and NQ futures, the New York morning earns its reputation. The cash open hour and the 10:00 AM Silver Bullet each carried roughly a third or more of the whole session's range in a single hour, two to almost three times what a typical hour carried. The 10:00 AM to 12:00 PM window held the ES session's high or low on 45.65% of days.
The overnight kill zones measured weaker than the marketing suggests for index futures. The London Silver Bullet hour was almost exactly an average hour, and it held the day's extreme on 2 of 46 ES sessions and 1 of 46 NQ sessions. The New York kill zone (7:00 AM to 9:00 AM) carried less range per hour than the cash session that follows it.
Notice what the table does not say. A window carrying range tells you when movement is likely, not which direction it goes. Use kill zones as a filter on when to pay attention, not as a forecast. And 46 sessions is a short sample, so the exact percentages carry real sampling error; the ranking between windows is the more durable finding.
Related lesson: Global trading sessions
Power of Three and the Market Maker Model
The Power of Three, also called AMD, splits a trading day into three phases. Accumulation is a quiet range. Manipulation is a run in the wrong direction that takes out stops on one side of that range. Distribution is the real move of the day in the opposite direction. In a bullish day, that often looks like an open, a drop under the opening range, and then a rally that closes well above the open.
The market maker buy model (MMBM) and sell model (MMSM) stretch the same idea over a longer cycle. Price moves from a higher-timeframe PD array on one side to a PD array on the other, building a consolidation, engineering liquidity, then reversing and delivering to the opposite target. The model is a narrative template for where you are in a larger move.
Both are useful as checklists for the question "am I entering during the manipulation leg or after it?" Both are also easy to fit after the fact, because almost every day has a range, a push one way and a push the other. The test that matters is whether you can label the phase before it completes. If you can only name the manipulation leg once distribution is already obvious on the chart, the model is describing the past, not giving you an entry.
A practical way to use them: write down, before the session, which side of the opening range you expect to be run and what structure break would confirm the turn. Then compare those notes with what happened. After 30 to 50 sessions, your notes show whether your Power of Three read has any edge, which is more useful than any screenshot.
Stop Placement on an ICT Fair Value Gap Entry
Stop placement is where ICT concepts meet real money, and where most explanations go quiet. If you buy a bullish fair value gap, the two common stops are a little past the gap's far edge, or past the swing low that started the move. Those are very different bets.
To measure them, this guide's own study scanned the New York session (9:30 AM to 4:00 PM) on the same 46 sessions of five-minute ES and NQ bars for three-bar fair value gaps in both directions, with a minimum width of 2.00 points on ES and 5.00 points on NQ. An entry counted when price came back to the gap's midpoint later in the same session. From there it tracked how far price traveled past the gap's far edge before reaching the gap's objective (one gap width beyond the near edge), or until the 4:00 PM end of the window.
| Measure after a midpoint fill | ES | NQ |
|---|---|---|
| Gaps with a midpoint fill | 229 | 374 |
| Median gap width | 3.75 points | 13.25 points |
| Traded past the gap's far edge | 72.93% (167 of 229) | 83.42% (312 of 374) |
| Went past half a gap width beyond the edge | 58.08% (133 of 229) | 69.25% (259 of 374) |
| Went past a full gap width beyond the edge | 49.78% (114 of 229) | 59.09% (221 of 374) |
| Went past two gap widths beyond the edge | 33.62% (77 of 229) | 43.05% (161 of 374) |
| Median travel past the edge | 3.50 points ($175) | 20.6 points ($412.50) |
| 90th percentile travel past the edge | 30.25 points | 138.75 points |
| Objective reached by 4:00 PM | 72.05% (165 of 229) | 75.40% (282 of 374) |
Read the third row first. In this measurement, after a midpoint fill, price traded past the far edge of the gap on 72.93% of ES setups and 83.42% of NQ setups. A stop one tick under the edge is inside the normal noise of this pattern, not outside it.
Two stop plans for a gap entry compared
The same setups were then traded mechanically two ways, with the stop assumed to fill first whenever a single bar touched both stop and target:
- Tight plan. Stop 1 point beyond the gap's far edge.
- Wide plan. Stop 1 point beyond the most extreme price of the 12 bars ending with the gap's third bar, roughly the swing that launched the move.
| Result | ES tight | ES wide | NQ tight | NQ wide |
|---|---|---|---|---|
| Median risk | 2.75 points | 15.00 points | 7.75 points | 75.00 points |
| Median break-even win rate | 34.38% | 73.33% | 27.68% | 79.19% |
| Target hit first | 32.31% | 62.01% | 17.11% | 67.38% |
| Stopped out first | 65.50% | 27.95% | 81.82% | 22.73% |
| Neither by 4:00 PM | 2.18% | 10.04% | 1.07% | 9.89% |
| Average result per resolved trade | minus 0.19 points | minus 0.71 points | minus 2.64 points | minus 1.16 points |
Neither fair value gap stop plan had an edge on its own in this guide's 46-session sample, even before commissions. The tight stop won about as often as its break-even rate on ES and far less often on NQ. The wide stop won two to four times as often, but it paid for that with risk several times larger than the reward, so its higher hit rate still fell short of break-even (62.01% against 73.33% on ES, 67.38% against 79.19% on NQ).
That is the honest result for a context-free gap entry: the pattern is common, price usually comes back, and the mechanical entry by itself did not pay. Whatever edge ICT traders find has to come from the filters they add (higher-timeframe structure, a prior sweep, the time window, premium and discount), and those filters are what you need to test.
A worked fair value gap entry on ES
On October 22, 2026, in the front-month ES contract:
- The 11:10 AM bar printed a high of 7,697.00.
- The 11:15 AM bar ran from 7,691.00 to 7,703.75 and closed at 7,703.25, an 11.50 point body inside a 12.75 point range. That is the displacement.
- The 11:20 AM bar never traded under 7,703.25, leaving a bullish gap from 7,697.00 to 7,703.25, 6.25 points wide.
- The 11:25 AM bar traded down to 7,699.00, filling a limit order at 7,700.00, the midpoint rounded to the tick.
- The objective was one gap width above the upper edge, 7,709.50, for 9.50 points of reward.
| Plan detail | Tight stop | Wide stop |
|---|---|---|
| Stop price | 7,696.00, one point under the gap | 7,685.00, one point under the 7,686.00 swing low |
| Risk on one ES contract | 4.00 points, $200 | 15.00 points, $750 |
| Reward on one ES contract | 9.50 points, $475 | 9.50 points, $475 |
| Break-even win rate | 29.63% | 61.22% |
| What happened | Stopped at 11:30 AM, one bar after entry | Survived a 7,688.75 low at 11:40 AM, target hit at 11:55 AM |
What the worked ES example teaches about stops
The October 22 ES trade produced two real outcomes, and they point in opposite directions. The tight stop had the better math and lost within five minutes. The wide stop won this one, but it needed a 61.22% hit rate to break even, and across the 229 ES setups the wide plan's hit rate stayed under its own break-even line. One winning example proves nothing about the plan.
The lesson is not "use wide stops." It is that the gap edge and the swing are two different trades, each needing its own position size. With the edge stop you accept frequent small losses and need the winners to carry you. With the swing stop you accept fewer, larger losses and must trade fewer contracts for the same dollar risk.
Related lesson: Stop loss orders and placement
ICT vs Smart Money Concepts
ICT and smart money concepts (SMC) overlap heavily. SMC grew out of the same ideas and uses the same building blocks: liquidity, order blocks, fair value gaps (often called imbalances) and structure breaks labeled BOS and CHoCH.
The differences are mostly emphasis and naming. ICT puts more weight on time (kill zones, Silver Bullet windows, the Power of Three daily template) and on Fibonacci-based OTE levels. SMC content tends to be more structure-first and uses simpler labels.
For a trader, the label does not change the work. If a rule has an edge, it has it under either name, and if it does not, renaming it will not help. Pick the vocabulary you find clearer, then define and test the specific rule.
How to Practice ICT Trading Concepts Step by Step
This seven-step sequence turns ICT trading concepts into decisions and keeps the narrative out of your risk:
- Mark the liquidity. Note the nearest swing high above price and swing low under it before you look for a setup. They show where turbulence is likely and where your stop should not sit.
- Name the higher-timeframe structure. Bullish structure means you only look for longs, and only in discount.
- Wait for displacement. No large-bodied, one-directional move means no fresh imbalance worth trading.
- Write the zone down in prices. For a fair value gap, the edges are bar one's high and bar three's low. Your stop and target both come from those numbers.
- Pick the stop before the entry. Edge stop or swing stop is a choice of trade, not a detail.
- Compute the break-even win rate. Risk divided by risk plus reward. If the answer is a hit rate you have never achieved, skip the trade.
- Size from dollars, not points. A 15-point ES stop is $750 per contract at $50 per point. Divide your planned dollar risk by that figure and round down.
Then log every setup you take and every one you skip, with the definition you used. Fifty logged examples of one setup tell you more than any amount of screen time watching all of them.
Common ICT trading mistakes and their fixes
| Mistake | What it looks like | The fix |
|---|---|---|
| Treating a zone as a signal | Buying the instant price touches a gap or order block | Require the confirmation in your written rules, or size for a lower hit rate |
| Trading the sweep alone | Fading every run of a prior high or low | Wait for a structure shift with displacement after the sweep |
| One stop rule for every setup | An edge stop on a setup whose swing sits far away | Choose the stop from the structure, then check the reward still pays |
| Targeting the far side of every gap | Expecting full fills the data does not support | Use the full-fill rate as the ceiling for that target |
| Definition drift | A gap on the 5-minute chart that disappears on the 15-minute | Fix the timeframe and the definition in writing before the session |
| Hindsight labeling | Naming the Power of Three phases after the day closes | Write the expected phase in advance and grade it later |
On our accounts, every position has to be closed by 4:45 PM ET, with no overnight holds, so any ICT setup you trade with us has to play out inside one session, including the wide-stop version. Our contract limits size the trade (a 50K account allows up to 4 minis or 40 micros), and on a 50K Growth evaluation the daily loss limit is $1,250, so a $750 wide stop on one ES contract uses most of a day's room on a single idea. Our funded accounts are simulated.
Related lesson: Risk management for traders
ICT Trading Concepts FAQ
What is the best ICT trading strategy?
There is no single best one; the better question is which setup you can define and measure. The fair value gap entry, the order block retest and the breaker after a sweep have the clearest levels and invalidation. Pick one, fix the timeframe and rules in writing, and log 50 or more examples before trading it with real risk.
Which is better, ICT or SMC?
Neither is better, because ICT and SMC share most of their building blocks and differ mainly in naming and emphasis. ICT leans harder on time windows and OTE levels; SMC is usually more structure-first. A rule works or fails on its own data, whichever label it carries.
Does ICT trading actually work?
Some ICT claims held up in testing and some did not, so it depends on the specific rule and its filters. In a two-year ES and NQ test made for this guide, daily fair value gaps were revisited about 80% to 93% of the time, while swept swing levels reversed no more often than ordinary breaks. A plain gap entry with no extra filter lost money with both a tight and a wide stop, so any edge has to come from the filters you add and test.
What are the key ICT concepts?
The core set is buy-side and sell-side liquidity, market structure, displacement, fair value gaps, order blocks, breaker blocks, premium and discount, optimal trade entry, kill zones and the Power of Three. Fair value gaps and displacement are the easiest to define mechanically, which also makes them the easiest to test.
What does ICT stand for in trading?
ICT stands for Inner Circle Trader, the name under which Michael J. Huddleston teaches his price-action method. Traders use "ICT" both for the teacher and for the vocabulary of concepts he popularized.
What timeframe is best for ICT?
There is no best timeframe, but you must fix one before you look at a chart. A fair value gap on a daily chart and one on a five-minute chart are different objects, with different revisit rates and very different stop distances. Many ICT traders read structure on a higher timeframe and time entries on a lower one.
This article is educational and is not investment or trading advice. The ICT studies here describe historical ES and NQ data over stated windows with stated rules, are not forecasts, and exclude commissions and slippage. Futures are leveraged, and losses can build quickly and exceed what you planned to risk. Evaluation and funded prop accounts are simulated, and simulated results can differ from live trading. Test any method on your own data before relying on it.


