



TL;DR: Order blocks in trading are zones marked from the last opposite candle before a sharp move; the question is whether the retest pays. On 48 sessions of ES and NQ five-minute bars, about two in three zones were retested within 20 bars. Retested zones reached 1R 77.19% of the time on ES against a 64.89% base rate, but the edge was gone by 3R. The stop was hit on 60.96% of retested ES zones, and drawing the zone from the candle body pushed that to 80.88%.
What an order block is in trading
An order block is a price zone marked from the last candle that moved against a sharp move. If price drifts down, prints one more down candle, then drives higher hard enough to clear the recent highs, that last down candle becomes a bullish order block. Traders mark its range and wait for price to come back into it, expecting buyers to defend the zone on the return.
The bearish version is the mirror image. The last up candle before a sharp drop that breaks the recent lows becomes a bearish order block, and traders look to sell when price rallies back into it.
So the real decision is not what to call the candle. It is whether buying (or selling) the return to that zone is a better trade than the ones you would take anyway. Everything else in order block trading comes down to three practical questions:
- Which candle counts as the block, and where exactly the zone starts and ends.
- Whether price comes back to the zone at all, and how quickly.
- What happens after it does, and whether that is any better than what price would have done anyway.
The third question is the one most explanations skip. Order blocks get described with conviction and almost never with a count. This guide counts: 669 zones on ES and NQ, every one marked with the same rules.
Related lesson: Smart money concepts
Order blocks, institutions and liquidity
The institutional footprint story behind order blocks comes from smart money concepts and ICT-style teaching, and it is a story about large traders and liquidity. A fund that needs to buy thousands of contracts cannot do it in one click without pushing price against itself. So it works the order in pieces, often while price is still drifting the other way, and then the remaining demand overwhelms the sellers and price displaces upward.
In that story the last down candle is the footprint of the accumulation, and some of the large order may still be unfilled at those prices. When price returns, the theory goes, the remaining orders absorb selling and push price away again. Liquidity is the other half of the story: the sharp move often starts by running stops above a recent high or below a recent low, which gives the large trader the opposite-side orders it needs to fill.
The story is plausible. It is also not something a candlestick chart can confirm. A bar carries five numbers (open, high, low, close and volume), and none of them says who traded, how big the orders were or what is still resting at a price. Order flow tools such as the depth of market and time and sales get closer, but even they cannot see orders that have not been sent yet.
So treat the institutional explanation as a reason the zone might matter, not as a fact about the zone in front of you. You can, however, measure what price did after zones were marked, and that is what the rest of this guide does.
Related lesson: Liquidity sweeps and stop runs
How an order block forms
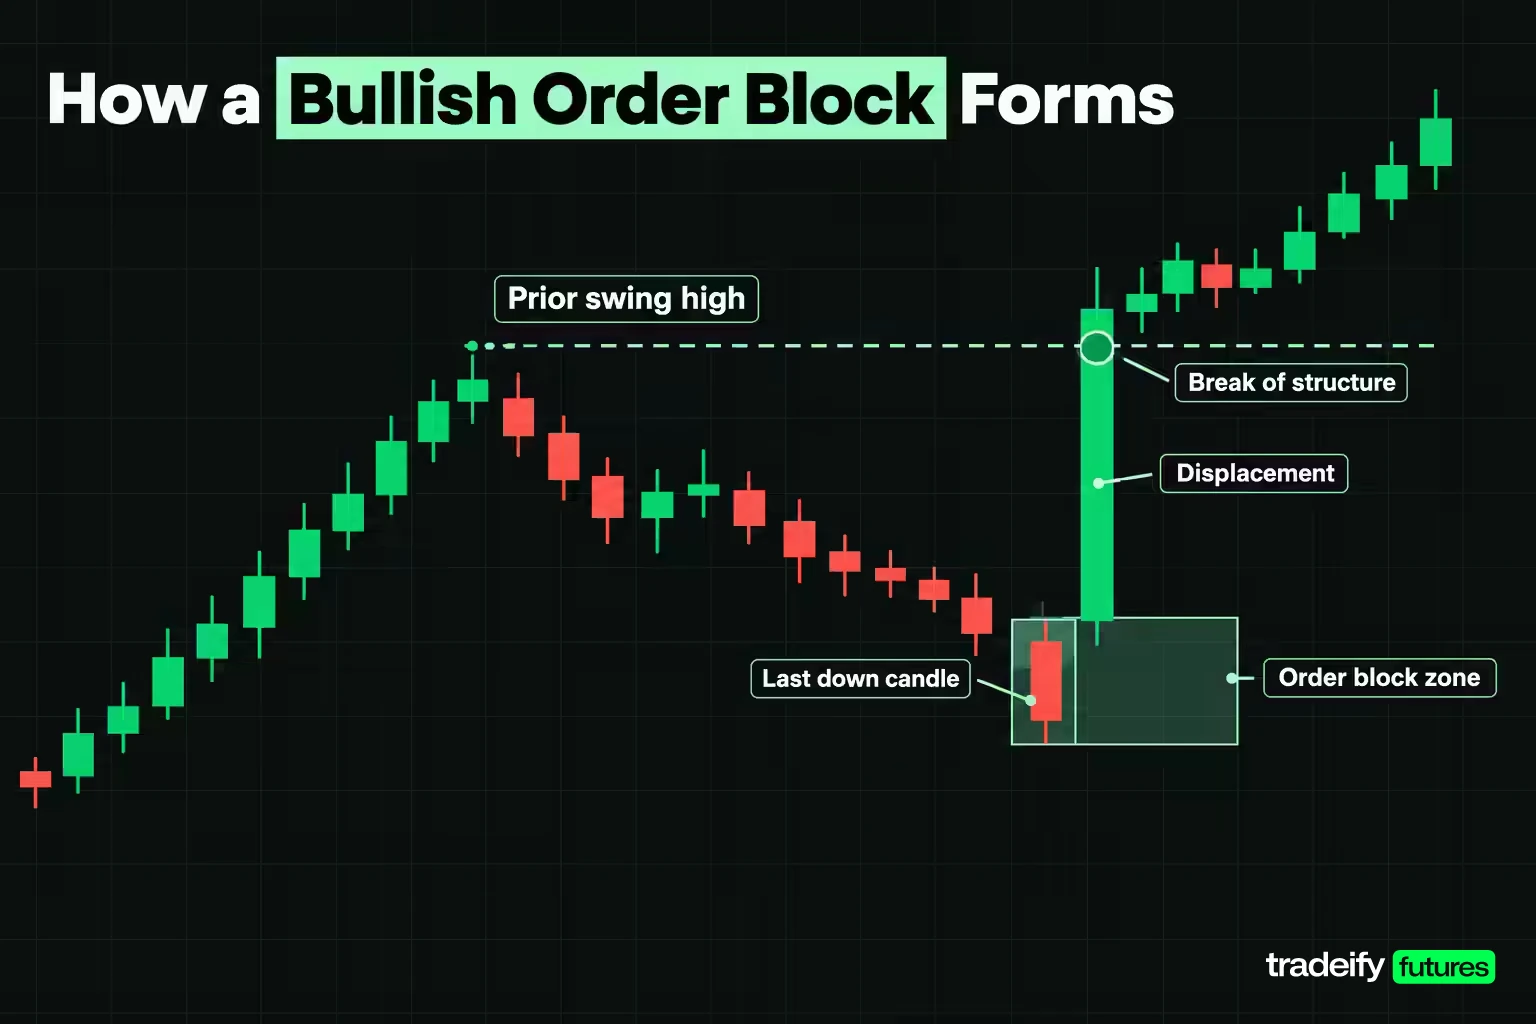
An order block forms in three stages, and the third one is the one that separates a real candidate from an ordinary candle.
- The counter candle. Price makes one or more candles against the coming move. In a bullish order block this is the last down-closing candle before the rally.
- Displacement. Price then moves sharply away in one large candle or a quick series of them. Displacement means the move is large relative to normal bar size, not just a green candle.
- Break of structure. The displacement closes beyond a recent swing high (bullish) or swing low (bearish). This is the condition that says the move changed something on the chart rather than just bouncing inside a range.
Without the third stage, almost every candle on a chart qualifies as the last opposite candle before something. That is why order block traders insist on structure. A rally that never takes out the prior high leaves no evidence that buyers took control, so the candle before it is just a candle.
In the study in this guide, displacement had a fixed meaning: a candle body at least as large as the 14-bar Average True Range (ATR), closing beyond the highest high or lowest low of the previous 20 bars. You can choose different numbers, but choose numbers. If the rule lives in your head, it will drift with your mood.
Related lesson: Break of structure
Bullish and bearish order blocks
Bullish and bearish order blocks are built the same way and traded in opposite directions. The difference that matters in practice is which edge of the zone is the entry and which edge proves you wrong.
| Feature | Bullish order block | Bearish order block |
|---|---|---|
| Block candle | Last down-closing candle before the rally | Last up-closing candle before the drop |
| Displacement | Strong up candle closing above the recent swing high | Strong down candle closing below the recent swing low |
| Expected behaviour on return | Price finds buyers and turns up | Price finds sellers and turns down |
| Near edge (entry side) | Top of the zone | Bottom of the zone |
| Far edge (invalidation) | Bottom of the zone | Top of the zone |
| Idea fails when | Price closes below the zone | Price closes above the zone |
In this guide's 48-session study of Yahoo Finance ES and NQ bars, the fixed rules found 154 bullish and 185 bearish order blocks on ES, and 156 bullish and 174 bearish on NQ. The tilt toward bearish zones reflects that window's tape, not a rule about order blocks; a different stretch of market would give a different split.
One practical trap sits in the bearish case. Selling into a rally feels wrong when the market has been strong all morning, so traders hesitate at the zone and then sell late, nearer the far edge, with a worse stop. Decide the entry before price arrives.
How to identify an order block with fixed rules
Most arguments about order blocks are arguments about marking. Two traders can look at the same rally and draw different rectangles, and then both claim the zone worked or failed. Before any result means something, the way you identify an order block has to be mechanical.
These four rules produced every zone measured in this guide.
- Find the displacement. A candle with a body at least one ATR(14) in size that closes beyond the highest high (bullish) or lowest low (bearish) of the previous 20 bars.
- Walk back to the block candle. From the bar before the displacement, step back at most five bars and take the first candle that closed against the move. If there is none, there is no order block.
- Draw the zone. Use the full range of that candle, low to high. Other conventions exist, such as body-only zones, and they change the stop rate a lot.
- Set invalidation. The far edge of the zone is where the idea dies. A stop sits beyond it with a buffer, here a quarter of the zone's width.
In this guide's study of ES five-minute bars, these rules produced 339 order blocks over 48 sessions, about 7.06 per session. That is a useful sanity check on your own marking. If you are finding thirty order blocks a day on the same chart, your filter is not filtering.
An order block quality checklist
Before a zone earns a place on your chart, run it through five questions:
- Did the displacement candle close beyond the prior swing high or low, or did it just cover ground?
- Is the zone a normal width? In this guide's ES study the median zone was 3.50 points and three in four were 5.25 points or narrower. A much wider block usually means the candle was a news or opening spike.
- What does the stop cost in dollars for the contract you trade, and does it fit your per-trade limit?
- Has price already closed through the zone? A broken zone is a failed idea, not a discount.
- Is there time left in the session for the trade to play out?
Related lesson: Average True Range
Measuring order blocks on ES and NQ
The order block study in this guide used Yahoo Finance continuous front-month five-minute bars for the E-mini S&P 500 (ES) and E-mini Nasdaq-100 (NQ), covering all Globex hours across 48 complete sessions from August 28 to November 4, 2026. That is 12,836 ES bars and 12,835 NQ bars. One corrupted bar printed on October 30 was removed, and no zone or lookback was allowed to span a gap in the data.
Each zone was marked with four fixed rules: a displacement candle with a body of at least one ATR(14) closing beyond the prior 20-bar high or low, a block candle found by walking back at most five bars, a full-range zone, and a stop beyond the far edge. Then:
- Entry was the near edge of the zone, filled when a later bar traded into it.
- The window was the 20 bars (100 minutes) after the displacement candle. A zone that took 19 bars to be retested had one bar left to work.
- The stop was a quarter of the zone's width beyond the far edge.
- Favourable travel was measured in R, where 1R is the distance from entry to stop.
| Order block result in this guide's study | ES | NQ |
|---|---|---|
| Order blocks found | 339 | 330 |
| Per session | 7.06 | 6.88 |
| Retested within 20 bars | 67.26% | 64.55% |
| Median bars to the retest | 3 | 3 |
| Median zone width | 3.50 points | 21.50 points |
| Median stop distance | 4.375 points | 26.875 points |
| Stop reached after the retest | 60.96% | 64.32% |
| Still alive at the window end | 39.04% | 35.68% |
| Median favourable travel | 1.80R | 1.79R |
Read the order block results from this guide's ES and NQ study in two halves. The first half says whether you even get a trade: two of three order blocks were retested, usually within 15 minutes. The second half is the harder news. Of the retested ES zones, 60.96% went on to hit the stop inside the window, even though the median trade had travelled 1.80R in its favour at some point.
Order blocks against a control group
An order block's retest rate means little on its own, because price revisits nearby prices constantly. So this guide's ES and NQ study built a control group with the identical walk-back rule, entry, stop and window, but starting from candles that did not qualify as displacement.
| Control comparison in this guide's study | ES order blocks | ES control zones | NQ order blocks | NQ control zones |
|---|---|---|---|---|
| Zones | 339 | 4,452 | 330 | 4,643 |
| Retested | 67.26% | 97.21% | 64.55% | 97.05% |
| Reached 1R after the retest | 77.19% | 58.46% | 75.59% | 57.10% |
| Stop reached | 60.96% | 75.21% | 64.32% | 75.10% |
| Median favourable travel | 1.80R | 1.31R | 1.79R | 1.26R |
In this guide's study, the control zones were retested almost every time, because a zone drawn right next to price nearly always gets touched. What they did not do was move. Displacement plus a break of structure raised median favourable travel from 1.31R to 1.80R on ES and cut the stop rate by about 14 percentage points. That is the honest version of "order blocks work": the displacement filter changes what happens after the retest. The retest itself is not special.
Retest results against a matched-risk base rate
An order block hit rate is not evidence by itself, because price moves a lot without any pattern. The fair question is whether order block trades reached their targets more often than a move of the same size, in the same direction, would have happened from any bar on the same tape.
For every retested zone, this guide's study took that zone's own stop distance and direction, then checked how often a move of 1R, 2R and 3R happened within 20 bars from every other bar in the sample (11,056 starting bars on ES and 11,075 on NQ). The average across zones is the base rate.
| Target in this guide's study | ES order blocks | ES base rate | ES difference | NQ order blocks | NQ base rate | NQ difference |
|---|---|---|---|---|---|---|
| 1R | 77.19% | 64.89% | +12.30 | 75.59% | 65.74% | +9.85 |
| 2R | 45.61% | 43.21% | +2.40 | 41.78% | 43.53% | -1.75 |
| 3R | 27.19% | 29.62% | -2.43 | 24.88% | 29.58% | -4.70 |
In this guide's study, at 1R the order blocks beat the base rate by 12.30 percentage points on ES and 9.85 on NQ. That is the strongest result in the study. By 2R the advantage is close to zero, and at 3R the zones did slightly worse than a random bar, partly because a retest entry starts with fewer bars left in the window.
So the measured edge lives near the zone. A first target is where order blocks earned their keep in this sample. A 3R target asks the pattern for something it did not deliver.
One more caution about fixed point targets. In the same Yahoo Finance sample, within 20 five-minute bars ES moved at least 5 points in one direction or the other from 94.27% of starting bars, and NQ moved at least 25 points from 98.58%. Price travelling a few points after the retest is not evidence of anything. Direction is the claim, and only the base rate comparison tests direction.
Related lesson: Trading expectancy
Entry, stop-loss and take-profit placement for order blocks
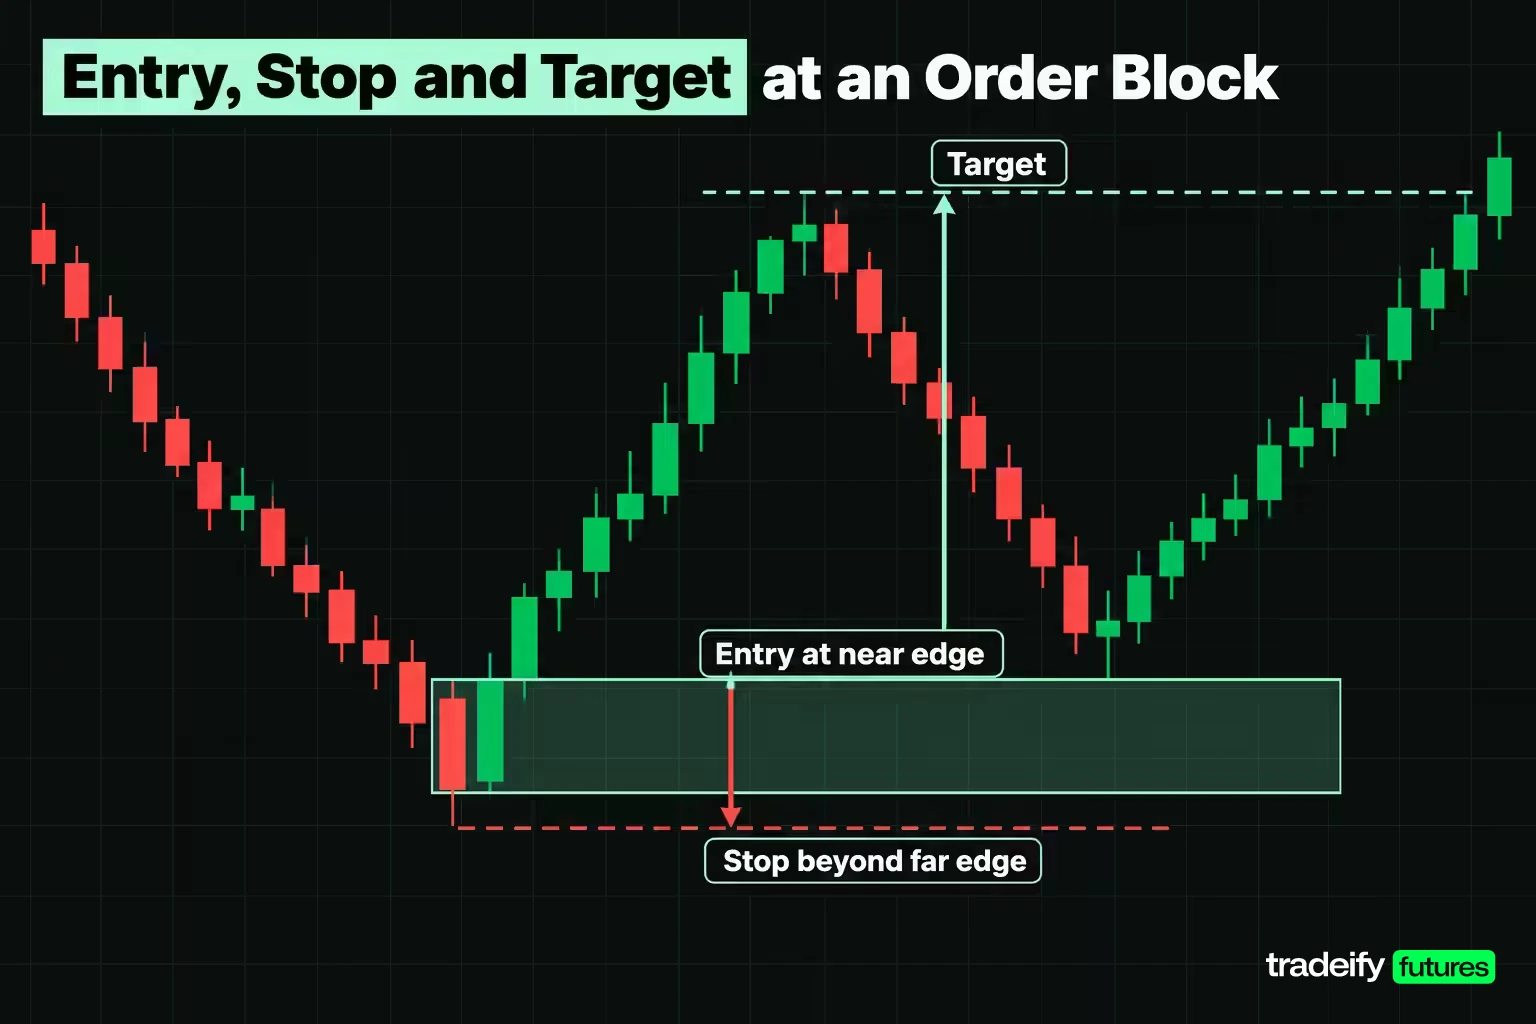
Excursion figures flatter every setup, because a trade can reach 1R, give it back and still count as having reached 1R. A five-minute bar also does not show whether its high or low printed first. To remove both problems, this guide's ES and NQ study scored each retested order block zone in strict order: if the stop was hit on the retest bar, it counted as a loss; after that, bars were read one at a time, and any bar containing both the stop and the target counted as a loss.
| Target used in this guide's study | ES target first | ES stop first | ES unresolved | ES average result | NQ target first | NQ stop first | NQ average result |
|---|---|---|---|---|---|---|---|
| 1R | 48.68% | 44.30% | 7.02% | +0.044R | 40.85% | 53.52% | -0.127R |
| 2R | 28.07% | 55.70% | 16.23% | +0.004R | 21.13% | 61.50% | -0.192R |
| 3R | 16.23% | 60.09% | 23.68% | -0.114R | 12.68% | 63.85% | -0.258R |
Trades still open at the window end were scored at zero. The average result is before commissions and slippage, and those costs matter here. On the median ES zone, a single tick of slippage (0.25 points) costs about 0.06R, which is more than the whole +0.044R average at a 1R target.
That is not a verdict on order blocks as a concept. It is a verdict on one naive version: enter at the near edge on the first touch, fixed stop, fixed target, no further filter. It tells you where the work is. With this entry, the exit and the filter carry the result, not the zone.
Near edge or midpoint entry
Waiting for price to reach the middle of an order block instead of its near edge is a common refinement, and it changes the trade in both directions. In this guide's ES study, a midpoint entry cut the retest rate from 67.26% to 56.05% and the median stop distance from 4.375 points to 2.625 points. Median favourable travel rose from 1.80R to 3.01R, but the stop rate rose from 60.96% to 73.16%. You get fewer, cheaper, more fragile trades.
Stop placement and the drawing convention
Where you draw the order block rectangle moves results more than most filters do. In this guide's ES and NQ study, the signals and tape stayed the same and only the zone convention changed:
| Zone convention in this guide's study | ES median width | ES stop rate | ES still alive | ES median travel | NQ median width | NQ stop rate | NQ median travel |
|---|---|---|---|---|---|---|---|
| Full range, near edge entry | 3.50 points | 60.96% | 39.04% | 1.80R | 21.50 points | 64.32% | 1.79R |
| Open to wick | 2.50 points | 72.55% | 27.45% | 2.70R | 14.75 points | 72.02% | 2.52R |
| Body only | 1.25 points | 80.88% | 19.12% | 5.66R | 8.00 points | 83.94% | 5.20R |
| Full range, midpoint entry | 3.50 points | 73.16% | 26.84% | 3.01R | 21.50 points | 75.27% | 2.91R |
A body-only zone looks sharper and produces huge R multiples, because the stop is tiny. In this guide's study it also got stopped on 80.88% of retested ES zones against 60.96% for the full range. In points, the outcome barely changed: body-only ES zones travelled at least 5 points after the retest 70.59% of the time, against 69.30% for full-range zones. The tighter rectangle made the denominator smaller, not the trade better.
None of the four conventions is obviously best. Full range kept the most trades alive. Body only produced the largest multiples and the worst survival. Pick one, write it down before the session and stop switching to whichever one would have won yesterday.
Take-profit placement
For order blocks, the strict stop-or-target-first test in this guide's ES study points to a first target near 1R, or at the nearest opposing swing if that is closer. A 1R target averaged +0.044R per trade there, while a 3R target averaged -0.114R. If you want to hold for more, scale out part of the position at the first target rather than asking the whole position to reach 3R, where this sample showed no edge over the base rate.
Related lesson: Stop-loss orders and placement
Order block trading strategies
Most order block trading strategies are the same entry with a different filter on top: a plain retest, a higher-timeframe trend filter, a fair value gap filter, or a lower-timeframe confirmation. Two of those filters can be measured with bar data, and this guide's 48-session ES and NQ study did.
The plain order block retest
Mark the zone with fixed rules, place a limit order at the near edge, put the stop beyond the far edge, target 1R or the nearest swing. This is the version measured on ES and NQ for this guide, with the stop a quarter of the zone's width beyond the far edge and a 20-bar window. It is simple and testable. Over 48 sessions it was roughly break-even at 1R on ES before costs (+0.044R per trade) and negative on NQ (-0.127R).
Order blocks with the higher-timeframe trend
The most repeated order block advice is to take only zones that point the same way as the higher-timeframe trend. To test it, each zone was tagged by the daily trend when it formed: aligned when the previous daily close sat on the same side of both its 50-day and 200-day exponential moving averages as the zone's direction, opposed when it sat on the other side of both.
| Daily trend filter in this guide's study | Zones | Retested | Still alive after retest | Reached 1R after retest |
|---|---|---|---|---|
| ES aligned | 116 | 59.48% | 39.13% | 72.46% |
| ES opposed | 155 | 74.84% | 41.38% | 78.45% |
| NQ aligned | 98 | 58.16% | 22.81% | 73.68% |
| NQ opposed | 122 | 70.49% | 45.35% | 72.09% |
In this guide's study, on ES the trend filter made almost no difference to survival. On NQ it pointed the wrong way, with aligned zones surviving 22.81% of the time against 45.35% for opposed ones. Do not read that as advice to trade against the trend. Only 57 aligned NQ zones were retested, and a sample that small swings this far on noise. Read it as a reason not to treat trend alignment as a proven filter for intraday order blocks.
Order blocks with a fair value gap
Another popular filter stacks the order block with a fair value gap, a three-candle imbalance where the displacement leaves a price range untraded (for a bullish move, the low of the candle after the displacement sits above the high of the candle before it).
In this guide's ES study, zones whose displacement left a fair value gap were retested 58.89% of the time against 91.86% without one. Once retested, they survived at a similar rate, 40.94% against 35.44%. On NQ the split was 55.69% against 90.48% for the retest and 37.23% against 32.89% for survival. A gap means price ran farther from the zone, so fewer zones get retested. It did not make the retests clearly stronger.
Order block entries with lower-timeframe confirmation
Some traders refuse to buy an order block zone blind and wait for a lower-timeframe shift inside it, such as a one-minute break of structure in the trade's direction. That trades fewer setups and enters later, with a stop that can sit just beyond the lower-timeframe swing. This guide's ES and NQ study did not measure it, so treat it as a hypothesis to journal, not a fix.
Order block examples from ES
These two ES order blocks were marked with fixed rules: a displacement body of at least one ATR(14) closing beyond the prior 20-bar high or low, a block candle within five bars, a full-range zone and a stop a quarter of the zone's width beyond the far edge. Times are Eastern Time, and prices are the continuous front-month ES series. One worked and one failed, because a set of examples that only shows winners is advertising.
A bullish order block that reached 3R on September 21, 2026
On Monday, September 21, 2026, the 1:10 PM bar opened at 7821.75 and closed at 7826.25, a 4.50-point body against an ATR(14) of 4.45, so 1.01 times ATR. It closed above the prior 20-bar high of 7824.75, so both displacement conditions were met, barely.
| Bar in the bullish example | Time ET | Open | High | Low | Close | What it meant |
|---|---|---|---|---|---|---|
| Block candle | 1:00 PM | 7821.00 | 7822.75 | 7819.50 | 7820.50 | Last down candle, zone 7819.50 to 7822.75 |
| Displacement | 1:10 PM | 7821.75 | 7827.00 | 7821.25 | 7826.25 | Body 1.01 times ATR, close above 7824.75 |
| Retest | 1:25 PM | 7823.75 | 7826.00 | 7822.00 | 7826.00 | Long filled at 7822.75 |
| Deepest pullback | 1:40 PM | 7820.75 | 7827.25 | 7820.00 | 7826.75 | Low 0.68R against; high above the 7826.81 target |
| 2R reached | 2:05 PM | 7830.00 | 7831.75 | 7829.25 | 7830.00 | High above 7830.88 |
| 3R reached | 2:20 PM | 7831.50 | 7837.00 | 7831.00 | 7836.50 | High above 7834.94 |
| Window end | 2:50 PM | 7841.75 | 7844.75 | 7841.50 | 7843.00 | High 5.42R from entry |
The zone was 3.25 points wide. The entry was the near edge at 7822.75, and the stop sat a quarter of the width below the far edge at 7818.69, so the risk was 4.06 points, about $203 per ES contract. In live trading the stop would go on a tradable price such as 7818.50.
The detail worth noticing is the shake after the fill. The retest bar reached 0.80R, the 1:30 PM bar dipped back to 7820.75, and the 1:40 PM bar fell to 7820.00, 0.68R against the entry, while also trading above the 1R target at 7826.81. A trader who moved the stop to break-even after that first pop would have been out at 1:30 PM, before any of the move. The original stop was never threatened.
A bearish order block that failed on October 27, 2026
On Tuesday, October 27, 2026, the 9:45 AM bar opened at 7738.50 and closed at 7724.50, a 14.00-point body against an ATR(14) of 5.26, so 2.66 times ATR, closing below the prior 20-bar low of 7731.50. The walk-back skipped the 9:40 AM bar, which closed down like the move, and took the 9:35 AM up candle as the block.
| Bar in the bearish example | Time ET | Open | High | Low | Close | What it meant |
|---|---|---|---|---|---|---|
| Block candle | 9:35 AM | 7736.00 | 7745.00 | 7732.75 | 7743.00 | Last up candle, zone 7732.75 to 7745.00 |
| Displacement | 9:45 AM | 7738.50 | 7741.75 | 7724.00 | 7724.50 | Body 2.66 times ATR, close below 7731.50 |
| Low of the move | 10:20 AM | 7715.00 | 7721.00 | 7712.50 | 7719.75 | Move complete before any retest |
| Retest | 10:30 AM | 7728.00 | 7739.25 | 7727.25 | 7735.75 | Short filled at 7732.75; bar low 0.36R in favour |
| Stop hit | 10:55 AM | 7744.75 | 7749.75 | 7744.25 | 7748.50 | High above the 7748.06 stop |
The zone was 12.25 points wide, 3.5 times the 3.50-point median. With the stop a quarter-width beyond the top at 7748.06, the risk was 15.31 points, or $765.63 per ES contract.
Two lessons sit in this failure. First, the zone was an outlier. A 12.25-point candle in the opening minutes of the cash session is an opening spike, and a simple width check against the median flags it before any trade. Second, the move had already happened. Price fell to 7712.50 by 10:20 AM without touching the zone, then turned and came back up through it. The retest that filled the short was the start of a reversal, not a return to institutional orders. Reading the direction right and getting a good entry are two different things.
Related lesson: Maximum risk per trade
Sizing an order block stop in dollars
An order block stop is measured in points, but your account loses dollars. ES is worth $50 per index point and NQ $20 per point; their micro versions, MES and MNQ, are $5 and $2 per point. Multiply the stop distance by those values before you decide the trade is worth it.
| Zone | Stop distance | Per ES or NQ contract | Per MES or MNQ contract |
|---|---|---|---|
| Median ES order block | 4.375 points | $218.75 | $21.88 |
| ES failed example | 15.31 points | $765.63 | $76.56 |
| Median NQ order block | 26.875 points | $537.50 | $53.75 |
| NQ zone at the 75th percentile width | 39.69 points | $793.75 | $79.38 |
The same setup on NQ costs about two and a half times the ES stop per full-size contract, and the width varies a lot from zone to zone. That is why the size decision belongs after the zone is drawn, never before. If a fixed contract count is your habit, the wide zones quietly become your biggest bets.
On our accounts, size is capped by contract limits (a 50K account allows up to 4 minis or 40 micros, with 10 micros counting as one mini), and positions are closed by 4:45 PM ET. A 50K Growth evaluation has a $1,250 daily loss limit, so two median NQ order block stops on one NQ contract each use $1,075 of it; the same two stops on MNQ use $107.50.
Related lesson: Risk management for traders
Supply and demand zones, fair value gaps and support compared
Order blocks overlap with three older ideas, and the differences are mostly about how the zone is defined and how wide it is.
| Concept | What defines it | Typical width | Invalidation |
|---|---|---|---|
| Order block | One counter candle before a displacement that breaks structure | One candle's range | Close beyond the far edge |
| Supply and demand zone | The base or consolidation before a strong move, often several candles | Often wider, covers the whole base | Close through the zone |
| Fair value gap | Three-candle imbalance left untraded by the displacement | The gap between candle one and candle three | Gap fully filled and closed through |
| Support and resistance | Prices where swings repeatedly turned | A line or band around it | Acceptance beyond the level |
In practice an order block is a narrow, rule-bound version of a demand or supply zone: same idea, tighter rectangle, one extra condition (the break of structure). A fair value gap often sits right next to the order block on the displacement leg, which is why the two get stacked. And skeptics argue an order block is just support or resistance with a new name. A control test in this guide's ES study checks that argument. Zones built the same way from candles without displacement reached 1R after a retest 58.46% of the time, against 77.19% for real order blocks. So the label is not empty, but the advantage over a matched-risk base rate faded by 2R.
Related lesson: Support and resistance
Breaker blocks and mitigation blocks
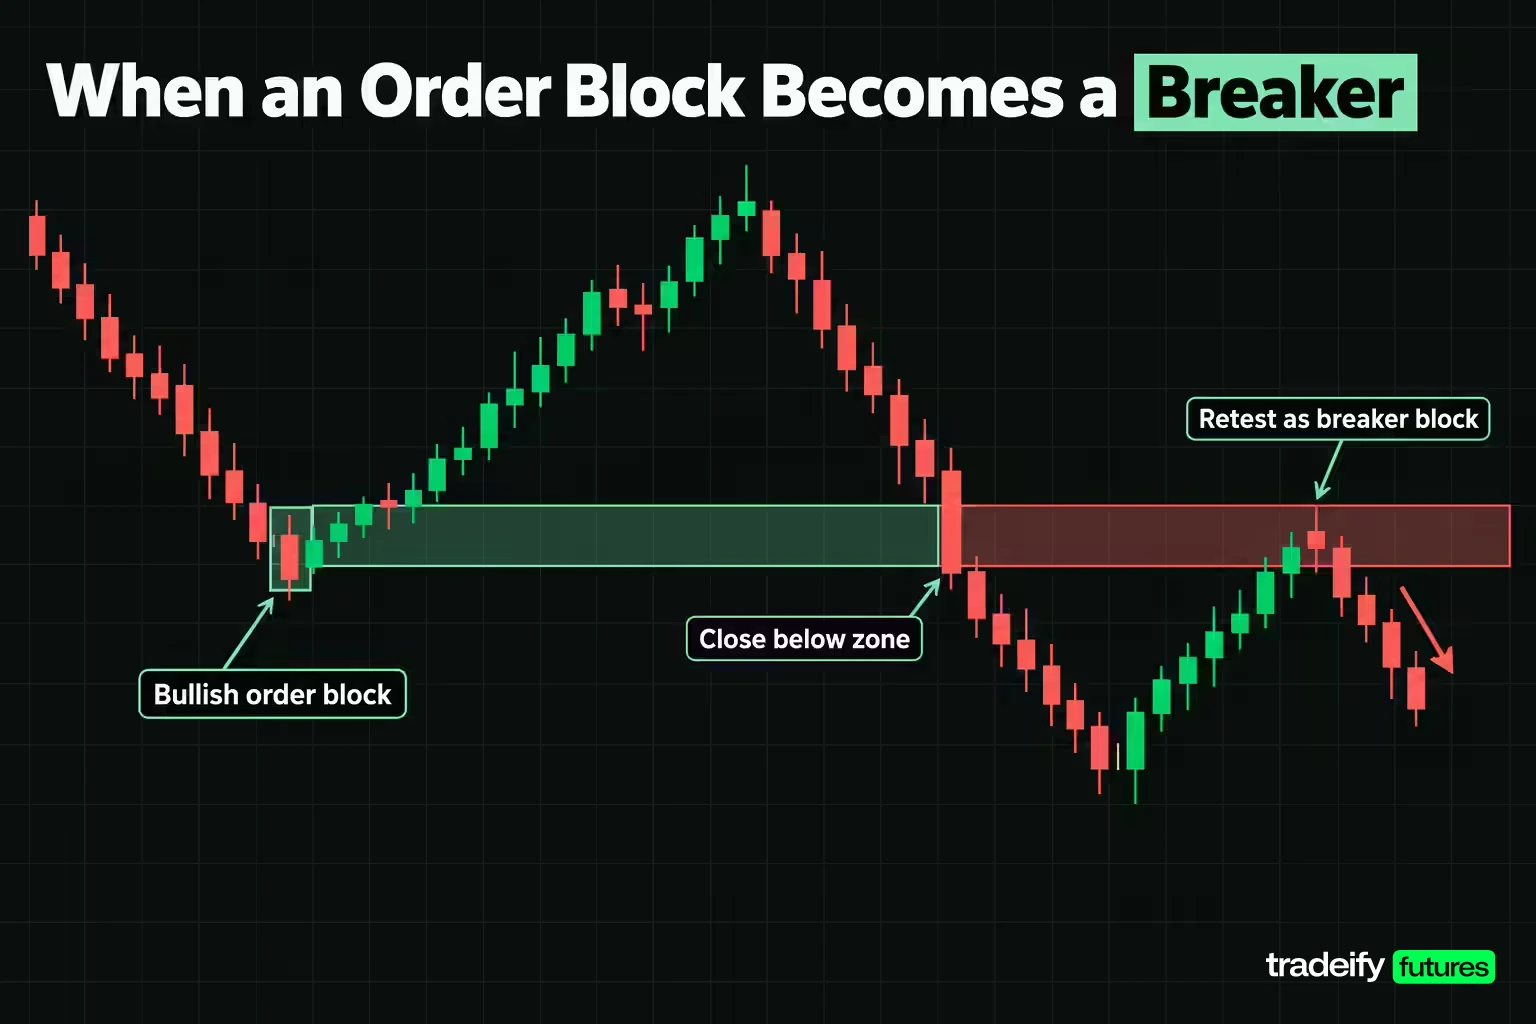
Breaker blocks and mitigation blocks describe what happens after an order block stops working.
- Breaker block. A bullish order block that price breaks down through, closing below its far edge, flips in this framework into a bearish zone. Traders then look to sell a later rally back into it. The bearish case mirrors this. The idea is that the failed zone traps buyers, who sell to get out on the return.
- Mitigation block. A zone left by a failed swing, often where price fails to make a new high or low and then breaks structure the other way. Traders treat the return to that zone as a chance for trapped positions to exit at break-even, which "mitigates" their loss.
Both are refinements of the same mechanics: a zone, a break, a return. They inherit the same marking problem, so they need fixed rules before they mean anything. Neither was measured in the ES and NQ study in this guide.
Order block pros, cons and common mistakes
Order blocks give a structured way to choose a location, a stop and a first target before price arrives. That is a real benefit. The costs are real too.
Order block pros
- The zone defines the entry, the invalidation and the risk at the same time.
- The displacement and structure filters remove most random candles from consideration.
- In this guide's 48-session study, filtered order blocks beat a matched-risk base rate at 1R on both ES and NQ.
Order block cons
- Marking is subjective unless you write rules, and small rule changes move the results.
- In this guide's ES and NQ study, about one in three zones never got retested, so the setup can leave without you. Chasing it afterwards is a different trade with a worse stop.
- Most retested zones in the same study hit the stop within the window: 60.96% on ES and 64.32% on NQ with full-range zones.
- The edge measured in this guide's study disappeared by 3R, so large-target versions need their own evidence.
- The institutional explanation cannot be verified from a chart.
Common order block mistakes
- Calling every last opposite candle an order block, without a displacement or a break of structure.
- Drawing a body-only zone for a tighter stop and then being surprised by the stop rate.
- Trading wide news or opening-spike zones with the same contract count as normal ones.
- Chasing a zone that already closed through its far edge because it "should" hold.
- Moving the stop to break-even after a small first pop. In a September 21, 2026 ES example, a break-even stop after the first 0.80R would have closed a trade that went on to reach 3R.
- Judging the method on a handful of trades. Even the 228 retested ES zones in this guide's study leave the 2R and 3R differences within noise.
Order blocks do not need to be a belief. Log every zone you mark, traded or not, with the convention, the width, the bars to the retest and the result in R. After a few hundred, your own numbers will tell you more than any guide can.
Related lesson: How to keep a trading journal
FAQ about order blocks in trading
How do you find an order block in trading?
Find a candle with a large body that closes beyond the recent swing high or low, then step back to the last candle that closed the other way. Mark that candle's range as the zone. With a body of at least one ATR(14) and a 20-bar swing, this gave about 7 zones per session on ES five-minute bars.
Which timeframe is best for order blocks?
There is no proven best timeframe, and sample size limits the higher ones. On 503 daily bars, the same rules found only 10 ES and 9 NQ order blocks in two years, too few to measure. Five-minute charts produce a countable sample, so test on the timeframe you actually trade.
Which order block is best?
The best order block is one that passes your fixed rules and has a normal width for the market. Narrow body-only zones look precise, but in this guide's ES study they were stopped on 80.88% of retested zones. Full-range zones kept more trades alive.
What are the risks of order block trading?
The main risks are missed retests, frequent stops and wide zones. In this guide's 48-session ES and NQ study, about one in three zones was never retested, and most retested zones still reached the stop. The edge over a matched-risk base rate was clear at 1R but gone by 3R. Wide zones also carry large dollar risk per contract.
Do order blocks work on futures?
Order blocks can be marked on any liquid futures chart, because the pattern comes from price alone. In this guide's study of Yahoo Finance ES and NQ bars, filtered order blocks beat the base rate at 1R by 12.30 and 9.85 percentage points. That edge was small enough that costs and exits decided the result.
Is an order block the same as a supply and demand zone?
They are close relatives. An order block is usually one candle wide and requires a break of structure, while a supply or demand zone often covers a whole base of several candles.
Testing order blocks on your own chart
Before trading order blocks with real risk, write your four rules down (displacement size, structure lookback, zone convention and stop buffer) and mark the next 100 zones on the chart you actually trade, traded or not. Record the bars to the retest, whether the stop or a 1R target came first, and the zone width in dollars per contract. Compare your retest and stop rates with the 67.26% and 60.96% this guide measured on ES. If yours are far apart, your marking differs from these rules, and that is worth knowing before any money depends on it.
Related lesson: Multiple-timeframe analysis
Order blocks are an educational concept, not a trading signal, and nothing here is investment advice. The study figures are measurements of historical bar data from a continuous front-month series under one fixed definition; they are not live trading results, they exclude commissions and slippage, and past behaviour of a pattern does not predict future results. Futures trading involves substantial risk, and leverage means a small move can produce a loss larger than expected. Evaluation and funded prop accounts are simulated, and simulated fills can differ from live execution.


