



TL;DR: Liquidity sweeps happen when price runs an obvious high or low, fills the stops there, then either reverses or keeps going. In 90 ES and NQ events from August 28 to November 4, 2026, only 36.67% closed the session back inside the swept level. Shallow sweeps of 12 ticks or less reclaimed and held far more often, while gap-through opens rarely reversed. Stops a few ticks past the level almost never survived, so size the stop to the excursion, not the level.
A liquidity sweep is one of the most repeated ideas in price action trading. Price pokes through the prior high, takes out the stops parked there, and snaps back. The trader who sold the snap-back looks like a genius. The trader who sold it the next day, when the level broke and never came back, usually doesn't post the chart.
This guide explains what a liquidity sweep is, where the liquidity actually sits, how to mark one so you are not guessing, and how it differs from a stop hunt, a grab and a real breakout. Then it tests the core claim, that a swept level tends to reverse, on 90 level-take events in ES and NQ futures, and turns the result into a trade plan with a stop you can actually defend.
What a liquidity sweep is
A liquidity sweep is a move that trades through an obvious price level, triggers the orders resting just beyond it, and then has to prove whether it can stay there. The level is usually a prior high or low that many traders can see. The liquidity is the cluster of orders sitting just past it.
Liquidity, in plain terms, is the ability to buy or sell without moving price much. In a futures order book it shows up as resting orders at each price. A large buyer needs sellers to trade against. If there aren't enough sellers at the current price, the buyer lifts the offer tick by tick until enough size appears. That is why liquidity matters to every trade: it decides how far price has to travel for an order to fill.
Stop orders are a special kind of liquidity. Under CME's rulebook definition, a stop order becomes a market order once its stop price is elected. A buy stop sits above the market and a sell stop sits below it. So a short seller's protective stop above a prior high is really a dormant market buy order. When price reaches it, it fires and buys at whatever price is available.
Stack enough of those stops above one obvious high and you get a pool of buy orders waiting to be triggered. When price runs into that pool, those orders fill in a burst. What happens next is the whole question:
- The sweep case. The burst of stop orders gets absorbed by sellers, the move runs out of fuel and price closes back under the high.
- The continuation case. The triggered buy stops join fresh buying, price holds above the high and the old resistance becomes the floor of a new range.
Both cases start with the identical chart event. The label "sweep" only becomes accurate after price closes back inside the level. Before that, you are looking at a level being taken, and nothing more.
Related lesson: What is liquidity
Buy-side and sell-side liquidity pools

Liquidity pools sit where many traders place stops and breakout entries at the same prices. The two families are named for the orders waiting there.
Buy-side liquidity rests above highs. It holds the buy stops of traders who are short and the buy-stop entries of breakout traders waiting for a new high. When price trades through, both groups become buyers at once.
Sell-side liquidity rests below lows. It holds the sell stops of traders who are long and the sell-stop entries of traders waiting to short a breakdown.
The levels that attract the biggest pools tend to be the ones that are easiest to see:
| Liquidity zone | Why orders cluster there | What to watch |
|---|---|---|
| Prior session high or low | Day traders use yesterday's range for stops and breakout entries | The first trade through it in the new session |
| Swing highs and swing lows | Stops go just past the last turning point | Whether the swing was clean or already tested |
| Equal highs or equal lows | Two or more touches at one price look like a wall, so stops pile behind it | A third touch that trades through by a few ticks |
| Round numbers | Traders anchor orders to whole numbers | Quick probes through the number that stall |
| Support and resistance zones | Many methods agree on the same area | How long price has respected the zone |
| Opening range high or low | Intraday breakout traders key off the first minutes | Breaks that happen with no follow-through |
Not every level holds the same amount. A high that has been tested four times and is visible on every timeframe probably has more stops behind it than a minor swing on a 1-minute chart. But you never see the actual pool. Retail futures data shows resting limit orders at best, not the stop orders waiting to be elected, so the size of a stop pool is always an inference from where traders tend to put stops.
Related lesson: Support and resistance
How to spot a liquidity sweep on a chart
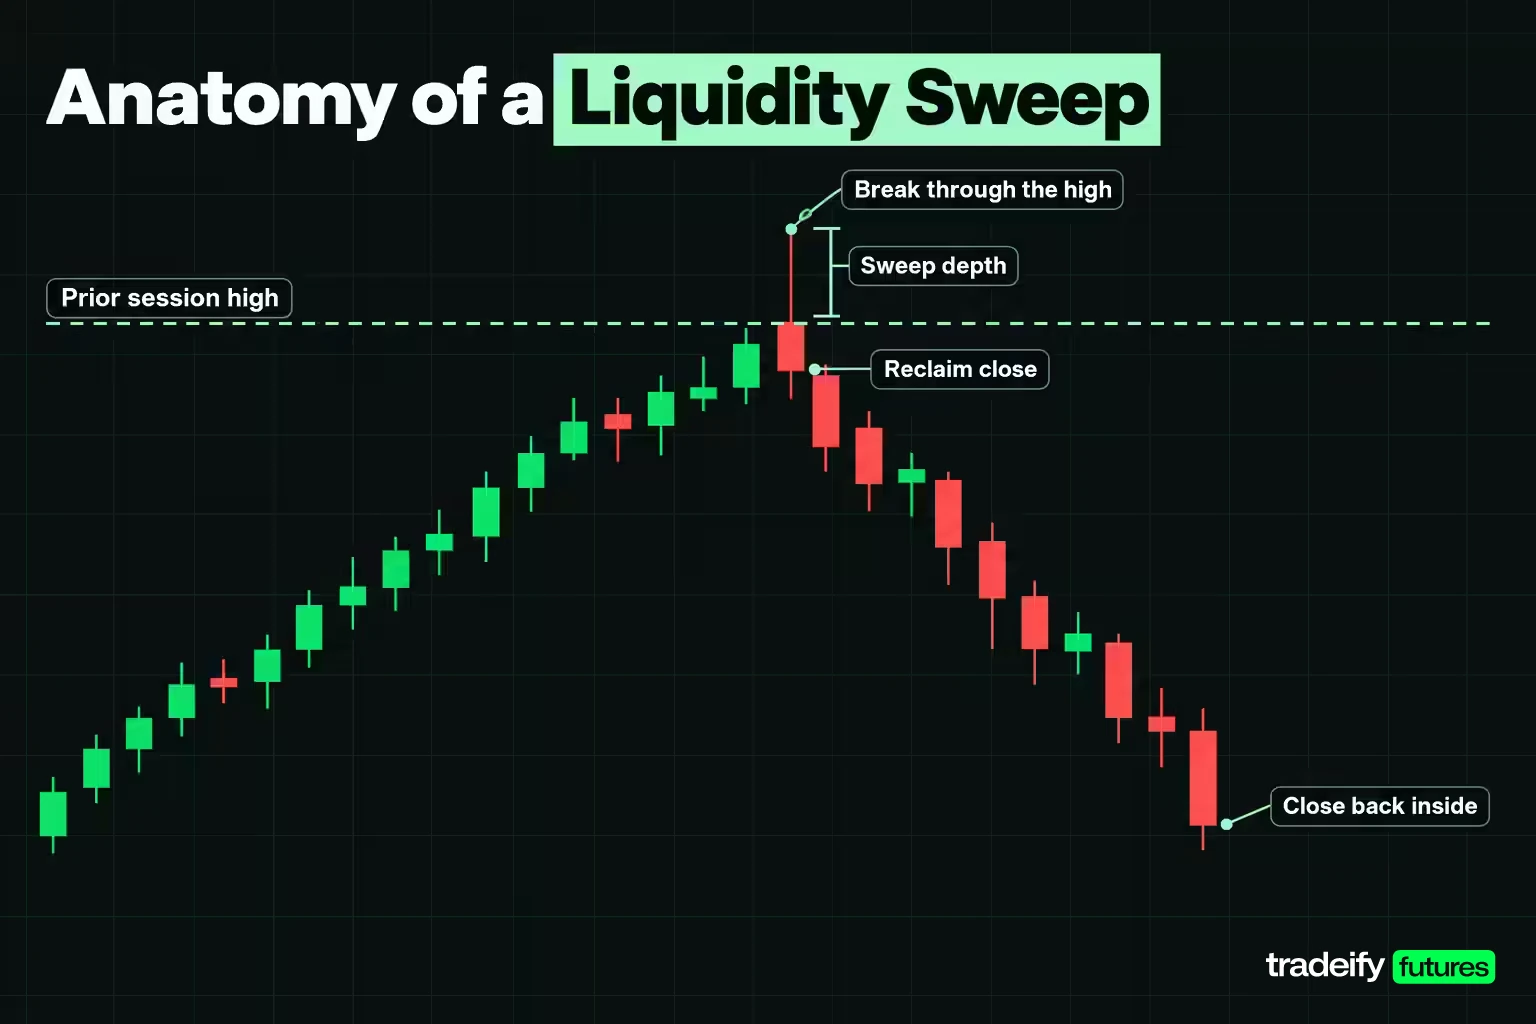
Spotting a liquidity sweep reliably comes down to writing the definition before you look at the chart. Most arguments about whether something "was a sweep" happen because nobody defined the level, the break or the reclaim in advance. These five definitions are the ones used for the 90-event study in this guide, and they work as a manual checklist you can run by hand.
- Mark the level. Use the prior session's regular-hours high and low. For ES and NQ that means the 9:30 AM to 4:00 PM ET window, which matches the NYSE regular session. Both contracts trade almost around the clock on CME Globex, from Sunday 6:00 PM to Friday 5:00 PM ET, so the overnight session is left out on purpose. The day-session high and low are the levels most day traders actually draw.
- Define the break. A buy-side take is the first trade above the prior high in the new session. A sell-side take is the first trade below the prior low. A touch at exactly the level is not a break. Price has to print at least one tick through.
- Define the reclaim. The reclaim is the first 5-minute bar that closes back on the original side of the level. For a buy-side take, that is the first close back below the prior high. The break bar can be the reclaim bar if it trades through and closes back inside.
- Measure the depth. Depth is how far beyond the level price traded between the break and the reclaim close, counted in ticks. One ES tick is 0.25 index points.
- Score the outcome at the close. If the 4:00 PM close is back inside the level, the level held and the sweep label fits. If the close is beyond the level, the market accepted the new price.
When a liquidity sweep is confirmed
Step 5 is the part most sweep content skips. You only get to call a liquidity sweep confirmed after the reclaim close, and you only get to call it successful after the session. Everything before that is a level being taken, which can go either way.
Related lesson: Regular trading hours vs extended trading hours in futures
Liquidity sweep vs stop hunt, grab and breakout
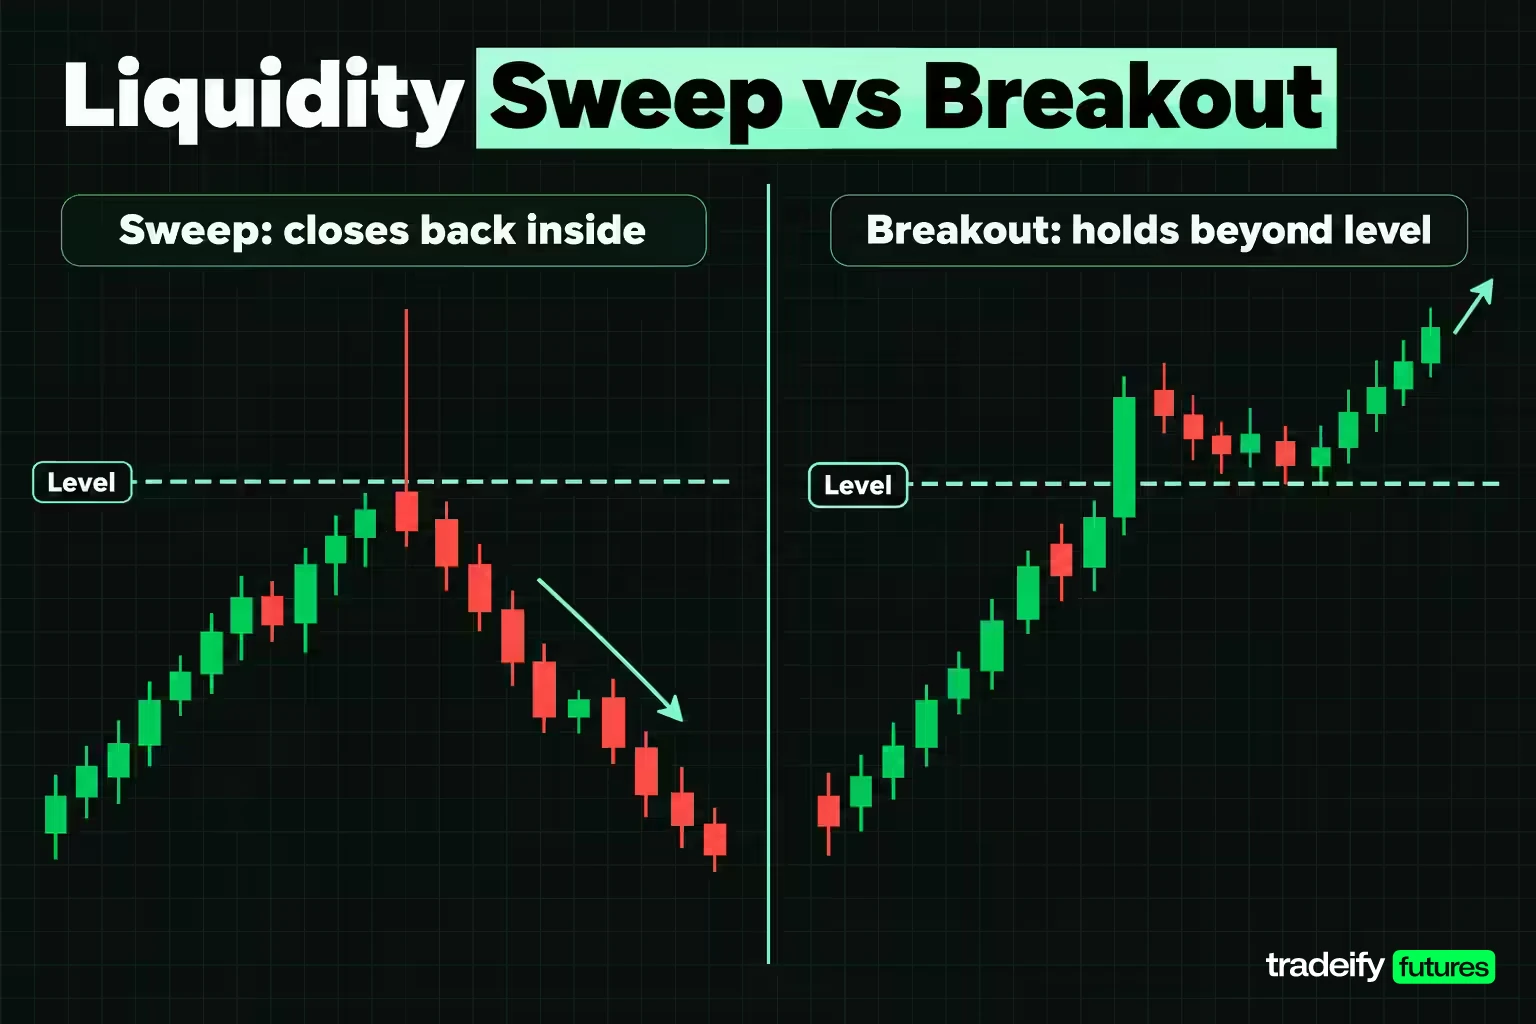
A liquidity sweep, a stop run, a liquidity grab and a stop hunt all describe price trading through a level full of stops. The terms differ in what they assume happened next and why. A breakout and a break of structure describe the opposite outcome.
| Term | What it describes | What it assumes | When you can call it |
|---|---|---|---|
| Stop run | Price reaches a cluster of resting stops and triggers them | Nothing about intent | As soon as the level trades through |
| Liquidity sweep | Price takes the stops, then closes back inside the level | That the move was absorbed and reversed | After the reclaim close |
| Liquidity grab | Usually a fast, shallow sweep, often a single wick | That size was filled against the triggered stops | After the reclaim close |
| Stop hunt | The same event told as an attack on traders' stops | That someone aimed price at the stops on purpose | Never from the chart alone |
| Liquidity run or true breakout | Price takes the level and holds beyond it | That fresh orders joined the move | After price holds beyond the level, often at the close |
| Break of structure | A close beyond a prior swing that changes the trend reading | That the trend has shifted | On a closing basis, not on a wick |
The practical difference between a sweep and a breakout is time. The first few minutes after the break look the same in both cases. A sweep reveals itself by closing back inside. A breakout reveals itself by not doing that, then using the old level as support or resistance from the other side.
So the useful question is not "is this a sweep or a breakout?" while the bar is still open. It is "what has to happen for me to believe one over the other, and where am I wrong?" A reclaim close is the minimum evidence for the sweep case. A retest of the old level from the new side that holds is the usual evidence for the breakout case.
Related lesson: Breakout trading
Smart money and liquidity sweeps
The smart money explanation of liquidity sweeps goes like this. Large participants need a lot of opposing orders to fill big positions without moving price against themselves. A cluster of stops above a high is a ready supply of market buy orders. A large seller can let price run into that cluster and sell into the burst, getting a full fill at a good price. Once the stops are used up, there is nobody left to buy, and price falls back.
Part of that story is mechanical and checkable. Stop orders do become market orders when elected, and a burst of market orders does give a large resting order something to trade against. That is just how an order book works, and you can see it on a footprint chart or a time and sales feed as a spike in volume through the level.
The other part is about intent, and that part can't be confirmed from price data. A chart shows prices, sizes and timing. It does not show who placed the orders or why. The same reversal can come from a large seller absorbing stops, from short-term traders taking profits into a new high, or from a scheduled news release that changes the story ten minutes later.
The intent story also has an awkward problem. If large traders reliably reversed price at every swept level, sweeps would reverse most of the time. In the 90 events tested in this guide's own study, the majority did not. That does not prove smart money is absent. It means the presence of stops is not enough on its own, and a liquidity sweep needs evidence of rejection before it deserves a trade.
The useful way to hold the smart money idea is as a reason levels matter, not as a promise about what happens there. Obvious levels attract orders. Orders create fast moves when triggered. Whether that fast move reverses or extends is decided by what happens after, and that you can measure.
Related lesson: Smart money concepts
How often sweeps reversed in 90 events
Most liquidity sweep content shows the trades that worked. To see the base rate, this study counted every time ES or NQ traded through the prior session's regular-hours high or low over roughly ten weeks, and recorded what happened.
How the 90 sweep events were measured
- Data. Yahoo Finance continuous front-month 5-minute bars for ES and NQ, regular hours only (9:30 AM to 4:00 PM ET), read on November 4, 2026.
- Sessions. August 28 to November 4, 2026. September 14 and September 15 were excluded because the continuous series switched from the September to the December contract in the middle of September 14, which would have compared levels from two different contracts. That leaves 46 sessions per market.
- One bad bar. The feed printed a corrupted 3:00 PM bar on October 30, 2026 in both markets, and that bar was dropped.
- Events. The first trade through the prior high (buy-side) and the first trade through the prior low (sell-side) in each session, each counted once. That produced 47 ES events and 43 NQ events, 90 in total. ES took both levels in the same session 5 times and NQ 2 times.
- Outcome. Whether the 4:00 PM close finished back inside the level (the sweep held) or beyond it (the market accepted the new price).
All figures are my own calculation on that data. This is an illustrative study of one ten-week stretch in two correlated index futures, not a forecast.
Acceptance beat the sweep reversal in every cell
| Market and side (this guide's 90-event study) | Events | Closed beyond the level | Closed back inside | Acceptance rate | Sweep rate |
|---|---|---|---|---|---|
| ES buy-side (prior high taken) | 23 | 15 | 8 | 65.22% | 34.78% |
| ES sell-side (prior low taken) | 24 | 14 | 10 | 58.33% | 41.67% |
| NQ buy-side (prior high taken) | 20 | 15 | 5 | 75.00% | 25.00% |
| NQ sell-side (prior low taken) | 23 | 13 | 10 | 56.52% | 43.48% |
Across all 90 events in this guide's study of Yahoo Finance 5-minute data, 33 closed the session back inside the swept level. That is 36.67%. The other 57 closed beyond it. In every one of the four cells, the level breaking and staying broken was the more common result.
That does not make the liquidity sweep useless. It means the break itself is not a signal to fade. If you sold every new high and bought every new low the moment it traded, you would be betting on the minority outcome every time.
Sweep events that never reclaimed the level
A stricter version of "the level broke for real" is that price never closed a single 5-minute bar back inside the level for the rest of the session. In this guide's study, that happened on 30 of the 90 events, or 33.33%.
| Market and side (this guide's study) | Events | Never closed back inside | Share of events | Reclaimed at least once |
|---|---|---|---|---|
| ES buy-side | 23 | 6 | 26.09% | 17 |
| ES sell-side | 24 | 9 | 37.50% | 15 |
| NQ buy-side | 20 | 7 | 35.00% | 13 |
| NQ sell-side | 23 | 8 | 34.78% | 15 |
These are the events where a sweep trader using a reclaim rule would never have entered. That is the first job of a confirmation rule: keep you out of the third of events that simply keep going.
The other 60 events did reclaim at least once. But a reclaim close is not the end of the story either, because many of those 60 crossed back through the level later and still closed beyond it.
Sweep depth and session timing
Two pieces of market context split the sweep outcomes more than anything else in the data: how far price ran past the level before reclaiming, and when in the session the level was taken.
Sweep depth at the reclaim close
For the 60 events that reclaimed, depth is the furthest price traded beyond the level before the first reclaim close.
| Depth beyond the level at the reclaim (this guide's study) | ES events | ES closed back inside | NQ events | NQ closed back inside | Both markets closed back inside |
|---|---|---|---|---|---|
| 1 to 12 ticks | 11 | 72.73% | 2 | 100.00% | 76.92% of 13 |
| 13 to 48 ticks | 7 | 28.57% | 5 | 40.00% | 33.33% of 12 |
| 49 to 128 ticks | 11 | 45.45% | 3 | 66.67% | 50.00% of 14 |
| More than 128 ticks | 3 | 100.00% | 18 | 50.00% | 57.14% of 21 |
The clearest line in this guide's depth table is the first row. When the liquidity sweep stayed within 12 ticks of the level (3.00 points on ES) and closed back inside, the level held into the close 76.92% of the time across both markets, against 36.67% for all 90 events. A shallow liquidity sweep that gets rejected quickly looks like a market that tested for orders and found no follow-through.
Past that first row, the pattern is not clean. Depth does not keep stepping down in an orderly way, and several cells hold fewer than ten events. A tick count also means different things in each market: NQ routinely moves several times more index points than ES, so 128 ticks on NQ is a smaller move in relative terms. Read the shallow row as a finding worth testing on your own charts, and the rest as noise until you have more data.
Session timing and the gap-through open
The time of the break mattered even more than the depth.
| When the level was first taken (this guide's study) | Events | Closed back inside | Rate |
|---|---|---|---|
| Session opened already beyond the level | 44 | 10 | 22.73% |
| Traded through during the first 5-minute bar | 13 | 4 | 30.77% |
| Taken from 9:35 to 10:55 AM ET | 19 | 12 | 63.16% |
| Taken at 11:00 AM ET or later | 14 | 7 | 50.00% |
In this guide's 90-event study, almost half of the events, 44 of 90, were not really sweeps in the day session at all. The overnight market had already moved price past yesterday's high or low before 9:30 AM. Those gap-through opens closed back inside only 22.73% of the time. When the level was taken after the first bar, the reclaim-and-hold rate was 57.58% (19 of 33).
That is a practical filter. A level that was taken during regular hours, after the open had a chance to settle, behaved far more like the textbook liquidity sweep than a level the overnight session had already run through.
Trend and structure around the sweep
Depth and timing are not the only context worth checking. A sweep against a strong trend asks the market to reverse something that is working. A sweep of a high inside a clear downtrend, in contrast, lines up with the move that is already in control. The study did not split events by trend, so treat this as a reason to check the higher timeframe, not as a measured edge.
Structure tells you where you are wrong. If a sweep of the high is followed by a close below the last higher low on your execution timeframe, that is a break of structure in the sweep's favor. If price instead closes back above the swept high, the sweep idea is finished.
Related lesson: Market structure highs lows and trends
How to trade a liquidity sweep step by step
A liquidity sweep trade plan needs four decisions made before price reaches the level: the trigger, the entry, the stop and the exit. The plan here uses the reclaim-close rules tested on 60 reclaimed ES and NQ events in this guide's study, then walks through one ES session where a liquidity sweep trade worked and one where it didn't.
The sweep trade rules
- Wait for the break. Do nothing as price trades through the level. The break is the condition, not the signal.
- Wait for the reclaim close. Enter only when a 5-minute bar closes back on the original side of the level. After a buy-side take you sell; after a sell-side take you buy.
- Enter at that close. The entry is the reclaim bar's close, not the level itself. It is usually a few ticks inside the level, and sometimes many points away.
- Place the stop one tick beyond the sweep's extreme. The extreme is the furthest price reached between the break and the reclaim close. This is the structural stop, and it is the smallest stop the rule can justify.
- Target twice the risk, and be flat by the close. Take profit at 2R if it trades. If neither the stop nor the target is hit, exit at the session close.
In a liquidity sweep trade, steps 1 and 2 are where most of the discipline goes. The temptation is to sell the high as it breaks, because the reclaim entry is always worse than the level. The study says that temptation is the expensive part: entering on the break means taking every one of the events that never came back.
Worked liquidity sweep example on ES, September 22, 2026
| Step | Value |
|---|---|
| Prior session (September 21, 2026) regular-hours high | 7,847.25 |
| Prior session regular-hours low | 7,758.25 |
| 9:30 AM bar high | 7,847.25, a touch at the level, not a break |
| 9:35 AM bar high, the break | 7,848.50 |
| 9:35 AM bar close, the reclaim | 7,846.50 |
| Sweep depth | 1.25 points, 5 ticks |
| Entry, short at the reclaim close | 7,846.50 |
| Stop, one tick beyond the extreme | 7,848.75 |
| Risk per contract | 2.25 points, 9 ticks |
| Risk on one ES at $50 per point | $112.50 |
| Risk on one MES at $5 per point | $11.25 |
| 2R target | 7,842.00 |
| 9:40 AM bar | High 7,846.25, low 7,840.50, target filled, stop untouched |
| Session close | 7,831.00, back inside the level |
The prior day's high was 7,847.25. The 9:30 AM bar tagged exactly 7,847.25 but did not trade through it, so by the rule it was not a break. The 9:35 AM bar traded up to 7,848.50, one and a quarter points through the high, and then closed at 7,846.50, back under it. Break and reclaim happened in the same bar.
The short goes on at 7,846.50 with the stop at 7,848.75. That is 9 ticks of risk, which is $112.50 on one ES or $11.25 on one MES. The very next bar traded down to 7,840.50 and filled the 2R target at 7,842.00. The session closed at 7,831.00, so holding to the close would have made 15.50 points, about 6.89 times the risk.
This session had the three features that separated the better events in the 90-event study: the level was taken after the opening bar, the sweep was shallow, and the rejection was immediate. That combination is uncommon, which is part of why it is worth waiting for.
When the sweep read is right and the stop still loses
An ES session on August 28, 2026 shows a liquidity sweep trade that lost even though the level held. The prior session's regular-hours high was 7,755.50. The 9:40 AM bar traded to 7,757.50 and closed at 7,755.00, a textbook shallow sweep with a reclaim on the same bar.
The reclaim-close rules (enter at the close, stop one tick beyond the extreme, target 2R) put the short at 7,755.00 with a stop at 7,757.75, risking 2.75 points (11 ticks, $137.50 on one ES). The next bar traded both 7,758.00 and 7,749.00. On 5-minute bars you can't tell which came first, so the study scores it as a stop, the conservative call. Either way, the 10:00 AM bar ran up to 7,760.50, 20 ticks above the level, and would have taken out the stop if the earlier bar hadn't.
The session then closed at 7,722.75, 32.75 points under the swept high. The read was right. The level held, and held by a lot. The trade still lost, because the stop was inside the normal noise of a 5-minute bar at the open.
That is the trade-off at the center of liquidity sweep trading. The tight structural stop makes the risk small and the reward multiple large, but it gets hit by ordinary chop. A wider stop survives the chop but shrinks the position you can afford.
Related lesson: Trade setups and confirmation
Where to put the stop on a sweep trade
The most common liquidity sweep advice is to put the stop "just beyond the swept level." Using the 90 ES and NQ events in this guide's study, this section measures how that advice would have fared, then what a reclaim-close entry returned with different stops.
Stop survival beyond the swept level
For each of the 90 events, the study measured the furthest price traded beyond the level from the break to the session close. A stop placed a given number of ticks beyond the level survives only if price never reached it.
| Stop distance beyond the level (this guide's study) | ES points | ES events spared (of 47) | NQ events spared (of 43) |
|---|---|---|---|
| 4 ticks | 1.00 | 0 (0.00%) | 0 (0.00%) |
| 8 ticks | 2.00 | 2 (4.26%) | 0 (0.00%) |
| 16 ticks | 4.00 | 4 (8.51%) | 0 (0.00%) |
| 32 ticks | 8.00 | 5 (10.64%) | 0 (0.00%) |
| 64 ticks | 16.00 | 8 (17.02%) | 0 (0.00%) |
| 128 ticks | 32.00 | 23 (48.94%) | 1 (2.33%) |
| 256 ticks | 64.00 | 39 (82.98%) | 3 (6.98%) |
In this guide's study, a stop 4 ticks past the level survived none of the 90 events. On ES, you needed about 128 ticks (32.00 points) before even half the events spared the stop. The median ES event traveled 131 ticks past the level by the close. On NQ the median was 899 ticks, about 224.75 points, so no stop in the table was close to safe.
Part of that is by design: 57 of the 90 events closed beyond the level, and any stop beyond the level gets hit in those. But even when the level does hold, a stop a few ticks past it often sits inside the normal range of one 5-minute bar at the open, so it gets hit by chop before the reversal arrives.
The dollar side is what makes this a risk question. A 128-tick stop on one ES is $1,600. On one MES it is $160. For most traders, a stop wide enough to survive a typical ES sweep is only affordable on the micro contract.
What the sweep rules returned before costs
The same entry was tested with different stop rules on all 60 reclaimed events (32 ES, 28 NQ). Results are in R, meaning multiples of the risk on each trade, with no commission or slippage deducted.
| Market and stop rule (this guide's backtest) | Trades | Hit 2R | Stopped | Exited at the close | Total R | Average R per trade |
|---|---|---|---|---|---|---|
| ES, structural stop | 32 | 9 | 14 | 9 | +2.78 | +0.087 |
| ES, structural stop, sweep 12 ticks or less | 11 | 5 | 5 | 1 | +5.00 | +0.455 |
| ES, structural stop, sweep deeper than 12 ticks | 21 | 4 | 9 | 8 | -2.22 | -0.106 |
| ES, fixed 16-tick stop | 32 | 14 | 17 | 1 | +11.00 | +0.344 |
| ES, fixed 64-tick stop | 32 | 5 | 18 | 9 | -5.59 | -0.175 |
| NQ, structural stop | 28 | 4 | 16 | 8 | -8.13 | -0.291 |
| NQ, fixed 16-tick stop | 28 | 4 | 23 | 1 | -15.00 | -0.536 |
| NQ, fixed 128-tick stop | 28 | 14 | 12 | 2 | +16.91 | +0.604 |
Reading the liquidity sweep backtest
Three readings from this guide's backtest are worth keeping, and one deserves suspicion.
- The structural rule was roughly flat on ES. 32 trades produced +2.78R before costs, an average of +0.087R. Costs would take a bite out of that: on a 9-tick stop, one tick of slippage on the way in and one on the way out is about 0.22R.
- Depth carried the ES result. Shallow sweeps of 12 ticks or less made +5.00R over 11 trades. Deeper sweeps lost 2.22R over 21. Shallow sweeps were also the group most likely to close back inside the level, so the trade results and the outcome counts point the same way.
- The structural rule lost on NQ. In this guide's backtest, NQ's median structural stop was 346.5 ticks, and the rule lost 8.13R over 28 trades.
- The best fixed stops are hindsight. ES did best with a 16-tick stop and NQ with a 128-tick stop. Those numbers were picked after seeing the data. A 64-tick stop on ES lost 5.59R in the same sample, which shows how sensitive the result is. Do not treat any single fixed distance as the answer.
The sample is small, it covers one ten-week market stretch, and two index futures that move together are not two independent tests. Treat these figures as a description of how the rule behaved, not a strategy to copy.
Common liquidity sweep mistakes
- Fading the break. Selling the new high as it trades means taking every event that never came back, which was a third of the 90 events in this guide's study.
- Treating the gap-through open as a liquidity sweep. When the overnight session had already run the level, the textbook reversal was the exception in this guide's study, at 22.73%.
- Putting the stop a few ticks past the level. Measured over the session, that stop was hit almost every time.
- Sizing the trade to the level instead of to the stop. The stop distance decides the position size, not the other way round. If a structural stop is too wide for your risk budget, the answer is a smaller contract or no trade.
- Calling every reversal smart money. It encourages seeing intent in normal noise and adding to losers because "they" will reverse it.
On risk per trade, many traders use a fixed percentage cap. The "2% rule" means never risking more than 2% of trading capital on a single trade. The "3-5-7 rule" is an informal guideline: risk no more than 3% on one trade, keep total open risk under 5%, and aim for winners at least 7% larger than losers. Neither is a regulation, and for a strategy whose stops can be this wide, the right cap is the one that keeps a losing streak survivable.
Related lesson: Stop-loss orders and placement
Liquidity sweep indicators and order flow tools
Liquidity sweep indicators can help you see the event sooner, but none of them decides the trade. The useful tools fall into a few groups:
- Sweep and swing indicators. These mark swing highs and lows and flag a candle that wicks through and closes back inside. They save time on marking levels. They can't tell you whether the sweep is shallow or deep in a way that matters, or whether the open already ran the level.
- Volume profile. A low-volume area just past a level can explain why price moves through it quickly. A high-volume node near the level can explain why price stalls there.
- Footprint and order flow. A footprint chart shows volume traded at the bid and the offer inside each bar. A sweep that prints heavy aggressive buying through the high with no upward progress is one sign of absorption. Full depth-of-market data is often a paid add-on, so check what your data feed actually includes.
- Order blocks and fair value gaps. In ICT and smart money methods, a sweep is often paired with a return to an order block or gap as the entry area. That is a different entry rule from the reclaim close, and it should be tested on its own.
The 90-event study in this guide needed none of these. Prior session high, prior session low, a 5-minute close and a tick count were enough to separate the better events from the worse ones.
Related lesson: Order flow analysis
Liquidity sweeps in futures, forex and crypto markets
The liquidity sweep idea works anywhere traders put stops beyond obvious levels, but the data you can check it with differs by market.
- Futures. ES, NQ and other exchange-traded futures trade on one central order book, so the volume and price at a level are the same for everyone. That makes futures the cleanest place to test sweeps. The overnight session matters a lot: in this guide's 90-event study of ES and NQ, levels the overnight market had already run through before 9:30 AM ET closed back inside only 22.73% of the time.
- Spot forex. There is no single central exchange for spot currency trading, so the volume you see is your provider's, not the whole market's. Prior session highs and lows still work as levels, but "session" needs a definition, because the market trades through Asia, London and New York.
- Crypto. Spot crypto and perpetual futures trade around the clock on many venues, so there is no regular-hours session to define a prior high. Traders often use daily, weekly or venue-specific levels instead, and liquidation clusters on leveraged positions can make sweeps sharper.
Liquidity sweeps on different timeframes
Timeframe changes the noise, not the logic. A 1-minute chart gives more swing levels to mark and faster reclaim closes, with more false signals per day. A daily chart gives cleaner levels but so few events that ten weeks of data says almost nothing. The 5-minute bar in the study is a middle choice, and if you trade a different timeframe the sensible move is to rerun the same marking rules on it.
Sweep trades on a prop futures account
On our accounts, ES, NQ, MES and MNQ are all supported, which covers both markets in this study. Every position has to be closed by 4:45 PM ET on regular days, so a sweep trade here is always a single-session trade with a hard exit at the close. A 50K account allows up to 4 minis or 40 micros, and because 10 micros count as one mini, the micros are the practical way to give a sweep trade a wider stop at a smaller dollar risk. Evaluation and funded accounts are simulated.
Related lesson: Mini and micro futures contracts
Liquidity sweep FAQs
What is a liquidity sweep in simple terms?
A liquidity sweep is when price pushes just past an obvious high or low, triggers the stop orders waiting there, and then closes back inside the level. It only becomes a sweep once that close back inside happens. Until then, it is just a level being broken.
What is the role of liquidity in trading?
Liquidity is what lets an order fill without moving price much. When there are plenty of resting orders near the current price, trades fill close to it. When liquidity is thin, an order has to travel through more prices to fill, which is why moves through stop clusters can be fast.
What is the 2% rule in forex?
The 2% rule is a risk guideline that caps the loss on any single trade at 2% of trading capital. On a $10,000 account that is $200. It is a personal rule of thumb, not a regulation, and some traders use 1% or less.
What is the 3-5-7 rule in trading?
It is an informal risk framework: risk up to 3% on one trade, keep combined open risk under 5%, and aim for winning trades at least 7% larger than losing ones. Definitions vary between sources, especially for the third number. Like the 2% rule, it is a guideline you choose, not a standard.
Does a liquidity sweep always reverse?
No. In this guide's study of 90 ES and NQ level-take events from August 28 to November 4, 2026, only 33 closed the session back inside the level. Shallow sweeps taken after the open did much better than that average, and gap-through opens did much worse.
What is the best timeframe for liquidity sweeps?
No timeframe is best for everyone. Lower timeframes give more events and more noise, while higher timeframes give fewer, cleaner levels. Pick the one you execute on and test the same marking rules there before trading it.
Risk note on liquidity sweep trading
Futures trading involves substantial risk of loss, and leverage means a small move in the underlying can produce a loss larger than you expected, especially when a stop slips in a fast market. The study in this article covers one ten-week period of historical 5-minute data in two index futures, excludes commissions and slippage, and is not a prediction of future results. Evaluation and funded prop accounts are simulated. This article is educational and is not financial advice.


