



TL;DR: Smart money concepts read price through structure, liquidity and imbalance, with entries at zones and stops at clear invalidation. Treat the vocabulary as a chart map, not as proof of what institutions intend. In a 49-session ES and NQ study, 75.6% of fair value gaps were revisited, and most of those filled instead of holding. Upward change of character in the lower half of the prior range worked only 19.4% of the time.
What Smart Money Concepts Mean
Most traders meet smart money concepts as a wall of labels on someone else's chart: order blocks, sweeps, gaps, arrows. The real question is which of those labels should change what you do at the next level.
Smart money concepts, usually shortened to SMC, are a set of labels for reading a price chart on one assumption: large participants need liquidity to fill big orders, and that need leaves footprints you can see in price. The framework asks you to trade alongside that flow rather than against it.
The core of what smart money concepts include fits in five ideas:
- Market structure, the sequence of swing highs and swing lows that defines trend.
- Break of structure and change of character, the events that confirm a trend or warn it may be turning.
- Liquidity, the clusters of resting stop and limit orders sitting beyond obvious highs and lows.
- Order blocks and fair value gaps, the zones where a strong move started and where price may react on a return.
- Premium and discount, the upper and lower halves of a higher timeframe range that tell you whether price is expensive or cheap.
The philosophy is the part to handle carefully. SMC teaching often describes a sweep as "institutions hunting stops" or an order block as "where the banks loaded up." Those are stories about intent, and nobody can see a named institution's orders on a retail chart.
What you can see is behavior at levels. A level many traders can spot collects resting orders. Price often tests it. A sharp move leaves an imbalance that price often returns to. You can trade all of that without needing the intent story to be true, and you will make fewer emotional mistakes if you drop it.
That distinction shows up at the desk. If you believe a sweep is a bank targeting your stop, a failed setup feels personal and the next trade gets bigger. If you treat it as a pattern with a measurable hit rate, a failure is one losing sample in a long series.
Where Smart Money Concepts Came From
Smart money concepts did not appear from nowhere. The ideas stack in three layers, and knowing the layers helps you decide which parts to keep.
The Wyckoff cycle behind smart money
Richard Wyckoff described markets in the early twentieth century as moving through four stages: accumulation, markup, distribution and markdown. Large operators accumulate quietly in a range, mark price up, distribute to latecomers near the top, then mark it down. Swap the vocabulary and that is the SMC cycle of building positions, sweeping liquidity and delivering price to the next pool.
The ICT framework behind smart money concepts
Most of the modern vocabulary comes from the Inner Circle Trader, or ICT, the online name of Michael J. Huddleston. ICT is a full trading framework rather than a single setup, and SMC borrowed most of its building blocks:
- Liquidity first. ICT frames every move as price traveling from one pool of resting orders to the next, so the first question is always where the obvious stops sit.
- Zones from displacement. Order blocks and fair value gaps come from ICT, along with variations such as breaker blocks and mitigation blocks.
- Premium and discount. ICT splits a dealing range at its midpoint and only looks for longs in the lower half and shorts in the upper half, with a preferred retracement band called optimal trade entry.
- A daily cycle. ICT describes a typical day as accumulation, a false move (often a sweep of the overnight or prior session extreme) and then the real move, sometimes called the "power of three."
- Time. ICT puts heavy weight on when a setup forms, using session windows it calls killzones around the London and New York opens.
The time layer is the biggest difference from the SMC most traders learn today. ICT treats the same sweep differently depending on the hour; community SMC usually treats it the same at any time. ICT material is long, detailed and spread across years of videos, which is one reason the simplified version spread faster.
The smart money concepts community version
SMC as most traders meet it today is the simplified community package. It keeps the structure, liquidity and zone vocabulary and drops much of the time-of-day work. Indicators on charting platforms now auto-label swings, gaps and blocks, which made the vocabulary spread fast.
The practical takeaway is that ICT and SMC are the same family. Neither one has a published, independently audited edge over the other. Choose the version you can apply the same way every time, because consistency is what makes a method testable.
Related lesson: ICT trading concepts explained
Smart Money Versus Retail Traders in the Public Data
The phrase "smart money" implies two camps: informed institutions and uninformed retail traders. In futures, regulators do publish data on large traders, and it is worth knowing what that data can and cannot tell you.
The CFTC's Commitments of Traders (COT) reports break down each Tuesday's open interest in markets where 20 or more traders hold positions at or above CFTC reporting levels. The reports are generally released on Friday at 3:30 PM Eastern, using the preceding Tuesday's data.
For financial futures such as equity index contracts, the Traders in Financial Futures report sorts reportable traders into four groups:
- Dealer/Intermediary, usually the sell side of the market.
- Asset Manager/Institutional, such as pension funds and mutual funds.
- Leveraged Funds, mostly hedge funds and money managers.
- Other Reportables, large traders who fit none of the other groups.
Positions below the reporting levels are grouped as nonreportable, which is the closest public proxy for small traders.
Here is the catch for an SMC trader. That data is weekly, aggregated and three days old by the time it is published. The CFTC also does not publish how any individual trader is classified. So no public source tells you which participant pushed a five-minute candle through a swing low at 10:50 AM.
That does not make the smart money versus retail framing useless. Large participants really do care about liquidity, because a big order filled in a thin market moves price against itself. Small traders really do cluster stops in obvious places. The behavior is real. The specific attribution on your chart is a guess, so build rules on the behavior and leave the attribution out.
How the Smart Money Concepts Were Tested on ES and NQ
Most SMC explanations define the terms and stop there. This guide also measures them, so every concept section reports what that concept actually did on real index futures bars.
The study used 5-minute bars from regular trading hours (9:30 AM to 4:00 PM ET) on the continuous front-month E-mini S&P 500 (ES) and E-mini Nasdaq-100 (NQ) futures. It covers 49 completed sessions per market, from August 27 to November 4, 2026, which is 3,820 bars per market. One corrupted bar on October 30, 2026 was dropped, and the series rolls from the September to the December contract inside the window.
Every definition was mechanical, so anyone with the same bars could reproduce the counts:
- Volatility unit: a 20-bar average true range (ATR20). The median ATR20 was 21.9 ticks on ES and 124.45 ticks on NQ, so levels were measured in ATR multiples rather than points.
- Swing high: a bar higher than the 2 bars before it and at least as high as the 2 bars after it, counted only once those 2 later bars closed. Swing lows mirror that.
- Control group: wherever possible, a signal was compared with what any ordinary bar in the same trend state did over the same test.
Two limits matter. This is one roughly ten-week window on two correlated markets, so samples for the rarer events are about 70 trades. And it is a description of what happened, not a forecast. Treat the numbers as a reason to test, not as a rule to trade.
Market Structure in Smart Money Trading

Market structure is the backbone of smart money trading. An uptrend is a sequence of higher swing highs and higher swing lows; a downtrend is lower highs and lower lows. Everything else in SMC is read in the context of that sequence.
In the study, the trend state at any bar was "up" when the last two confirmed swing highs and the last two confirmed swing lows were both rising, "down" when both were falling, and undefined otherwise.
Break of structure
A break of structure (BOS) is the first close through the latest confirmed swing in the direction of the trend. In an uptrend that is a close over the last swing high. SMC teaches it as confirmation that the trend is continuing.
Change of character
A change of character (CHoCH) is the first close through the latest confirmed swing against the trend. In an uptrend that is a close under the last swing low. SMC teaches it as the first warning of a reversal.
The key word is warning. A single change of character only says the latest swing failed. SMC traders usually want it to come after a liquidity sweep, out of a higher timeframe zone, and then be followed by a break of structure in the new direction before treating the trend as turned. Many traders also separate an internal change of character, a break of a small swing inside a larger leg, from a swing change of character on the structure that defines the bigger trend. The internal version fires far more often and means far less.
What smart money structure events did on ES and NQ
In this guide's own 49-session study of ES and NQ 5-minute bars, each event was graded on a simple race: from the event bar's close, did price reach 1 ATR20 in the event's direction before it reached 1 ATR20 the other way, in the same session? The base rate is the same race run from every bar in the same trend state.
| Structure event | Events | Went its own way first | Matched base rate |
|---|---|---|---|
| Break of structure, up | 72 | 56.3% | 47.4% |
| Break of structure, down | 100 | 54.7% | 54.1% |
| Change of character, up | 75 | 38.0% | 45.9% |
| Change of character, down | 77 | 60.0% | 52.6% |
Read the table against the last column, not against 50%.
Upward break of structure beat its base rate by about nine points. Downward break of structure matched its base rate almost exactly, so it added nothing a trader in a downtrend did not already have. Downward change of character, the warning in an uptrend, did better than its base rate. Upward change of character, the "bottom is in" signal, went the wrong way more often than ordinary bars did.
Now the honest caveat. With about 70 resolved events per row, the 95% margin is roughly plus or minus 11 points. Only the upward change of character result sits clearly apart from a coin flip, and even that needs a second window before you build a rule on it. Across all 324 events, 52.4% went their own way first.
The decision rule that follows: a break of structure tells you which way the market has been going. It is not, by itself, a reason to enter. An upward change of character against a falling market deserves more skepticism than SMC courses give it.
Related lesson: Break of structure
Liquidity Pools and Sweeps in Smart Money Trading
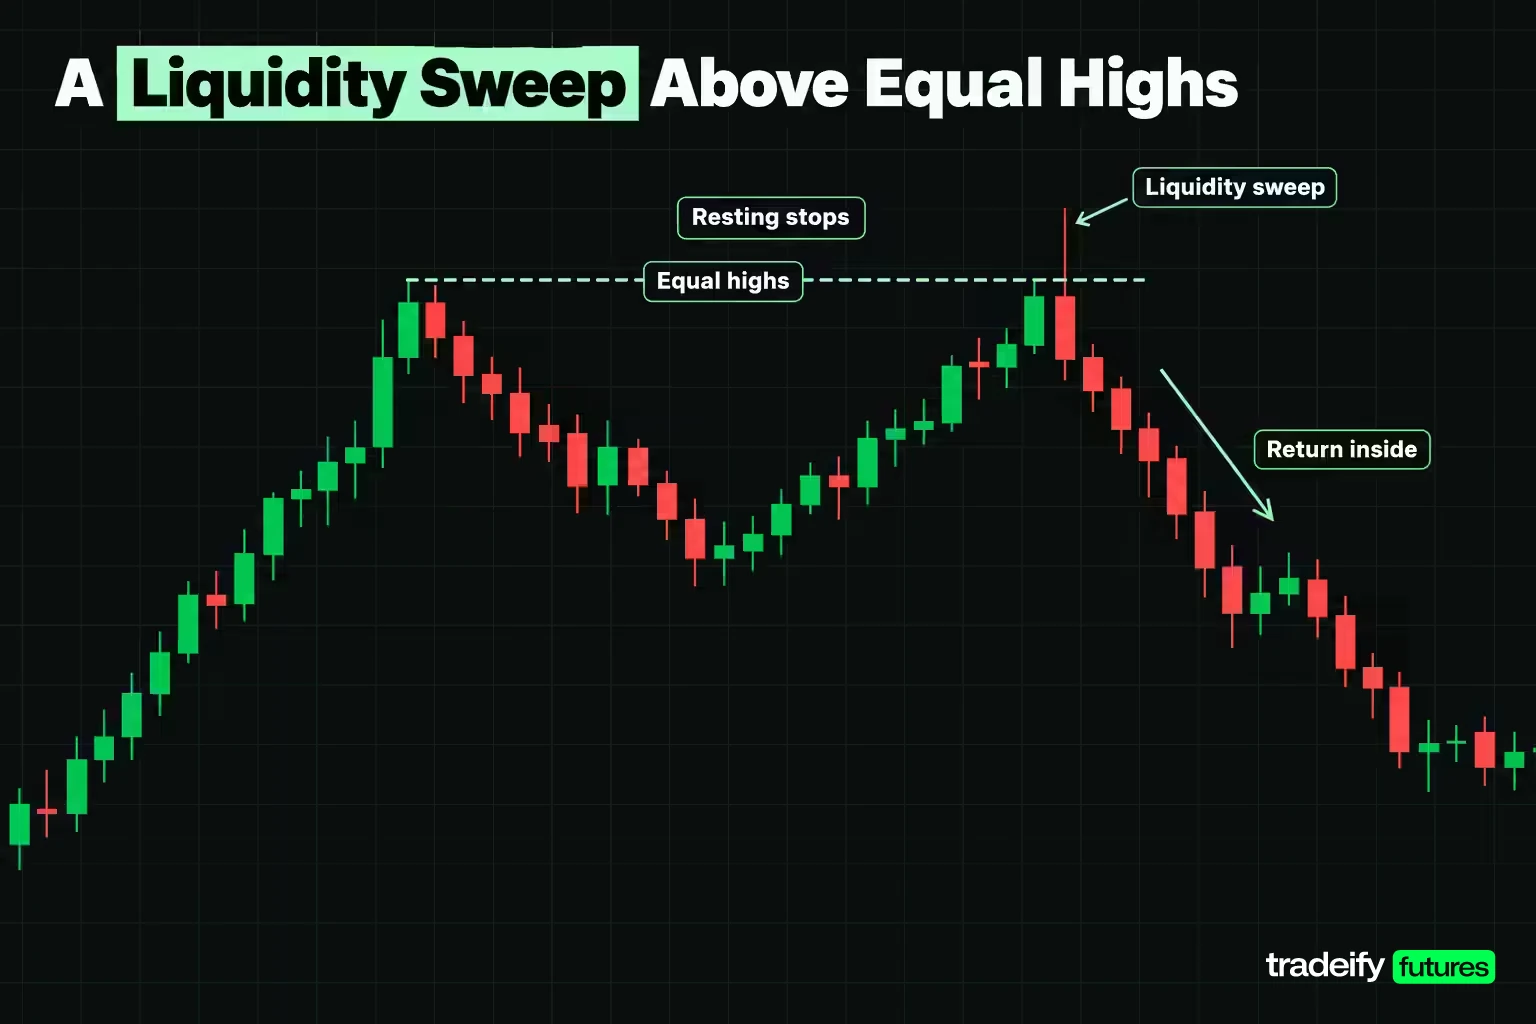
Liquidity in smart money trading means resting orders: stop-loss orders, breakout entries and take-profit limits that sit just beyond levels everyone can see. Prior session highs and lows, equal highs and equal lows, and round numbers are the usual pools.
A liquidity sweep is a move that trades through one of those pools and then comes back. The SMC read is that the sweep filled large orders using the stops as fuel, and the return inside is the tell that the move beyond was not genuine.
Equal highs and lows as smart money liquidity
SMC teaches that equal highs and equal lows are magnets, because two touches at the same price stack more stops there. This guide's own 49-session ES and NQ study tested that against a control group.
An equal level was a new swing within 0.05 ATR20 of an earlier swing of the same type that session. An isolated level had no earlier same-type swing within 0.5 ATR20. A level counted as taken if price traded beyond it later in the same session.
| Level type | Levels | Taken later that session |
|---|---|---|
| Equal highs | 70 | 67.1% |
| Isolated swing highs | 449 | 71.7% |
| Equal lows | 65 | 75.4% |
| Isolated swing lows | 467 | 68.5% |
The magnet effect did not show up. Equal lows were taken a little more often than isolated lows, equal highs a little less often than isolated highs, and all equal levels together ran 71.1% against 70.1% for isolated ones. In this window, almost any intraday swing got taken out about seven times in ten.
That is still useful, just not in the way SMC intends. If seven in ten intraday swings get run, a stop placed one tick past the nearest swing is likely to be hit. Put the stop where your idea is wrong, plus a buffer, not where the nearest swing happens to be.
Prior session highs and lows as liquidity pools
Prior session extremes are the pools most SMC traders watch. In this guide's ES and NQ study, across 96 session pairs, price traded beyond the prior regular-hours high in 45 sessions (46.9%) and closed back under it in 14 of them, or 31.1%. It traded under the prior low in 49 sessions (51.0%) and closed back over it in 22, or 44.9%.
So most breaks of a prior high in this window held into the close. A sweep that reverses is one outcome, not the default. Wait for price to get back inside the range and show you a structure shift before treating a break as a sweep.
Related lesson: Liquidity sweeps and stop runs
Order Blocks as Smart Money Zones
An order block is the last opposing candle before a strong move. In a bullish case it is the last down candle before price displaces higher; in a bearish case, the last up candle before a sharp drop. SMC treats the high-to-low range of that candle as a zone where price may react if it comes back.
The appeal is that it gives you a precise zone and a precise invalidation. The weakness is that "strong move" is a judgement call, so two traders can mark different blocks on the same chart. This guide's own 49-session ES and NQ study removed the judgement with a rule.
A displacement candle had a body at least 1.5 times the prior bar's ATR20. The order block was the last opposite-colour candle within the 3 bars before it. A revisit was any return into the block within 24 bars. The block held if price then moved 1 ATR20 past the block's far side in the original direction before trading through the other edge; it failed if the other edge broke first.
| Order block measure | ES and NQ combined |
|---|---|
| Order blocks found | 154 |
| Revisited within 24 bars | 55.2% |
| Held after a revisit | 48.1% |
Two practical points follow.
First, about 45% of blocks never got a return, so a plan that only enters at the block simply misses many of the moves. That is fine. Missing a move is a cost of having rules, not a mistake.
Second, a revisit held 48.1% of the time, close to a coin flip. An order block is a place to look for a reaction, not a reason to enter. Wait for the lower timeframe to shift structure inside the zone, and keep the stop beyond the far edge of the block.
Related lesson: Order blocks in trading
Fair Value Gaps in Smart Money Concepts
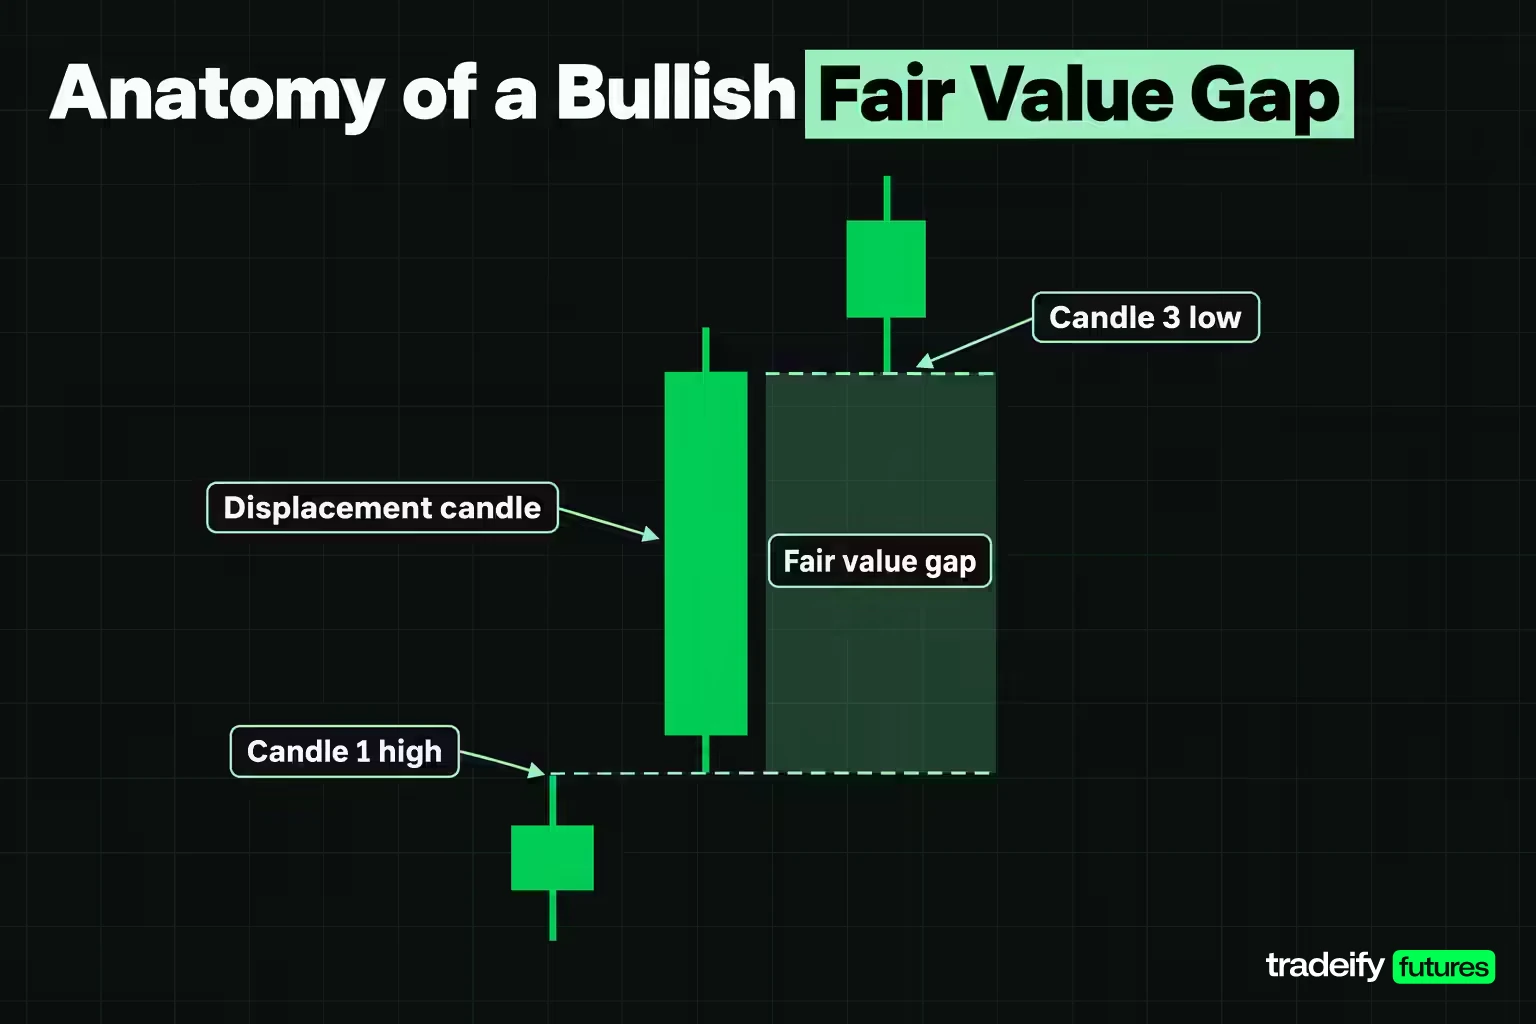
A fair value gap (FVG) is a three-candle pattern where the middle candle moves so fast that the first and third candles do not overlap. In a bullish gap, the third candle's low sits above the first candle's high, and the space between them is the gap. SMC calls it an imbalance and expects price to come back to "rebalance" it.
Displacement is the related idea. A move that leaves a gap is a fast, one-sided move, and SMC uses gaps as evidence that the move had real participation behind it.
What 1,533 smart money fair value gaps did
This guide's own 49-session study of ES and NQ 5-minute bars found 1,533 gaps across both markets. A revisit was a return to the near edge within 12 bars. After a revisit, the gap was filled if price traded through the far edge, or rejected if price first moved 0.5 ATR20 away from the near edge.
| Fair value gap measure | ES | NQ | Combined |
|---|---|---|---|
| Gaps found | 737 | 796 | 1,533 |
| Revisited within 12 bars | 76.0% | 75.3% | 75.6% |
| Filled after revisit | 69.9% | 71.9% | 70.9% |
| Median width in ticks | 6.0 | 33.0 | Not comparable |
| Median width in ATR20 | 0.26 | 0.24 | Similar |
The revisit part of SMC holds up: three gaps in four saw price come back within an hour. The "price will react from the gap" part does not. Of the revisits that resolved, 70.9% filled straight through and only 29.1% rejected first.
That changes how a gap should be used. A fresh gap is a reasonable target, because price tends to return to it. As an entry zone, a gap on its own takes the weaker side of that split, roughly 70 to 30 against holding. If you enter at a gap, you need something else in your favor, such as a sweep and a structure shift that already point your way.
The width rows matter too. A median ES gap of 6.0 ticks and a median NQ gap of 33.0 ticks look like different animals, but both come to about a quarter of a 5-minute ATR. Any fixed point rule copied from one market to the other will be wrong.
Higher Timeframe Bias for Smart Money Setups
Higher timeframe analysis is how smart money traders decide which side to favor before looking for an entry. The idea is top down: the larger chart gives the range and direction, the smaller chart gives the timing.
A common pairing is a daily or 4-hour chart for the range, a 15-minute or 1-hour chart for structure, and a 1-minute to 5-minute chart for the entry. There is no single best timeframe for SMC. The best pair is the one where your stop size and your account's risk limits still work together, which for most intraday futures traders means the entry chart sits in the 1-minute to 5-minute range.
Smart money premium, discount and the dealing range
The dealing range is the higher timeframe range you are trading inside, often the prior session's high and low. Its midpoint splits it into premium (upper half) and discount (lower half). SMC teaches you to look for longs in discount and shorts in premium, so you buy cheap and sell expensive relative to the range.
This guide's own 49-session ES and NQ study checked that idea using the prior regular-hours session as the dealing range:
| Event and location | Resolved events | Went its own way first |
|---|---|---|
| Change of character up, in discount | 36 | 19.4% |
| Change of character up, in premium | 32 | 53.1% |
| Break of structure up, in discount | 26 | 61.5% |
| Break of structure up, in premium | 43 | 55.8% |
| Change of character down, in premium | 29 | 65.5% |
| Change of character down, in discount | 40 | 57.5% |
The surprise sits in the first row. An upward change of character in discount is the textbook SMC long: price is cheap, structure shifts up, you buy. In this window it went the right way first only 7 times in 36.
A plain reading needs no manipulation story. When price trades in the lower half of yesterday's range, it is often there because the day is weak. A small upward shift inside a weak day tends to be a pause, not a turn. Downward change of character in premium, the mirror short, did better at 65.5%, which fits the same reading: fading strength into a falling tape worked, and catching the low did not.
Samples here are small, between 26 and 43 events per row, so treat the split as a warning rather than a law. The lesson that survives: location only helps when the higher timeframe trend agrees with it. Discount in a downtrend is not cheap. It is just lower.
Related lesson: Multiple-timeframe analysis
A Smart Money Concepts Trading Routine
A smart money concepts routine works best as a fixed sequence, where each step can veto the trade. Here is one written so each step has a yes or no answer.
- Mark the dealing range. Note the prior session high, low and midpoint, and the higher timeframe trend in one sentence.
- Name your location. Write premium, discount or middle before you look for a setup. Middle means no trade.
- Wait for a liquidity event. Look for price to take a prior session extreme, an obvious swing or a cluster of equal levels.
- Wait for the return. A sweep is only a sweep once price closes back inside the range it left.
- Confirm with structure. On the entry chart, look for a change of character in the direction of your idea, then a break of structure that confirms it.
- Pick one zone. Use the fair value gap or order block left by the move that shifted structure, not both.
- Set the trade before entry. Entry at the zone, stop beyond the swing that would prove you wrong plus a buffer, first target at the next liquidity pool or the range midpoint.
- Manage by plan. Take partial profit or move the stop only at points you wrote down in advance.
Skip rules for the smart money routine
Two skip rules keep the routine honest. If step 4 never happens, the "sweep" was a breakout and there is no trade. If the zone in step 6 never gets revisited, you missed it, and chasing the move at market is a different trade with a worse stop.
The most common failure is running the steps backwards: seeing a gap, wanting the trade, then hunting for a sweep and a structure shift to justify it. If you notice the zone before the context, slow down and start again from step 1.
One ES Session Read With Smart Money Rules
This walk-through applies the smart money routine to a real E-mini S&P 500 session, November 2, 2026, using 5-minute bars. Every price comes from the bar data. The trades are illustrative and read in hindsight, which is the easiest way to look smart.
The prior session range for the ES example
The prior regular-hours session, October 30, 2026, ran from a low of 7558.25 to a high of 7670.00, so its midpoint was 7614.125. ES opened November 2 at 7649.00, inside that range and in its premium half.
How the ES sweep of the prior high unfolded
On November 2, 2026, ES rallied hard in the first hour. The 10:15, 10:20 and 10:25 AM bars each left a bullish fair value gap, which on its own looks like strong upward displacement. The 10:25 AM bar printed the session high at 7693.75, 23.75 points over the prior session high.
Then the buying stopped. The 10:35 AM bar completed a bearish gap from 7682.50 to 7687.50, 20 ticks wide. A swing low formed at 7677.50 and a lower swing high at 7687.25. The 10:50 AM bar closed at 7671.75, under that swing low, and the 10:55 AM bar closed at 7664.75, the first close back inside the prior session range.
That is the full SMC sequence: price in premium, a sweep of an obvious high, a return inside the range and a structure shift down.
Two illustrative smart money short entries on ES
Both entries in this November 2, 2026 ES example came after price swept the prior session high of 7670.00 and printed 7693.75. An aggressive trader could have sold the revisit of the 10:35 AM gap at 7682.50, with a stop at 7694.50, just over the sweep high. That is 12.00 points of risk, 48 ticks, or $600 on one ES and $60 on one MES. It came before the structure shift, so it was a bet the sweep would hold.
A conservative trader would wait for the 10:55 AM close back inside the range and sell at 7664.75, with a stop at 7688.00, over the lower high. That is 23.25 points of risk, 93 ticks, or $1,162.50 on one ES and $116.25 on one MES.
Both trades used the prior session midpoint of 7614.125 as the first target, 7614.25 to the nearest tick. Price never came back above 7670.25 after 10:55 AM and first traded at that target on the 2:15 PM bar. The aggressive plan made about 5.7R and the conservative plan about 2.2R. The session closed at 7576.25, 12.50 points short of the prior session low.
Debrief of the ES smart money example
Three things from the November 2, 2026 ES session deserve more weight than the result.
First, the three bullish gaps on the 10:15 to 10:25 AM rally into the prior high all failed. A trader who bought the first pullback into them got run over. Gaps marked during a move into an obvious high are exactly where the routine's sweep step should stop you.
Second, a strict displacement rule never fired that day. If displacement means a candle body at least 1.5 times ATR20, the session never qualified: its largest body was 1.21 times ATR20. A trader requiring rule-based displacement would have taken no trade at all, and that would have been a correct application of the rules on a day the setup worked.
Third, a zone you never get is not a loss. The 10:55 AM bearish gap from 7674.00 to 7678.00 was never revisited, so a trader who insisted on entering only there missed the move. That is the rules working, and the urge to chase it at market afterwards is the thing to watch.
Risk and Position Sizing for Smart Money Setups
Risk management in smart money trading starts from the stop, not from the contract count. SMC stops are structural: beyond the sweep extreme, beyond the far edge of the zone, or beyond the swing that would prove the idea wrong. That distance decides your size.
The math is the same for every setup:
- Contracts = dollar risk budget divided by (stop distance in points times dollars per point).
- ES is $50 per index point, with a 0.25-point tick worth $12.50.
- MES is $5 per index point, with a 0.25-point tick worth $1.25, so 10 MES equal 1 ES by contract size.
Here is how that plays out on two illustrative ES shorts from November 2, 2026, with a $500 risk budget. A conservative entry after the sweep reclaimed the range had a 23.25-point stop, $116.25 per MES, so 4 MES risk $465. An aggressive entry at the first bearish gap had a 12.00-point stop, $60 per MES, so 8 MES risk $480. Neither fits even one ES inside $500.
Notice what the tighter stop did. It doubled the contract count, not the safety. Both trades risk almost the same dollars. The difference is that the tighter stop sits closer to noise, and in a 49-session ES and NQ study about seven in ten intraday swing highs and lows were taken out later the same session.
A few rules keep SMC sizing honest:
- Decide the dollar risk before you mark the zone, so a pretty setup cannot talk you into more.
- If the structural stop is too wide for your budget on the micro contract, skip the trade. Do not shrink the stop to fit.
- Count correlated positions together. A short in ES and a short in NQ is close to one bigger bet.
- Set a daily stop in dollars. After two or three losses on the same idea, the market has told you something.
The 3-5-7 rule and smart money sizing
The 3-5-7 rule is an informal rule of thumb, not a regulatory or exchange rule. The common version says risk no more than 3% of the account on one trade, keep total open risk at or under 5%, and aim for winners at least 7%. Versions differ on what the 7 means. For small futures accounts, 3% per trade is often too high, because a normal losing streak of five or six trades would cut the account hard.
Related lesson: Position sizing
Smart Money Concepts Versus Classic Price Action
Smart money concepts and classic price action read the same bars. The difference is mostly vocabulary and the intent story attached to it.
| SMC term | Classic price action equivalent | What SMC adds |
|---|---|---|
| Market structure | Trend of higher highs and lows | Nothing new |
| Break of structure | Breakout of a swing high or low | A name for the continuation event |
| Change of character | First lower low in an uptrend | A name for the warning event |
| Liquidity pool | Stops clustered past support or resistance | Focus on where stops sit |
| Liquidity sweep | Failed breakout or false break | A required return inside the range |
| Order block | Base or last candle before a breakout | A precise zone and invalidation |
| Fair value gap | Gap or imbalance on an intraday chart | A three-candle definition |
| Premium and discount | Buying low in a range, selling high | A fixed midpoint rule |
What SMC adds is real: precise zones, a fixed midpoint and an explicit return-inside rule for false breaks. Those make trades easier to plan and review.
What SMC costs is also real. The vocabulary is dense, and dense vocabularies invite overfitting, where every chart can be explained after the fact. The intent story cannot be checked. And the extra labels create more judgement calls that two traders can disagree about.
If you already trade support, resistance and trend well, SMC is a sharper naming system for what you do. If you are new, learn plain structure and support and resistance first, then add the SMC labels once you can mark swings the same way every time.
Related lesson: Price action trading
Smart Money Concepts Across Futures, Forex and Crypto
Smart money concepts are taught across futures, forex and crypto as if they work the same everywhere. The structural ideas transfer. The details do not.
What transfers:
- Swing structure, sweeps of obvious levels and the return-inside rule are about how traders place orders, and every liquid market has traders placing orders.
- Measuring zones in ATR multiples rather than points. In the ES and NQ study, the median fair value gap was 6.0 ticks on ES and 33.0 ticks on NQ, yet both were about a quarter of ATR20.
What changes:
- Session boundaries. Equity index futures have a clear regular-hours session, so "prior session high" is a clean level. Spot forex trades around the clock across regions, and crypto never closes, so prior-day levels depend on which close you choose.
- Volume. Futures trade on a central exchange, so volume on a futures chart reflects the whole market. Spot forex volume shown on a chart comes from one venue or broker, which makes volume-based confirmation weaker there.
- Gaps and wicks. Thin markets and off-hours trading create more gaps and more spikes through levels, which inflates the number of "sweeps" and "fair value gaps" you will see.
Before you move a rule between markets, re-measure it on that market. A rule that cleared its base rate on ES needs its own test on NQ, on a currency future or on a crypto pair.
How to Practice Smart Money Trading Before Going Live
Practicing smart money trading is mostly about turning judgement calls into written rules and then checking them against enough data. Replay and demo trading help, but only if the rules come first.
A smart money practice plan that produces evidence
- Write the definitions. What counts as a swing, a sweep, displacement, an order block and a fair value gap, in numbers where possible.
- Mark charts in replay. Use bar-by-bar replay so you cannot see the right side of the chart. Log every setup your rules produce, not just the ones you like.
- Collect a real sample. Aim for at least 40 sessions and 30 or more occurrences of each setup before judging it. Even with about 70 events, a win rate carries a 95% margin of roughly plus or minus 11 points.
- Compare against a control. For each setup, check how often the same outcome happens from an ordinary bar in the same conditions. Without that, you are measuring the market's drift.
- Split the results. Separate by direction and by location. In a 49-session ES and NQ test, upward change of character went its own way first 38.0% of the time and downward change of character 60.0%, and averaging them would have hidden it.
- Demo trade the survivors. Only rules that beat their control move to live-speed demo trading, where hesitation and missed fills show up.
Keep a journal entry for every trade: the screenshot before entry, the step of the routine each condition met, and the exit reason. The journal is where you find out whether the method failed or you skipped a step.
Practicing smart money setups on a funded futures account
On our accounts, SMC is an intraday tool: every position has to be closed by 4:45 PM ET, and our funded accounts are simulated. Contract limits set your size, for example 4 minis or 40 micros on a 50K account, so a wide structural stop often means trading micros. WealthCharts, one of our supported platforms, includes Chart Replay for practicing on historical bars before you trade the setup live.
Related lesson: Backtesting a trading strategy
Smart Money Concepts FAQ
Do smart money concepts actually work?
Parts of them hold up and parts do not. In this guide's own 49-session ES and NQ study, fair value gaps were revisited 75.6% of the time, but most revisits filled instead of holding, and order blocks held about half the time. Use SMC to organize levels and invalidation, and test any entry signal before trusting it.
Which timeframe is best for SMC?
No single timeframe is best. Most intraday traders use a daily or 4-hour chart for the range, a 15-minute or 1-hour chart for structure and a 1-minute to 5-minute chart for entries. Pick the entry chart where your structural stop still fits your risk budget.
Is it true that 97% of day traders lose money?
It is true for one well-known sample, not as a universal law. The figure comes from a study by Chague, De-Losso and Giovannetti of people in Brazil who began day trading equity index futures from 2013 to 2015. Of those who kept going for more than 300 days, 97% lost money, and only 1.1% earned more than the Brazilian minimum wage. It describes one market and period, but it is a sober base rate for any method, SMC included.
What is the 3-5-7 rule in trading?
It is an informal rule of thumb: risk at most 3% of the account per trade, keep total open risk at or under 5%, and aim for winners of at least 7%. No regulator or exchange sets it, and versions differ. Many futures traders use a smaller per-trade figure.
Is SMC the same as ICT?
They are the same family. ICT is the original, longer teaching by Michael J. Huddleston, with more time-of-day rules. SMC is the simplified community version that keeps the structure, liquidity and zone vocabulary.
How long does it take to learn smart money concepts?
The vocabulary takes a few weeks. Marking charts the same way every time takes longer, and building a tested rule set takes a few months of replay, journaling and review. Expect some rules to fail testing, which is useful information rather than wasted time.
Trading futures involves substantial risk of loss, and leverage means losses can exceed what you expect on a single trade. The study figures in this guide describe one historical window on ES and NQ and are not a forecast of future results. The trade examples are illustrative and read in hindsight. Evaluation and funded accounts are simulated. Nothing here is investment advice, so test any method on your own data before risking money.


