



TL;DR: Major asset classes are stocks, bonds, cash, real estate, commodities and alternatives; lists of three to seven all exist. From 1928 to 2025, US stocks compounded at 10.0% a year versus 3.4% for T-bills, with far bigger swings. A class is the exposure, not the wrapper, so S&P 500 futures and an index fund are both equities. For a trader, one $500 risk rule can mean $70,000 of crude exposure or $200,000 of gold.
Someone tells you they "trade commodities" or "invest in bonds." That tells you the asset class, and the asset class tells you a lot: what moves the price, how fast it can move and how easily you can get out.
An asset class is a group of investments that share the same basic kind of claim and tend to react to the same forces. Stocks are ownership. Bonds are loans. Cash is a claim on currency at face value. Real estate and commodities are physical things, and alternatives are everything that does not fit those buckets cleanly.
Most explainers stop at that list, because they are written for someone choosing a retirement mix. This guide covers that ground in full: what each class holds, how risk and return compare over 98 years of US data, how diversification and asset allocation work and where they fail. Then it adds the part most guides skip and traders actually feel: what the asset class does to position size when you place a real order.
What an Asset Class Is
An asset class is a category of investments with similar characteristics. The SEC's investor education site, Investor.gov, defines it exactly that way and names three main classes: stocks, bonds and cash. Everything else on a longer list is an argument about where to draw extra lines.
"Similar characteristics" is vague on its own, so here is a working test. A group earns its own asset class when it passes all four:
- A distinct kind of claim. Ownership, a loan, cash, a physical good or a contractual payoff.
- Shared drivers. Members move for broadly the same reasons, such as earnings for stocks or interest rates for bonds.
- Different behavior from other groups. It responds differently enough to the economy that lumping it in with another class would hide risk.
- Similar market treatment. Members are quoted, settled and regulated in comparable ways.
Run candidates through the asset class test and most of them sort themselves. Large-cap stocks fail the first test because they are still ownership claims, so they are a subclass of equities. Technology stocks are a sector, which is a slice of a subclass. High-yield bonds are a subclass of fixed income: still a loan, just to a weaker borrower.
Gold mining shares are the awkward case. A mining share is a stock, yet its price leans heavily on the gold price, so it carries equity risk and commodity risk at the same time. That kind of overlap is exactly why published lists of asset classes disagree.
Asset class versus instrument
The asset class describes the economic exposure. The instrument is the wrapper that delivers it. An S&P 500 index fund, the 500 underlying shares and an S&P 500 futures contract all deliver US large-cap equity exposure, so all three sit in the equity asset class.
The wrapper still matters. It decides the cost, the trading hours, the tax treatment, the regulator and, for futures, how much exposure each unit carries. Two traders can both say they "trade stocks" while one buys 20 shares and the other holds a futures position worth several times their account. Same asset class, very different risk.
Related lesson: How financial markets work
The Major Asset Classes at a Glance
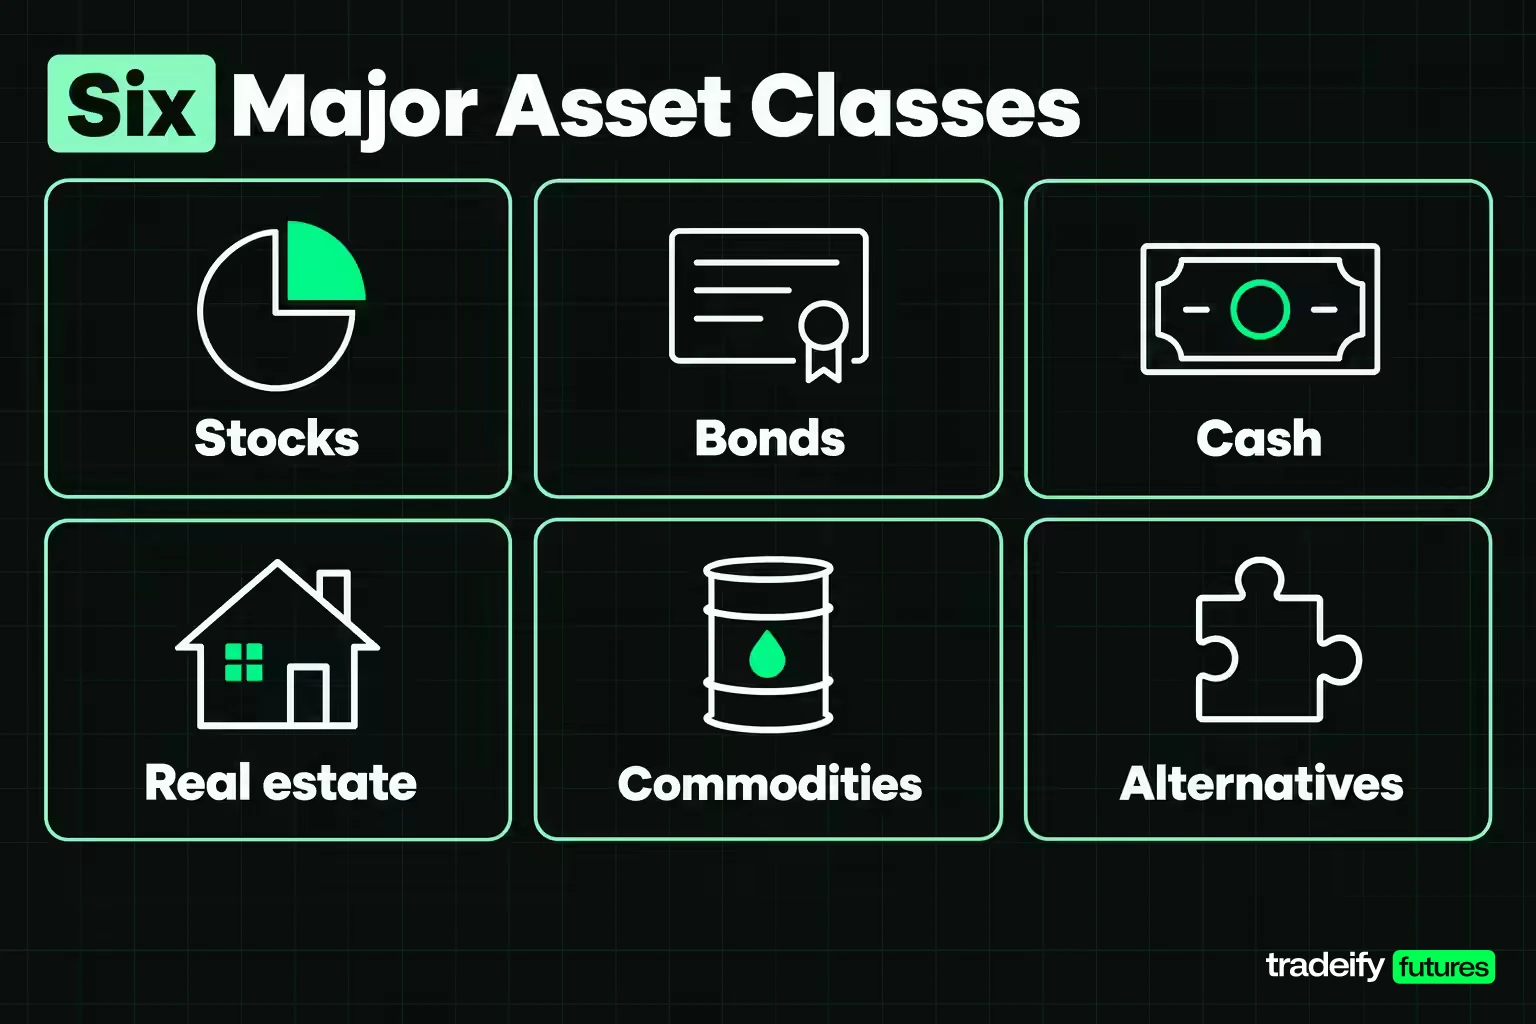
The major asset classes differ by the claim you hold, what moves the price and how easily you can get out. This table puts the common six-bucket version side by side.
| Asset class | What you own | What mostly moves it | Common ways to get exposure | Liquidity |
|---|---|---|---|---|
| Stocks (equities) | A share of a business | Earnings, growth expectations, interest rates, risk appetite | Individual shares, index funds, ETFs, equity index futures | High for large listed companies |
| Bonds (fixed income) | A loan to a government or company | Interest rates, inflation, credit quality | Individual bonds, bond funds, Treasury and other rate futures | High for Treasuries, lower for many corporate and municipal bonds |
| Cash and cash equivalents | Currency or very short-term debt | Central bank policy rates, inflation | Bank deposits, money market funds, Treasury bills | Very high |
| Real estate | Land and buildings, or shares in property owners | Rents, borrowing costs, local supply and demand | Direct property, publicly traded REITs, non-traded REITs, real estate funds | Low for direct property, high for listed REITs |
| Commodities | Physical raw materials or contracts on them | Supply shocks, demand, storage, the US dollar | Commodity futures, commodity funds, physical metal | High for major futures, low for physical holdings |
| Alternatives | Private stakes, complex strategies, scarce or new assets | Strategy-specific; often illiquidity and manager skill | Private equity funds, hedge funds, collectibles, crypto assets | Usually low, crypto aside |
Why asset class lists have three, five or seven entries
There is no official count. The three-class version (stocks, bonds, cash) is the regulator's baseline and covers most of a traditional portfolio. Five-class versions usually add real estate and commodities. Seven-class versions split alternatives into private equity, hedge funds, collectibles and crypto, or add currencies as their own line.
None of these lists is wrong. They answer different questions. A retirement saver needs to know the split between growth assets and safe assets, so three buckets may be enough. A trader choosing a market needs finer lines, because crude oil and a rental property share the label "real assets" and almost nothing else.
Stocks as an Asset Class
Stocks, also called equities, give the holder a share of ownership in a company. Investor.gov lists the reasons people buy them: capital appreciation, dividend payments and the ability to vote shares. You make money in two ways, a rising share price and any dividends the company pays out.
Equities sit at the high-risk, high-expected-return end of the major asset classes because shareholders are paid last. Bondholders, employees and suppliers all have a claim on a company's cash before shareholders do. In exchange, shareholders keep whatever is left after everyone else is paid, which is unlimited on the upside and zero at worst.
What drives the stock asset class
Three forces do most of the work:
- Earnings and growth expectations. A stock price is the market's estimate of future profits, discounted back to today. Change the estimate and the price moves.
- Interest rates. Higher rates make future profits worth less today and make bonds and cash more competitive, which usually weighs on valuations.
- Risk appetite. In a panic, investors sell what they can sell, and liquid stocks are first in line.
Stock subclasses by size, style, region and sector
Inside the equity asset class, subclasses behave differently enough to track separately. Common splits are company size (large, mid and small cap), style (growth and value), region (US, international developed, emerging markets) and sector (technology, health care, energy and so on).
The size split shows up clearly in long-run data. In Aswath Damodaran's NYU Stern dataset of annual US returns from 1928 through 2025, the S&P 500 (with dividends) compounded at 10.0% a year with a standard deviation of 19.4%. The smallest-decile US stocks compounded at 12.0%, but with a standard deviation of 38.0% and a worst year of -53.9% (1937). Higher long-run return came with roughly double the year-to-year swings.
For a trader, the subclass shows up as a different kind of surprise. An index future, a single share and an index fund all carry equity exposure. Only the single share can gap sharply overnight on one company's earnings report, because an index spreads that news across hundreds of companies.
Related lesson: What is a stock
Bonds and the Fixed Income Asset Class
A bond is a loan. Investor.gov describes it as a debt security, similar to an IOU: you lend money to a government, municipality or corporation, and the issuer promises to pay interest (the coupon) and return the face value at maturity. Because the payments are set in advance, the bond asset class is also called fixed income.
The US Treasury sells debt across the maturity range. TreasuryDirect lists Treasury bills from 4 to 52 weeks, Treasury notes of 2, 3, 5, 7 or 10 years that pay interest every six months, and Treasury bonds of 20 or 30 years. Corporate bonds add credit risk on top: the borrower might not pay.
Why bond prices fall when rates rise
Fixed income has one relationship every reader needs: when market interest rates rise, the price of an existing bond falls, and when rates fall, its price rises. A bond paying 4% looks worse once new bonds pay 5%, so its price drops until its total yield matches the market.
Longer bonds move more, because the lower coupon is locked in for longer. Take a $1,000 bond with a 4% coupon paid twice a year (illustrative figures, standard present-value arithmetic):
| Maturity | Price if market yields rise to 5% | Price if market yields fall to 3% |
|---|---|---|
| 2 years | About $981 | About $1,019 |
| 10 years | About $922 | About $1,086 |
| 30 years | About $845 | About $1,197 |
A one-point rise in yields costs the 2-year bond about 2% of its price and the 30-year bond about 15%. That is how a "safe" asset class can still hand you a stock-sized loss. In Damodaran's data, the 10-year Treasury lost 17.8% in 2022, its worst year since 1928, as rates rose quickly.
Credit quality and what bonds pay for
The fixed income asset class splits by issuer and credit quality. US Treasuries carry essentially no default risk, so their risk is rate risk. Corporate bonds pay more to compensate for default risk: in the same 1928 through 2025 data, Baa-rated corporate bonds compounded at 6.6% a year against 4.5% for the 10-year Treasury.
If you hold a bond to maturity and the issuer pays, price swings in between do not change what you collect. If you might need to sell early, or you hold a bond fund that never matures, those swings are your return.
Cash and Cash Equivalents
Cash and cash equivalents are the most liquid asset class: money in bank accounts, money market funds and short-term government debt such as Treasury bills. Investor.gov describes money market funds as funds that invest in liquid, short-term debt, cash and cash equivalents, with relatively low risk and historically lower returns than most other investments.
Cash has almost no price risk. A dollar in a bank account is still a dollar tomorrow, and the FDIC insures deposits up to at least $250,000 per depositor, per ownership category, at each insured bank. The FDIC lists mutual funds, which include money market funds, and Treasury bills among the products it does not cover, even though many people use them like a savings account.
What cash really earns
Cash earns roughly the short-term interest rate, which follows the central bank. As of November 4, 2026, the Federal Reserve's target range for the federal funds rate is 3.75%-4.00%, after a hold on October 28, 2026. Over the long run, 3-month Treasury bills compounded at 3.4% a year from 1928 through 2025 in Damodaran's data and never had a losing year.
The catch is inflation. Cash earning 4% while prices rise 3% gains about 1% in purchasing power, and cash earning less than inflation loses it quietly. As of November 4, 2026, the latest US consumer price index release (September 2026 data) showed prices up 3.7% from a year earlier. Cash is safe in dollars, not always in what the dollars buy.
Cash as a trading position
For a trader, cash is not the absence of a decision. Being flat because no setup qualifies is a position, and often the right one. The pull to "do something" after a quiet hour is where a lot of unplanned trades start. Every one of those trades should have to beat sitting in cash, and most of them do not.
Real Estate as an Asset Class
Real estate as an asset class means land and buildings, owned directly or through companies and funds that own property. Returns come from rent and from changes in property value, and both depend heavily on borrowing costs and local supply and demand.
There are three common routes in:
- Direct ownership. A rental property or a piece of land. You control it, but it is expensive to buy, slow to sell and concentrated in one location.
- REITs. Investor.gov describes a real estate investment trust as a company that owns and typically operates income-producing real estate such as offices, apartments, warehouses, hotels and mortgages. Publicly traded REITs list on an exchange and trade like stocks.
- Non-traded REITs and crowdfunding platforms. These pool money into property deals without a stock exchange listing.
Real estate liquidity and fee traps
The route into real estate changes the risk. Investor.gov warns that non-traded REITs are illiquid, often do not publish a value per share until 18 months after their offering closes, and usually carry sales commissions and upfront fees of approximately 9 to 10 percent of the investment. A publicly traded REIT, by contrast, has a live market price but moves with the stock market day to day.
REITs also create a classification problem. A listed REIT is legally a stock and trades like one, yet its cash flows come from property. Many asset allocation models count it as real estate; some count it as equity. Whichever you choose, count it once.
In Damodaran's dataset, the real estate series compounded at 4.2% a year from 1928 through 2025, with a worst year of -12.0% in 2008. Property is often described as an inflation hedge, but 2008 showed it can still fall hard when credit tightens.
Commodities as an Asset Class
Commodities are physical raw materials: energy (crude oil, natural gas, gasoline), metals (gold, silver, copper, platinum), agriculture (corn, soybeans, wheat) and livestock (cattle, hogs). Investor.gov explains that commodity futures are agreements to buy or sell a set quantity of a commodity at a specified price on a future date, traded on an exchange with centralized clearing.
Most investors and traders never touch the physical goods. They get commodity exposure through futures contracts or through funds that hold futures. That makes the contract terms part of the asset class experience in a way they are not for stocks.
Commodity contract units
Each commodity is quoted in its own physical unit, and the contract size turns that unit into dollars. CME Group's specifications for two common micro contracts:
- Micro Gold futures (MGC): 10 troy ounces per contract, minimum price move $0.10 per ounce, worth $1.00 per contract.
- Micro WTI Crude Oil futures (MCL): 100 barrels per contract, minimum price move $0.01 per barrel, worth $1.00 per contract. The contract is financially settled, so no oil changes hands.
A $1 move in gold is $10 on one MGC contract. A $1 move in crude is $100 on one MCL contract. Two charts can look identical and carry a tenfold difference in dollars per point, so check the unit before you trust the pattern.
What drives commodity prices
Commodity prices are driven by physical supply and demand, which makes them behave differently from financial assets. A pipeline outage, a drought, an OPEC decision or a shipping disruption can move a commodity sharply while stocks and bonds barely react. Storage costs and the shape of the futures curve also matter, because a futures holder has to roll from one contract month to the next.
Gold is the outlier in this asset class. It has little industrial use relative to its price and often trades as a store of value. In Damodaran's data it compounded at 5.6% a year from 1928 through 2025 with a standard deviation of 21.5%, gained 66.2% in 2025 alone and lost 32.6% in 1981. Volatility like that is why gold sits in the commodities class rather than beside cash.
Alternative Investments and Other Asset Classes
Alternative investments are the catch-all asset class: assets that are not publicly traded stocks, bonds or cash. They are grouped by what they are not, so the members have little in common beyond lower liquidity, less transparency and, often, higher fees.
The usual members:
- Private equity and venture capital. Ownership stakes in companies that are not listed on an exchange. Funds can lock up money for years before returning it.
- Hedge funds. Investor.gov describes them as private, unregistered funds that can use borrowing, short-selling and derivatives. They are generally limited to accredited investors or qualified purchasers, typically charge 1-2% of assets plus 15-20% of profits, limit redemptions to four times a year or fewer and often impose a lock-up of one year or more.
- Collectibles. Art, wine, watches, rare coins and cards. There is no continuous quoted market, so the value is whatever the next buyer pays, minus dealer or auction costs.
- Crypto assets. Investor.gov describes crypto assets as assets generated, issued or transferred using a blockchain or similar distributed ledger. Their classification is still unsettled: some lists treat them as a currency, some as a commodity, many as an alternative.
Are currencies a separate asset class
Currencies are the most debated line on any list of asset classes. A balance in dollars or euros is cash, which argues for treating currencies as part of the cash class. But exchange rates are actively traded as a market with their own drivers (interest rate gaps, trade flows, central bank policy), which argues for a separate line.
The market is enormous either way. The Bank for International Settlements' Triennial Survey put global foreign exchange trading at $9.6 trillion per day in April 2025. Traders usually reach currencies through spot forex or through exchange-listed currency futures such as Euro FX.
Exit rules for alternative investments
When an asset class's defining feature is that you cannot easily sell it, the exit plan matters more than the expected return. Before buying any alternative, find out three things: how and when you can get your money back, what that costs, and who decides the price in the meantime. If nobody can answer the first one clearly, that is your answer.
Derivatives and Asset Class Exposure
Derivatives are contracts whose value comes from something else. Investor.gov defines them as financial instruments whose performance is derived, at least in part, from an underlying asset, security or index. Futures, options and swaps are the main types.
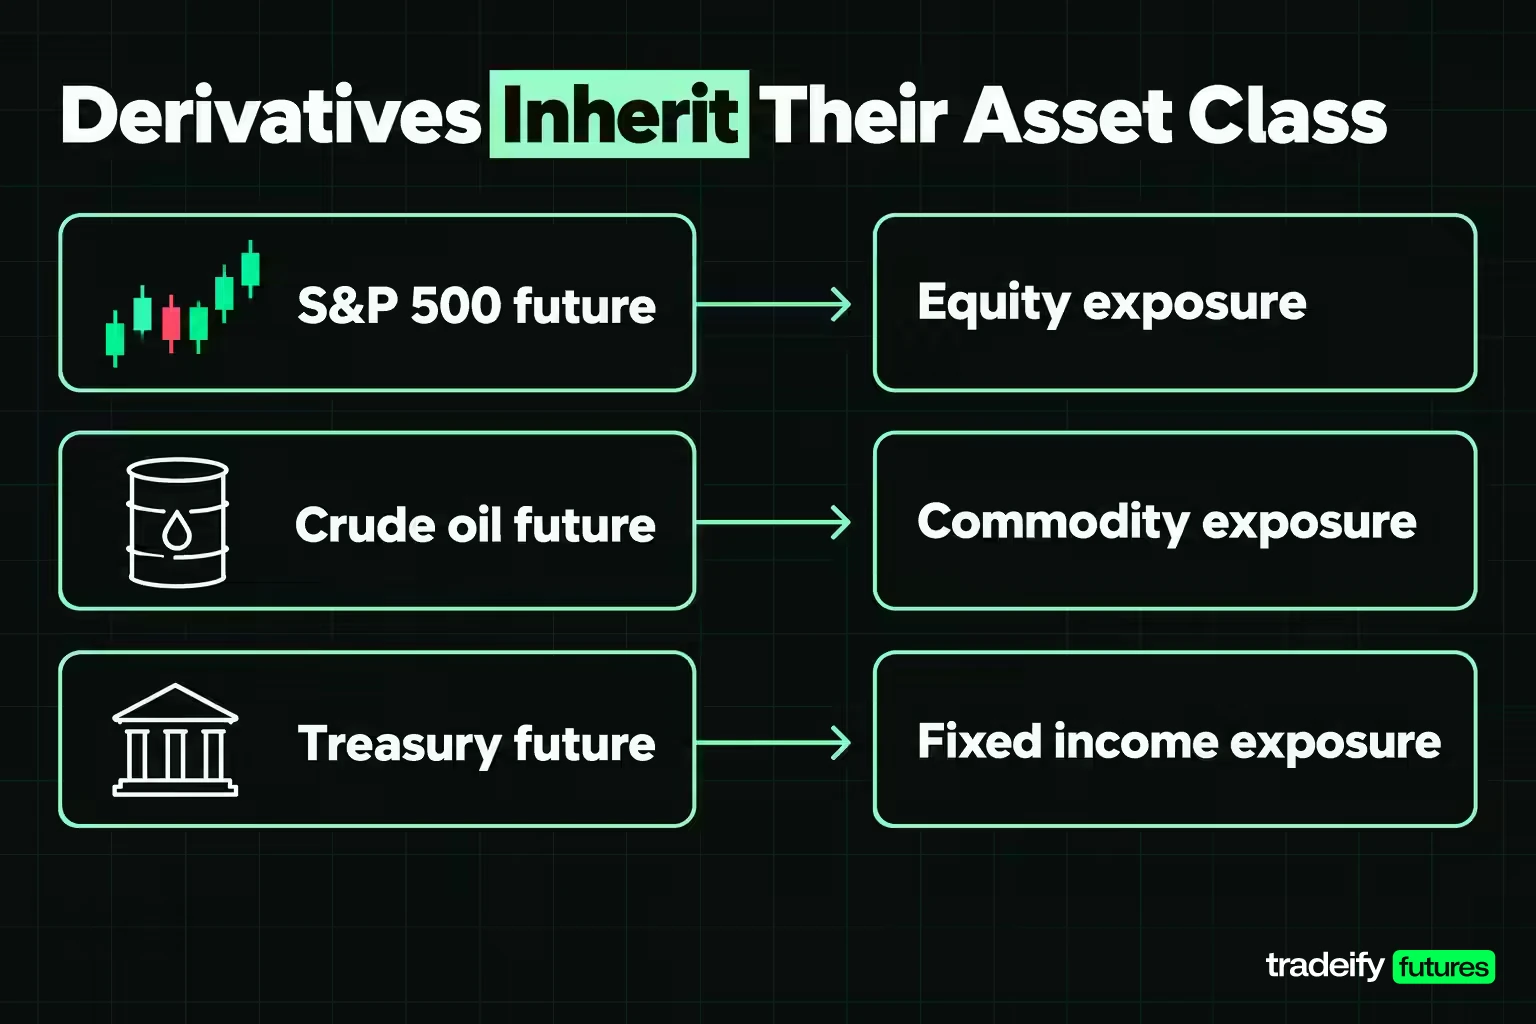
Derivatives are usually not treated as an asset class of their own. A futures contract on the S&P 500 is equity exposure. A crude oil future is commodity exposure. A Treasury future is fixed income exposure. The derivative inherits the asset class of its underlying asset while changing several things around it:
- Exposure per unit. One contract can control many times the cash you put up, so gains and losses are larger than the deposit suggests.
- Expiry. Futures and options expire, so long-term exposure means rolling from one contract to the next.
- Regulator. In the US, the SEC does not regulate commodity futures; the Commodity Futures Trading Commission (CFTC) does.
- Payoff shape. A future gains and loses roughly one for one with the underlying. An option's payoff is lopsided: a buyer's loss is capped at the premium, while a seller's can be large.
The CFTC's futures basics page notes that most participants are hedgers, who use futures to reduce the risk of price changes, while others are speculators who try to profit from them. Both are trading the same asset class through the same contract, for opposite reasons.
Risk and Return Across the Major Asset Classes
Comparing risk and return across the major asset classes works best with one consistent dataset. Aswath Damodaran at NYU Stern publishes annual US returns for several asset classes back to 1928. The figures in this table are computed from his series for 1928 through 2025 (98 years), as published in January 2026.
| Series (1928 through 2025) | Compound annual return | Standard deviation of annual returns | Worst calendar year | Losing years out of 98 | $100 at the start of 1928 grew to |
|---|---|---|---|---|---|
| S&P 500 with dividends | 10.0% | 19.4% | -43.8% (1931) | 26 | $1,157,599 |
| US small caps (smallest decile) | 12.0% | 38.0% | -53.9% (1937) | 34 | $6,462,599 |
| 3-month Treasury bills | 3.4% | 3.0% | +0.03% (2014) | 0 | $2,578 |
| 10-year Treasury bonds | 4.5% | 7.9% | -17.8% (2022) | 20 | $7,753 |
| Baa corporate bonds | 6.6% | 7.7% | -15.7% (1931) | 16 | $53,952 |
| Real estate | 4.2% | 6.2% | -12.0% (2008) | 15 | $5,626 |
| Gold | 5.6% | 21.5% | -32.6% (1981) | 34 | $21,025 |
These figures are nominal, before inflation, taxes and fees, and they cover the US only.
What asset class risk and return history shows
Damodaran's 1928 through 2025 US data show the textbook pattern: the asset classes with the higher long-run return also had the larger swings and deeper bad years. Stocks compounded at roughly three times the T-bill rate, and they also lost money in 26 of 98 years, including a 43.8% loss in 1931.
Three cautions keep the asset class table honest:
- Long-run averages hide long waits. The same 10.0% compound return includes four straight losing years from 1929 through 1932 and three from 2000 through 2002. The average only helps if you can stay invested through the bad stretch.
- Standard deviation is not the whole risk. Gold's 21.5% standard deviation is close to stocks', but its long-run return is about half. Volatility measures the size of swings, not whether you are paid for them.
- One country, one period. These are US results over one long stretch of history. Other markets and future decades can look very different, so treat the table as history, not a forecast.
For a trader, the useful takeaway is relative. An asset class with a 21.5% annual standard deviation will produce far bigger daily moves than one at 3.0%, and that difference has to show up in position size.
Related lesson: What is a return
Diversification Across Asset Classes
Diversification means spreading money across investments so one loss does not sink the whole portfolio. Investor.gov puts it as spreading money among investments "in the hope that if one loses money, the others will make up for those losses." It works across asset classes and within each one: different stocks, sectors, bond issuers and maturities.
The reason diversification works is correlation, the tendency of two assets to move together. In Damodaran's 1928 through 2025 annual data, the correlation between S&P 500 returns and 10-year Treasury returns is about 0.02, essentially unrelated year to year. Stocks and gold come in at about -0.06. Assets that do not move together smooth the ride when combined.
When diversification across asset classes fails
Correlations are averages, and they change. Two years in the same data show both sides:
- 2008: the S&P 500 lost 36.55%, real estate lost 12.00% and Baa corporate bonds lost 3.44%, while 10-year Treasuries gained 20.10% and gold gained 4.32%. Diversification into Treasuries did its job.
- 2022: the S&P 500 lost 18.04% and 10-year Treasuries lost 17.83% in the same year, as rising rates hit both. Baa corporate bonds lost 15.23%. Only T-bills (+2.09%) and the real estate series held up.
The 2022 row is the lesson. Stocks and bonds both fall when the shock is rising interest rates, so a portfolio that relied only on that pairing had less protection than its long-run correlation suggested. Diversification reduces risk; it does not remove it, and it does not protect against loss in a broad decline.
Diversification also fails quietly through overlap. Two funds with different names can hold many of the same stocks. Investor.gov's advice is to check each fund's top holdings to make sure they actually differ.
Related lesson: Correlation risk
Asset Allocation Between Asset Classes
Asset allocation is the decision about how much of your money goes into each asset class. Investor.gov describes it as dividing investments among assets such as stocks, bonds and cash, and calls it a personal decision that depends on two things: your time horizon and your risk tolerance.
- Time horizon is how long until you need the money. A longer horizon gives more time to recover from a bad year in a volatile asset class.
- Risk tolerance is your ability and willingness to lose some or all of an investment in exchange for potentially higher returns. Ability is financial; willingness is emotional. Both count.
The asset allocation decision sets how the whole portfolio reacts to a recession, an inflation spike or a rate shock, before any individual stock or fund is picked.
Rebalancing an asset allocation
Allocations drift. Investor.gov's example: you start with 60% in stocks and a strong market pushes that to 80%. Your portfolio now carries more stock risk than you chose, without a single new decision.
Rebalancing brings the mix back by selling some of what rose or adding new money to what lagged. Investor.gov notes two common approaches: rebalance on a calendar, such as every six or 12 months, or rebalance when an asset class moves more than a set percentage away from its target. It also notes rebalancing tends to work best done relatively infrequently.
Rebalancing feels wrong in the moment because it means trimming the winner and adding to the laggard. That discomfort is the point. A rule written in advance stops a good year from quietly rewriting the risk you chose.
Building a Portfolio From Asset Classes
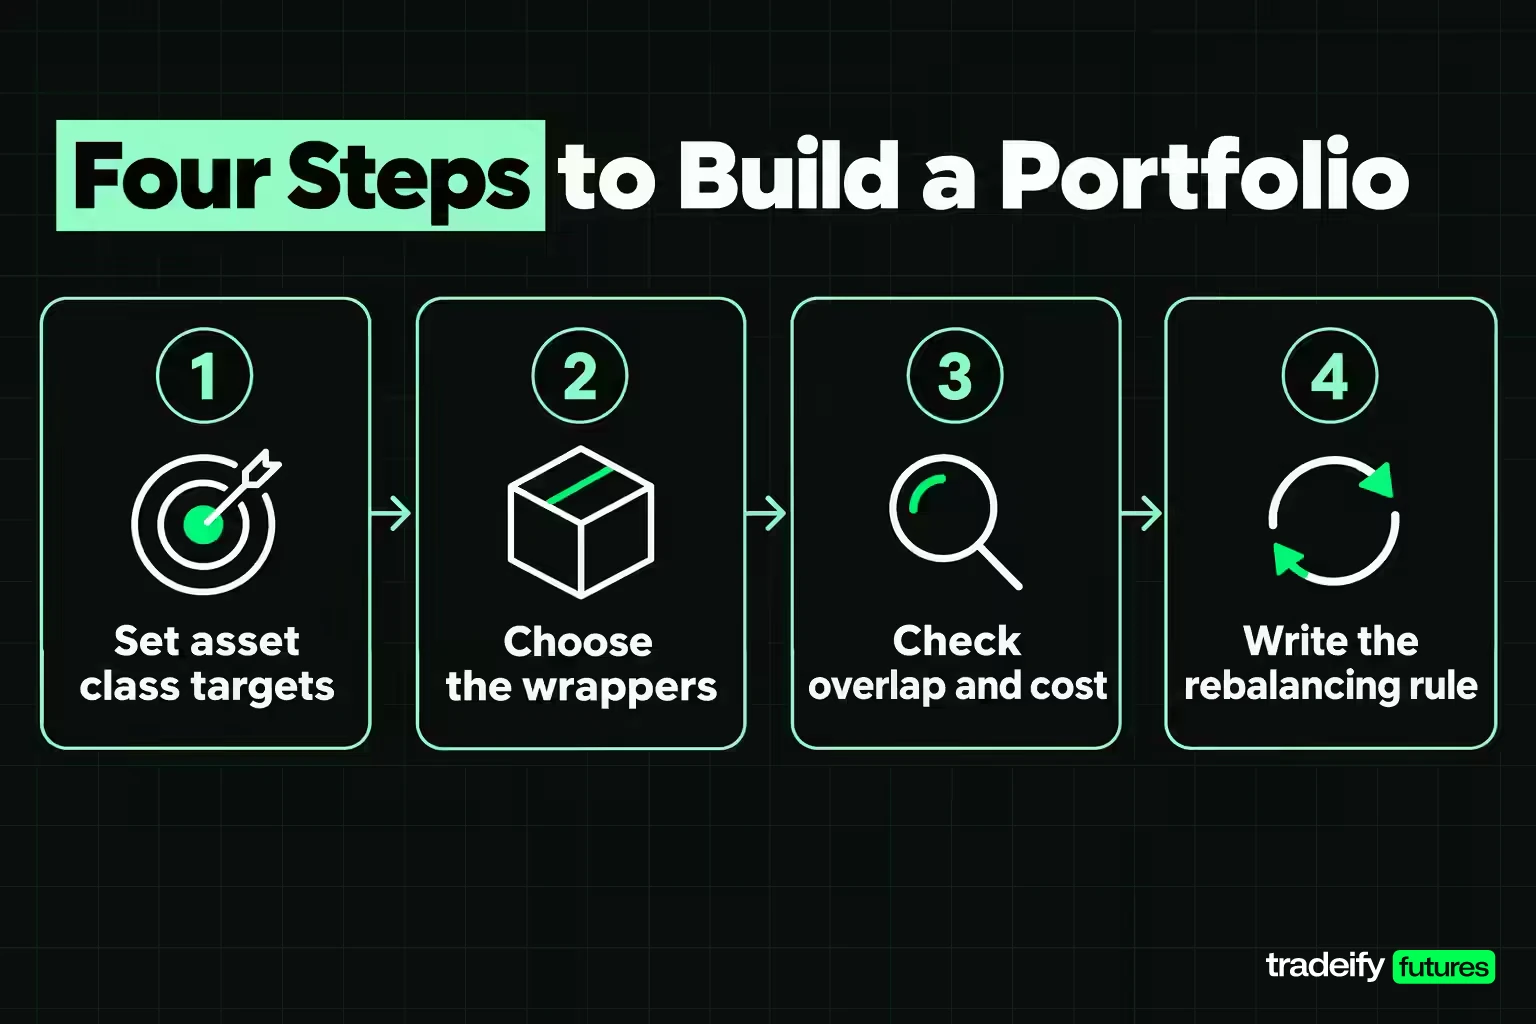
Portfolio construction turns an asset allocation into actual holdings. A target of "60% stocks, 30% bonds, 10% cash" still leaves you to choose which stocks, which bonds, in what wrappers and at what cost.
A practical build usually follows four steps:
- Set the asset class targets. Decide the percentage for each class from your time horizon and risk tolerance before picking any product.
- Choose the wrappers. Broad index funds and ETFs can cover a whole asset class in one holding. Investor.gov notes that funds make it easy to own small pieces of many investments, but that a narrowly focused fund may not diversify you at all.
- Check overlap and cost. Compare the top holdings of funds that claim to be different, and compare fees, because cost compounds just like returns.
- Write the rebalancing rule. Decide in advance whether you rebalance on a date or a threshold.
Core and satellite portfolio construction
Many investors build a broad, low-cost core across the main asset classes and keep a smaller satellite for specific ideas: a sector, a commodity, an alternative. The satellite can be wrong without breaking the plan, because the core carries the long-term goal.
Target-date funds are the packaged version. Investor.gov notes that their adviser rebalances the asset allocation over time, typically becoming more conservative as the target date nears.
Where a trading account fits in a portfolio
A short-term trading account is a different job from a long-term portfolio. The portfolio answers "what should I hold for years?" The trading account answers "what will I risk on this trade today?" Keeping them separate, with a fixed amount of risk capital for trading, stops a bad trading week from quietly changing your retirement allocation.
Related lesson: Trading vs investing
How the Asset Class Changes Your Position Size
For a trader, the asset class question turns into a sizing question. Each class is quoted in its own units (index points, dollars per ounce, dollars per barrel), and each futures contract converts those units into dollars at a different rate. Your stop is measured in those units, so the same risk rule produces very different positions.
The contract terms used here come from CME Group's specifications:
- Micro E-mini S&P 500 (MES): $5 times the S&P 500 index, so $5 per index point; minimum move 0.25 points, worth $1.25.
- Micro Gold (MGC): 10 troy ounces, so $10 per $1 move in gold; minimum move $0.10, worth $1.00.
- Micro WTI Crude Oil (MCL): 100 barrels, so $100 per $1 move in crude; minimum move $0.01, worth $1.00.
One risk rule across three asset classes
Imagine a trader with a $50,000 account who risks 1% per trade, or $500. Prices are round illustrative levels, not quotes: the S&P 500 at 7,000, gold at $4,000 an ounce and crude at $70 a barrel. At those levels one MES controls $35,000 of index exposure, one MGC $40,000 of gold and one MCL $7,000 of oil.
| Contract and stop | Risk per contract | Contracts for $500 | Actual risk | Notional exposure | Exposure as a multiple of the account |
|---|---|---|---|---|---|
| MES, 20-point stop | $100 | 5 | $500 | $175,000 | 3.5x |
| MGC, $10 stop | $100 | 5 | $500 | $200,000 | 4.0x |
| MCL, $0.50 stop | $50 | 10 | $500 | $70,000 | 1.4x |
The dollar risk is identical in all three asset classes. The exposure ranges from $70,000 to $200,000. Nothing is wrong with the sizing. The difference comes from how tight each stop sits relative to price, and that is easy to miss when you only look at the dollar stop.
Notional exposure from risk and stop distance
One identity explains why the same $500 risk budget can buy $70,000 of crude oil exposure in one trade and $200,000 of gold exposure in another:
Notional exposure = dollar risk ÷ stop distance as a percentage of price.
Check it with the same round prices (S&P 500 at 7,000, gold at $4,000, crude at $70). A 20-point stop on one MES on a 7,000 index is about 0.29% of price, and $500 ÷ 0.0029 is about $175,000. A $10 stop on $4,000 gold is 0.25%, and $500 ÷ 0.0025 is $200,000. A $0.50 stop on $70 crude is about 0.71%, and $500 ÷ 0.0071 is about $70,000.
It also runs the other way. Risk 1% with a 1% stop and you hold exactly 1x your account. Risk 1% with a 0.25% stop and you hold 4x, whether you meant to or not. That is not an argument for wider stops. It is an argument for knowing what you hold, because exposure is what makes a normal move in a volatile asset class feel violent.
Where minimum contract size stops a small account
Futures come in whole contracts, so the smallest position sets a floor. Take a $5,000 account risking 1%, or $50, with the same stops:
| Contract and stop | Risk for one contract | Contracts for $50 | Result |
|---|---|---|---|
| MES, 20-point stop | $100 | 0 | Not tradable at this stop; a 10-point stop ($50) allows 1 |
| MGC, $10 stop | $100 | 0 | Not tradable at this account size and stop |
| MCL, $0.50 stop | $50 | 1 | Tradable, using the full $50 budget |
When one contract risks more than your budget, the honest choices are to skip the trade, use a smaller contract if one exists, or find a setup with a tighter logical stop. Raising the budget to fit the contract is how a risk plan stops being one.
Related lesson: Position sizing futures contracts
Choosing Which Asset Class to Trade First
Most new traders pick an asset class because someone online made money in it. A better filter takes a few minutes and four honest answers:
- Can you size it? Write down the dollar value of one minimum price move on the smallest available position, then the dollar risk of that position at your normal stop. If one minimum position exceeds your risk budget, this class is not your first.
- Can you exit it? Check the bid-ask spread and depth at the hours you will actually trade, not when the market is busiest.
- Can you name one driver? If you cannot say in one sentence what moves the price (earnings, rates, inventories, a central bank), you are trading a chart rather than an idea.
- Are you allowed to trade it? Broker permissions, exchange data subscriptions and the rules of any evaluation or funded program all limit which asset classes are open to you. Check the current rules rather than assume.
Four yeses give you a starting asset class. Any "no" is your next research task, not a reason to force the trade. Missing one answer does not make the market a bad one. It makes it a market you are not ready to size yet.
Related lesson: What is liquidity
Asset classes in a simulated futures prop account
On our accounts, you trade CME Group futures, which cover several asset classes through one product type: equity index (ES, NQ, YM, RTY and their micros), energy (CL, NG), metals (GC, SI, HG, PL, PA, MGC), currencies (6E, 6B, 6J, 6A, 6C, 6S), grains and livestock, plus EUREX index and Euro-Bund futures on Tradovate accounts. We don't offer cash stocks, options, spot forex, crypto derivatives or US Treasury futures. Our evaluation and funded accounts are simulated, positions are sized by contract limits (a 50K account allows 4 minis or 40 micros), every position is closed by 4:45 PM ET, and opposite positions within one Product Group, such as long ES and short NQ, are prohibited.
Common Asset Class Mistakes
These are the asset class errors that show up most often, in portfolios and in trading accounts.
| The mistake | What it looks like | The correction |
|---|---|---|
| Treating a subclass as a class | Calling small caps or high-yield bonds a separate asset class | They are subdivisions of equities and fixed income and share their parent's main drivers |
| Classifying by wrapper | Calling ETFs or futures an asset class | Classify by what the instrument holds or tracks |
| Confusing exposure with risk | Assuming $200,000 of notional means $200,000 at stake | Dollar risk comes from size times stop distance; notional comes from price times quantity |
| Assuming correlation is fixed | Expecting bonds to offset stocks every year | Correlations change; in 2022 stocks and Treasuries fell together |
| Counting one asset twice | Holding REITs as both "equity" and "real estate" | Assign each holding to one class in your allocation |
| Class hopping after a loss | Switching from index futures to crude the same day after a bad session | The class was rarely the problem; size and process usually were |
| Ignoring minimum size | Planning a trade before checking one contract's dollar risk | Check the smallest position first, then plan the trade |
| Using an allocation as a trade plan | Applying a 60/40 split to day-trade sizing | Allocation is what to hold for years; sizing is what to risk today |
Related lesson: What is notional value
Frequently Asked Questions About Asset Classes
What are the different asset classes?
The usual list is stocks, bonds, cash and cash equivalents, real estate, commodities and alternative investments. Investor.gov names stocks, bonds and cash as the three main asset classes. Longer lists split alternatives into private equity, hedge funds, collectibles and crypto.
How many major asset classes are there?
There is no official number, and three, five, six and seven are all common. The three traditional classes (stocks, bonds and cash) appear on every version. The rest depends on whether real estate, commodities and alternatives get their own lines.
What are the 5 main asset classes?
A common five-class version is stocks, bonds, cash and cash equivalents, real estate and commodities. Some lists swap commodities for a broader alternatives bucket. Either way, stocks, bonds and cash stay on the list.
What are the 7 types of investments?
A typical seven-item list is stocks, bonds, cash equivalents, real estate, commodities, mutual funds or ETFs, and alternatives such as crypto or private equity. Funds and ETFs are wrappers rather than an asset class, so classify each fund by what it holds.
What is the 7 5 3 1 rule in investing?
The 7-5-3-1 rule is an informal habit framework for monthly mutual fund investing, popular with Indian fund companies. It means investing for at least 7 years, spreading across 5 fund categories, expecting 3 emotional phases (disappointment, irritation, panic) and raising contributions once a year. It is a behavioral guideline, not a regulation or a return promise.
What do equity, bonds and commodities mean?
Equity is ownership in a company, usually held as shares. Bonds are loans to a government or company that pay interest and return the face value at maturity. Commodities are physical raw materials such as oil, gold and wheat, usually traded through futures contracts.
Which asset class is the least risky?
Cash and short-term government debt such as Treasury bills carry the least price risk. In Damodaran's 1928 through 2025 US data, 3-month T-bills never had a losing year. Least risky is not the same as safest after inflation, because cash earning less than inflation loses purchasing power.
Is gold an asset class?
Gold is usually treated as part of the commodities asset class, in the precious metals group. Some lists give it its own line because it behaves more like a store of value than an industrial input. Its swings are large either way: Damodaran's data show a 66.2% gain in 2025 and a 32.6% loss in 1981.
Are ETFs an asset class?
No. An ETF is a fund structure that can hold any asset class. A bond ETF is fixed income, a gold ETF is commodity exposure and an S&P 500 ETF is equity, so classify the ETF by its holdings.
Is crypto an asset class?
Crypto is usually treated as part of the alternative investments asset class, though its classification is still debated. Investor.gov describes crypto assets as assets issued or transferred using a blockchain or similar ledger. Their prices can swing sharply, so size any crypto position as a high-risk holding.
This guide is educational, not investment or trading advice: futures, commodities, crypto and other leveraged products can lose more than you expect, diversification does not protect against loss in a declining market, and evaluation and funded trading accounts are simulated.


