



TL;DR: Trading vs investing comes down to what pays you, either repeated short-term price decisions or owning an asset for years. Investing's main risk is sitting through drawdowns, such as the S&P 500's 43.8% loss in 1931. Trading's main risk is cost and oversizing, and at 1:1 with a $6 round turn you need a 50.6% win rate just to break even. Pick the approach that fits your hours, then write the risk limit before the first trade.
You have some money, a few spare hours a week, and two very different ways to put both to work. Most comparisons of trading and investing frame the choice as fast versus slow. That is true, and it is the least useful thing about them.
Time horizon is a symptom. What really separates the two is what pays you, how many decisions you make, and what you have to clear before there is any profit at all. Once those three are clear, the choice stops being a question of identity ("am I a trader?") and becomes a question of fit: which job can you actually do with the money, hours and temperament you have.
This guide compares both approaches on definitions, time horizon, strategies, risk, costs, capital and personality, with worked numbers for each. It ends with five questions to help you choose, and with what changes when the money at risk sits under an account's drawdown rule rather than in your savings.
Trading vs Investing Defined
Trading vs investing is a comparison between two ways of using the same markets for different jobs.
- Investing means buying an asset, such as a stock, a bond or a fund, and holding it for years because you expect it to grow in value or pay income while you own it. Your return comes from the asset doing well, not from your timing.
- Trading means opening and closing positions over a shorter window, from seconds to weeks, to profit from price moves. Your return comes from a process repeated often enough to overcome the cost of running it.
What an investor is paid for
An investor buys a claim on something productive. Investor.gov describes a stock as a share of ownership in a company, so a stockholder can benefit from the company's growth through price appreciation and dividends. A bond is a loan with a payment schedule, and a fund is a basket of those claims.
That is why an investor can sit through a bad stretch. If the business behind the share is still growing, a price recovery is a reasonable expectation, and nothing forces a decision this week.
What a trader is paid for
A trader owns the position only for the life of the trade. The return comes from being on the right side of a price move and from keeping the loss small when the move goes the other way.
Every trade is a full round trip with a cost attached. Whether they think of it this way or not, a trader runs a small business with a per-trade cost, a hit rate and an average win and loss.
The difference between an investor and a trader
The simplest way to tell them apart is to ask what each one does when price falls 10%. An investor checks whether the reason for owning the asset still holds. A trader checks whether price has reached the level where the trade idea was wrong, and if it has, exits. Same move, two different decisions, because they are being paid for different things.
Neither is the advanced version of the other. They are different jobs with different scoreboards.
Related lesson: What trading is
Key Differences Between Trading and Investing
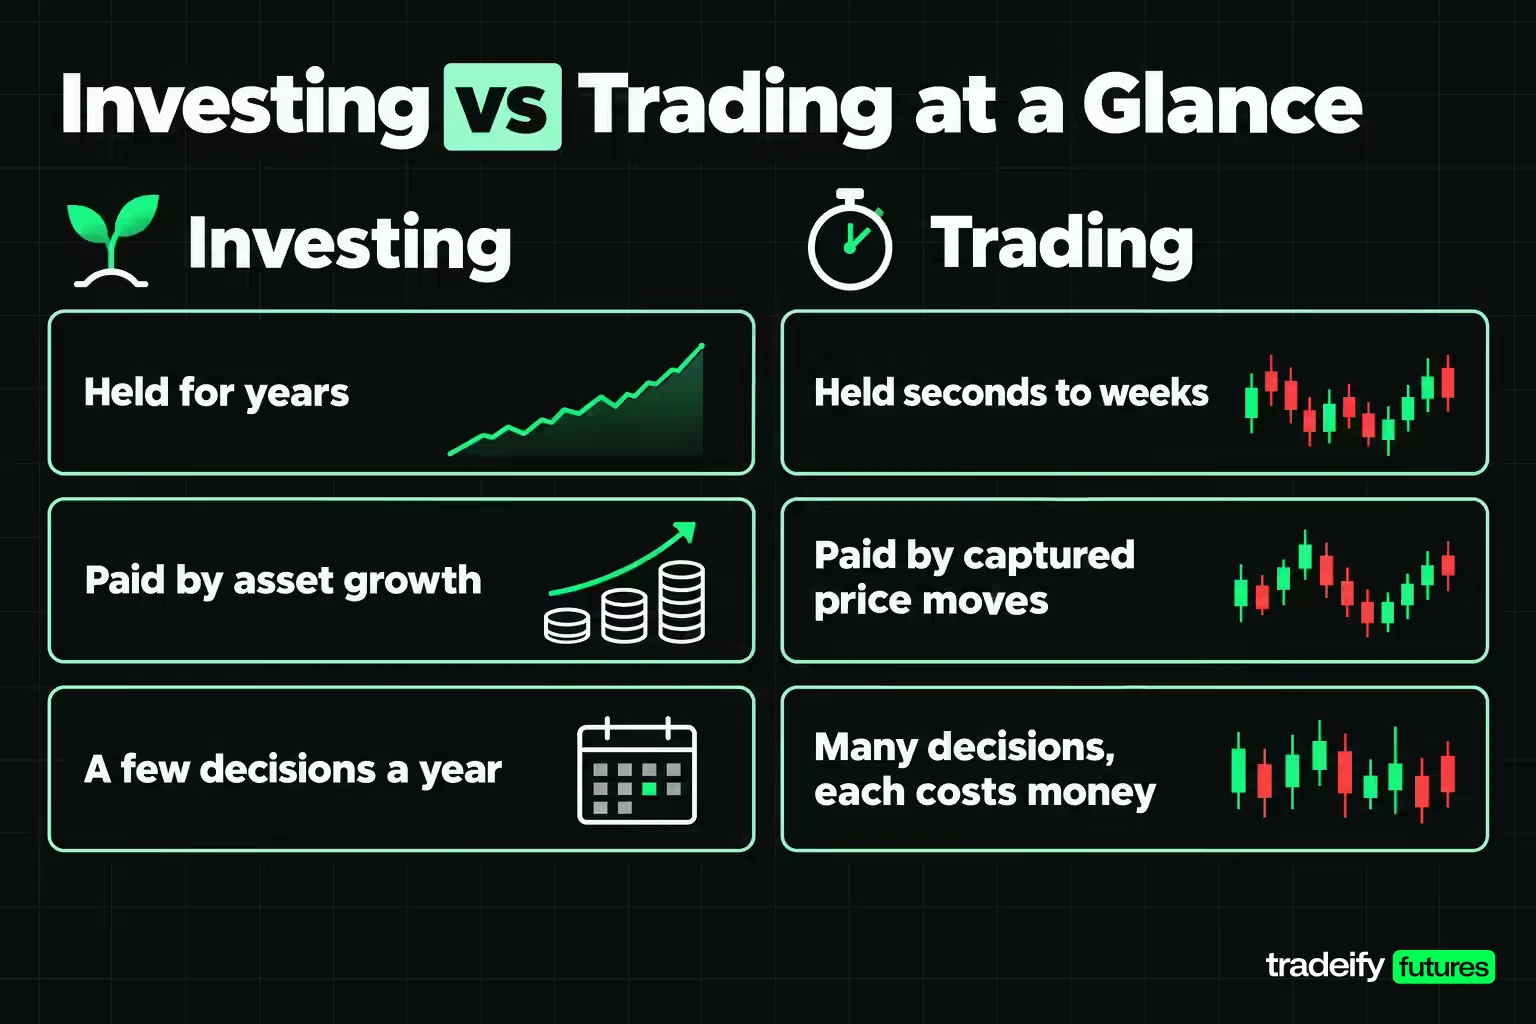
The key differences between trading and investing show up in what you own, how often you decide, how you control risk and how you keep score. The table sets them side by side.
| Dimension | Investing | Trading |
|---|---|---|
| What you hold | A claim on an asset, kept for years | A position open for a defined window |
| Where the return comes from | Asset growth, dividends and interest | Price moves you capture, minus costs |
| Typical holding period | Years to decades | Seconds to weeks |
| Number of decisions | A few per year, plus rebalancing | Many, and each one costs money |
| Main analysis | Business fundamentals and valuation | Price action, levels, volume and timing |
| Main costs | Fund fees, spreads, taxes on sales | Commissions, exchange fees, spreads, slippage, data |
| How risk is controlled | Diversification and time | Position size and a defined exit price |
| What usually ends the account | Panic selling, concentration, high fees | Oversizing, no stop, cost drag, revenge trading |
| The scoreboard | Total return against a benchmark | Expectancy per trade over a large sample |
| Main skill | Choosing what to own and staying invested | Defining risk and repeating a process |
Read the table again and notice which rows decide outcomes. It is not the holding period. It is the cost row and the scoreboard row, because those two turn a trading style into an arithmetic problem and an investing plan into a patience problem.
Market price versus business value
Investors and traders look at the same chart and see different things. An investor mostly cares about the business behind the price: revenue, earnings, debt, competitive position and what the company might be worth in five years. Price matters mainly as the cost of buying that future.
A trader mostly cares about the price itself: where buyers and sellers have recently agreed, where they stopped agreeing, and how fast price is moving. A great company can be a poor trade this week, and a weak company can be a clean trade for a day. Mixing the two lenses is a common beginner mistake, such as holding a losing trade "because it's a good company."
Time Horizon in Trading and Investing
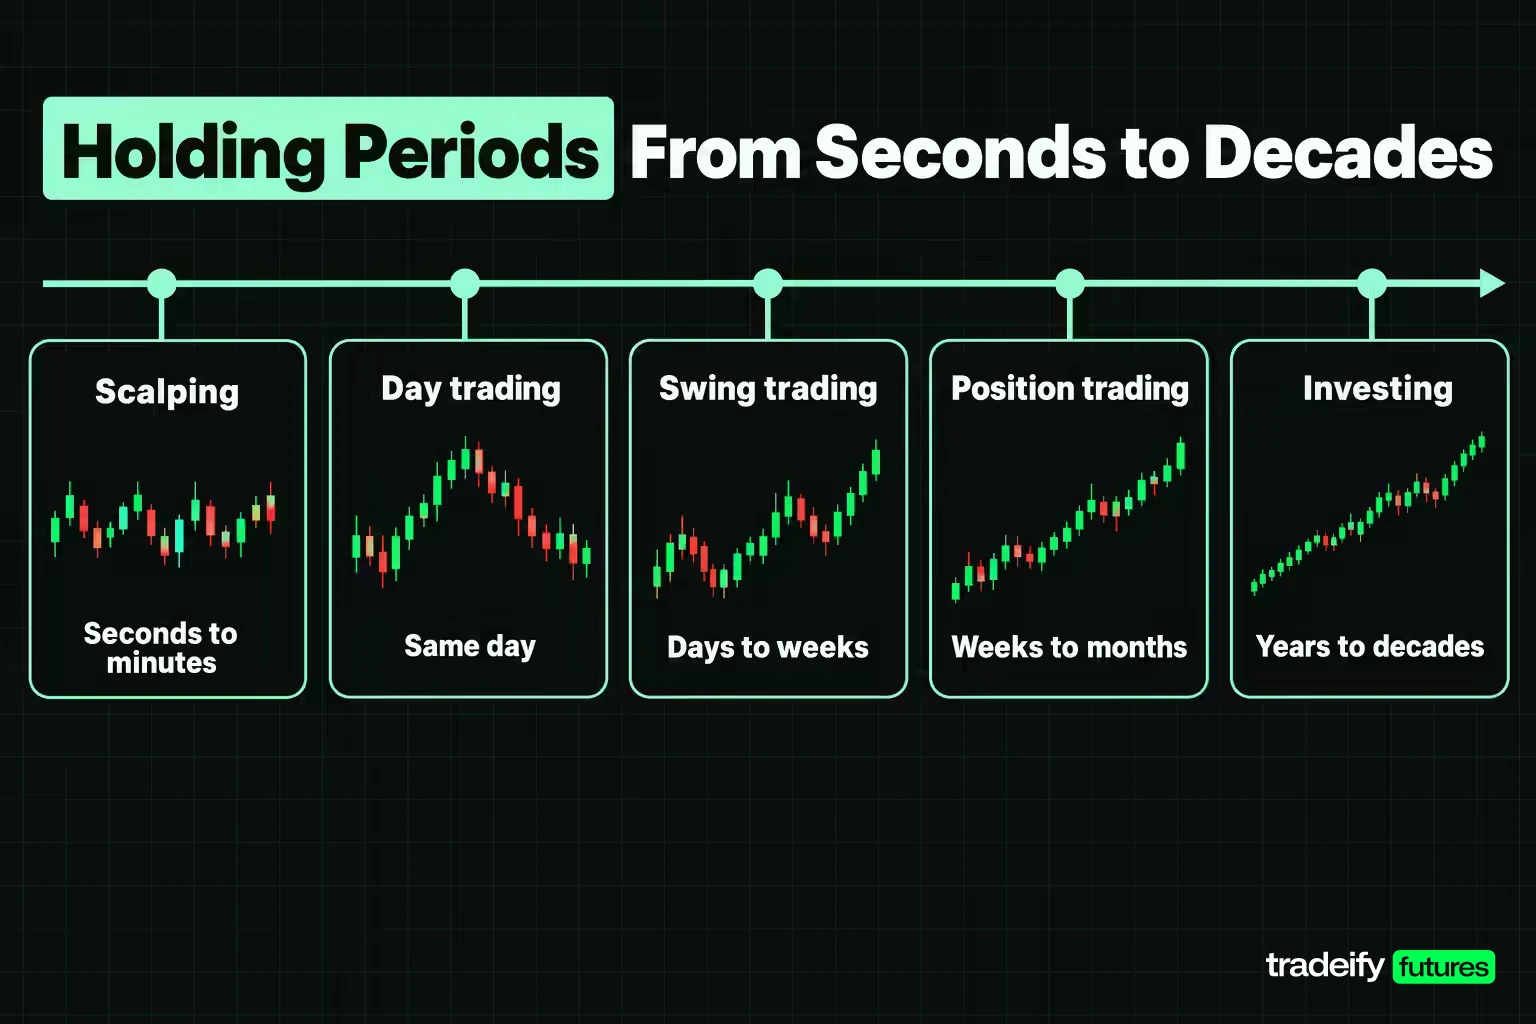
Time horizon in trading and investing ranges from seconds to decades, and it changes which risks matter.
| Approach | Typical holding period | What the horizon is for |
|---|---|---|
| Scalping | Seconds to minutes | Capturing small moves many times a session |
| Day trading | Minutes to hours, closed the same day | Intraday moves with no overnight exposure |
| Swing trading | Days to a few weeks | Multi-day swings, with overnight and weekend gaps |
| Position trading | Weeks to months | Larger trends, with fewer decisions |
| Long-term investing | Years to decades | Business growth and compounding |
Why a longer investing horizon lowers the odds of a loss
A long horizon does not remove risk, but it changes how often the result is negative. Using the annual S&P 500 total-return table (dividends included) maintained by Aswath Damodaran at NYU Stern, 26 of the 98 calendar years from 1928 through 2025 lost money. Stretch the window and losing periods become rarer. Of the 89 rolling 10-year windows in that table, 5 had a negative annual return, the worst being 1929 through 1938 at about -1.7% a year. None of the 79 rolling 20-year windows finished negative, and the weakest, 1929 through 1948, still compounded at about 2.4% a year.
That is index history, not a promise. It also assumes you held through every crash, which is the part people find hardest.
A trader cannot use that reasoning. A day trade that is down at 2:00 PM has no 20-year window to recover in. If a trader keeps holding a losing trade and calls it an investment, they have converted a planned risk into an unplanned one with no thesis behind it.
The tax line that follows the calendar
In the US, the time horizon also changes the tax treatment. Per IRS Topic 409, an asset held more than one year produces a long-term capital gain or loss, and one held one year or less produces a short-term one. Net short-term gains are taxed as ordinary income at graduated rates, while long-term net capital gains are taxed at 0%, 15% or 20% depending on taxable income.
Regulated futures follow a different rule. Under section 1256 of the Internal Revenue Code, gains and losses on these contracts are treated as 60% long-term and 40% short-term, whatever the holding period, and open contracts are marked to market at year end. Tax rules depend on your country and situation, so treat this as background and check with a tax professional.
Related lesson: Day trading vs. swing trading
Active Trading and Passive Investing
Active trading and passive investing sit at opposite ends of effort. Active trading means making frequent decisions and managing each position. Passive investing means buying a broad, low-cost fund, such as an S&P 500 index fund, and holding it with as few decisions as possible.
The passive side has a strong record against professional active management. In the SPIVA U.S. Year-End 2025 scorecard from S&P Dow Jones Indices, 79% of active large-cap US equity funds underperformed the S&P 500 in 2025, up from 65% in 2024. It was the fourth-worst year for active large-cap managers in the scorecard's 25-year history.
Those are professional fund managers with research teams, not individual traders, and they are trying to beat an index over a year. It still tells you something important. Busy is not the same as better. Active effort does not earn a return by itself. It earns a return only when the decisions are better than the default, after costs.
What active effort has to beat
The default for someone with long-term money is not zero. It is whatever a low-cost index position would have returned while you were busy trading. That makes the real question for active trading "can I beat doing nothing, after costs and taxes?" rather than "can I make money?"
There is a fair counterpoint. Active trading gives fast feedback. A trader can measure a method over a few hundred trades in months, while an investor may wait a decade to learn whether a stock-picking idea worked. Some people value that feedback loop, and some markets, such as futures, suit short holding periods. Active and passive are not good and bad. They are different bets on where your edge comes from.
Common Long-Term Investing Strategies
Long-term investing strategies are ways to own assets for years with a plan for what to buy, when to add, and when to change course. Most investors combine several.
Core long-term investing strategies
- Buy and hold. Buy quality assets or broad funds and keep them through market cycles. The strategy's main demand is behavioural: not selling in a crash.
- Index investing. Own the whole market, or a large slice of it, through a low-cost index fund or ETF instead of picking individual stocks. You accept the market's return and pay very little to get it.
- Dollar-cost averaging. Investor.gov defines it as investing equal amounts at regular intervals regardless of market moves, which means you buy more shares when prices are low and fewer when they are high. It removes the timing decision, which is the decision most people get wrong.
- Diversification and asset allocation. Investor.gov describes diversification as spreading money across investments so that if one loses money, others may make up for it. Asset allocation is the mix across stocks, bonds and cash that matches your horizon and tolerance for drawdowns.
- Rebalancing. Once or twice a year, bring the mix back to its target. If stocks have run up, you trim them, which forces a quiet version of "sell high, buy low."
Investing styles by what you buy
Investing styles describe which companies you favour, and each can sit inside a buy-and-hold or index-based plan.
- Value investing. Buy companies that look cheap compared with their earnings, assets or cash flow, and wait for the price to reflect that value.
- Growth investing. Buy companies expected to grow revenue and earnings faster than average, accepting higher valuations and bigger price swings.
- Dividend investing. Focus on companies that pay and grow dividends, for income as well as growth.
Each strategy has its own failure mode. Value can stay cheap for years. Growth can fall hard when expectations reset. Dividend stocks can cut their payouts. Index investing's failure mode is mostly you: abandoning the plan after a bad year. The investing strategies that work over long periods are usually the ones the investor can stick with when the market tests them.
Common Trading Strategies and Styles
Trading strategies come in two layers: the style, which sets how long you hold, and the setup, which sets when you enter and exit.
Trading styles by holding period
- Scalping. Many small trades held for seconds to minutes. Costs matter most here, because the average win is small.
- Day trading. Positions opened and closed in the same session, so there is no overnight gap risk. It demands screen time during market hours.
- Swing trading. Holds for days to weeks to catch a larger move. Fewer decisions, but overnight and weekend gaps can jump past a stop.
- Position trading. Holds for weeks to months, following bigger trends. It sits closest to investing but still uses defined exits.
Three common trading setups
Every trading setup should answer four questions before the order goes in: what you observed, what would confirm it, where you would enter, and what would prove you wrong.
- Trend following. Observation: price is making higher highs and higher lows. Confirmation: a pullback holds above the prior swing low and price turns back up. Invalidation: a close below that swing low, where the trend thesis no longer holds.
- Breakout. Observation: price is pressing against a level it has failed to clear several times. Confirmation: price clears the level and holds above it rather than snapping back. Invalidation: price falls back inside the range, which turns the breakout into a trap.
- Mean reversion. Observation: price has stretched far from its recent average inside a range-bound market. Confirmation: momentum fades and price stops making new extremes. Invalidation: the range breaks and the stretch becomes a trend.
Notice what is missing from that list: a reason to enter without an invalidation level. A setup with no defined exit is not a trading strategy, it is an opinion with a position attached.
Seeing a setup is not the same as getting a valid entry. You can read the direction correctly and still have no trade, because price never offered a level where your risk made sense. Waiting is a decision too.
Related lesson: Trading styles explained
Risk and Volatility in Trading vs Investing
Risk and volatility in trading vs investing arrive in different shapes. An investor's risk comes as long drawdowns spread over months or years. A trader's risk comes one decision at a time, and it compounds quickly when position size is too large.
Investing risk is the drawdown you sit through
Broad stock market investing has delivered large declines. In Damodaran's S&P 500 total-return table, 1931 lost 43.8%, 2008 lost 36.6%, and 2022 lost 18%. From 2000 through 2002 the index lost money three years in a row, about 37% in total.
Recovery is harder than the loss looks. A 43.8% loss needs a 78% gain to get back to even, and a 36.6% loss needs about 58%. That is why the investor's main risk control is time plus diversification, and why the biggest investing mistake is often selling near the bottom and missing the recovery.
Trading risk is the decision you size
A trader's risk is set by position size and the stop distance on each trade. In futures, contract choice is part of that decision. Per CME Group's contract specifications, the Micro E-mini S&P 500 (MES) moves $5 per index point and the E-mini S&P 500 (ES) moves $50 per point. A 10-point stop risks $50 on one MES and $500 on one ES. Same chart, same idea, ten times the dollar risk.
Futures are leveraged. At an illustrative index level of 7,000, one ES contract controls about $350,000 of index exposure and one MES about $35,000, far more than the cash needed to open the position. Leverage cuts both ways. It makes small accounts able to trade meaningful size, and it makes a few oversized losses enough to end an account.
A stop limits a planned loss, but it does not guarantee the fill. In a fast market a stop can trigger and fill well past its level, so the size you chose still has to be survivable if the exit is worse than planned.
Volatility means something different to each
To an investor, volatility is mostly noise to sit through, and sometimes a chance to buy more at lower prices. To a trader, volatility is the raw material. Without movement there is nothing to capture, but more movement also means wider stops, more slippage and faster losses. A trader who keeps the same position size on a day when the market moves twice as far is quietly taking twice the risk.
Related lesson: Risk management for traders
Trading Pros and Cons
Trading pros and cons come down to control and feedback on one side, and cost, time and difficulty on the other.
Pros
- You can profit from rising and falling prices, because traders can go long or short.
- You get fast, measurable feedback on a method over a few hundred trades.
- Defined risk per trade means a single loss is planned and limited when execution goes as expected.
- Day traders who close each position the same session avoid overnight gap risk.
- In futures, small contracts such as micros let a smaller account size positions precisely.
Cons
- Every trade costs money, so a method that breaks even before costs loses after them.
- It needs focused time during market hours, and decisions made while distracted are usually worse.
- Losing streaks are normal, even for a method with a real edge, and they test discipline hard.
- Leverage can turn sizing mistakes into large losses quickly.
- Short-term gains in many countries are taxed less favourably than long-term ones.
The break-even win rate trading has to clear
Costs change the hit rate you need before any profit appears. Take a trader risking $500 to make $500, a 1:1 setup, with a $6 round-turn cost for commission and exchange fees (an illustrative figure).
- A winning trade pays a net $494.
- A losing trade costs a net $506.
- Break-even is 506 divided by 1,000, or 50.6%.
The same $6 cost on a 2:1 setup, risking $500 to make $1,000, drops break-even to about 33.7%. The cost did not change. The reward did.
Now shrink the trade. A scalper risking $100 to make $100 with an $8 round turn needs a 54% win rate to break even, because the cost is 8% of the planned win instead of 1.2%. Style and cost are one decision, not two. Cut the average win, and the hit rate you need climbs faster than most people expect.
What trading expectancy looks like over a year
Put those numbers on a $25,000 account risking 1% per trade, which is $250, at 1:1 with a $6 round turn. Net win is $244 and net loss is $256.
| Win rate | Expectancy per trade | After 200 trades | Return on $25,000 |
|---|---|---|---|
| 50% | -$6 | -$1,200 | -4.8% |
| 55% | +$19 | +$3,800 | +15.2% |
| 60% | +$44 | +$8,800 | +35.2% |
Two things stand out. A 50% win rate is a losing business once costs are paid, even though a coin flip feels neutral. And moving from 55% to 60% more than doubles the result, so small gains in decision quality matter more than any indicator setting.
The variance is large, too. With these numbers, the standard deviation over 200 trades is about $3,500, or 14% of the account. A true 55% method has about an 86% chance of a positive 200-trade year. At 52%, the expected result is only +$800 and the chance of a positive year falls to about 59%. A real edge can still produce a flat or losing few months, which is why one rough stretch is one line in the sample, not a verdict.
What the 97% day trading study measured
The often-quoted "97% of day traders lose money" comes from a study by Fernando Chague, Rodrigo De-Losso and Bruno Giovannetti, "Day Trading for a Living?" They looked at every individual who started day trading Brazilian equity index futures between 2013 and 2015. Of the 1,551 who kept at it for more than 300 days, 97% lost money after fees, only 1.1% earned more than Brazil's minimum wage, and 0.5% earned more than a bank teller's starting salary.
It is one market and one period, and it measured people trading on their own with no stated risk rules. It does not prove that every trader loses. It does show that persistence alone does not produce a profit, and that costs plus an unmeasured method are a losing combination.
Related lesson: Trading expectancy
Investing Pros and Cons
Investing pros and cons come down to compounding and low effort on one side, and long drawdowns and slow feedback on the other.
Pros
- Compounding does most of the work over long periods, with few decisions needed.
- Low-cost index funds give broad diversification for very little in fees.
- It needs little screen time, so it fits around a job and family.
- In the US, assets held more than one year qualify for long-term capital gains rates.
- History has rewarded patience. The S&P 500 compounded at about 10% a year from 1928 through 2025, dividends included, per Damodaran's table.
Cons
- Drawdowns can be deep and long, and 26 of those 98 years were negative.
- Feedback is slow. You may not know for a decade whether a stock-picking approach worked.
- Money is tied up. Selling in a downturn to cover a bill can lock in losses.
- High fees quietly eat returns over decades.
- Behaviour is the main risk. Many investors sell after a crash and buy back after the recovery.
How compounding and fees add up
Compounding is slow at first and large later. At an illustrative 7% a year, $10,000 becomes about $76,100 in 30 years. At 10%, it becomes about $174,500. Adding $500 a month at 7% for 30 years builds about $610,000 from $180,000 of contributions.
Fees work the same way in reverse. Put $100,000 in for 30 years at an illustrative 7% gross return. With 0.05% in annual costs it grows to about $750,600. With 1% in annual costs it grows to about $574,300. That gap of roughly $176,000 comes from a fee difference most people never notice on a statement.
When investing in stocks makes sense
For long-term money, owning a diversified mix of stocks has historically beaten cash and bonds, but it comes with deep drawdowns and no guarantee for any given period. It tends to make sense for money you will not need for years, held in broad funds rather than a few names. For money you need soon, the drawdown risk usually outweighs the expected return.
Capital and Time Needed to Trade or Invest
Capital and time requirements are where trading and investing differ most in daily life.
| Requirement | Investing | Trading |
|---|---|---|
| Starting capital | Small regular amounts into a fund | Enough that one planned loss is a small share of the account |
| Time per week | Minutes, plus an annual review | Hours during market sessions, plus review |
| Learning curve | Basic fund and fee knowledge | Order types, sizing, costs, a tested setup |
| Ongoing costs | Fund fees, occasional trading costs | Commissions, data, platform, slippage |
| When you can do it | Any time, even monthly | Only when the market is open and you are focused |
Capital needed for trading
Trading capital depends on the instrument and your risk per trade. If your rule is to risk 1% per trade and your setup needs a $250 stop, you need a $25,000 account to stay inside that rule. Small futures contracts such as micros lower the dollar risk per trade, which is one reason futures day traders often start there.
US stock day traders have also faced the pattern day trader rule, with its $25,000 minimum equity. As of November 2026, FINRA Regulatory Notice 26-10 replaces those day-trading margin requirements with new intraday margin standards, effective June 4, 2026, with a phase-in that ends October 20, 2027. During the phase-in some brokers may still apply the old rule. Futures were never subject to the PDT rule.
Can you make $1,000 a month in the stock market
As income, $1,000 a month is $12,000 a year. From investing, that takes about $300,000 at an illustrative 4% withdrawal or dividend rate, or $200,000 at 6%, and returns vary from year to year. From trading, there is no honest fixed figure. A steady $1,000 a month would need a measured edge, enough capital that the required risk per trade stays small, and acceptance that some months will lose.
Related lesson: How much money you need to start trading
Trader and Investor Profiles
Trader and investor profiles are less about personality labels and more about behaviour you can check in yourself.
A good fit for investing usually looks like this:
- You can leave a position alone for a year without checking it every day.
- You care more about where you will be in 10 or 20 years than this month.
- You would rather spend your free hours on something other than charts.
- A 20% drop makes you uncomfortable but does not make you sell.
A good fit for trading usually looks like this:
- You can give a consistent, focused block of time during market hours.
- You can take a planned loss and place the next trade at the same size, without revenge or hesitation.
- You enjoy measuring a process and changing it only on evidence from a sample.
- You follow written rules when they are inconvenient, including the rule to do nothing.
The trading profile is not "loves excitement." Traders who need action tend to force trades in slow markets, inventing a setup because sitting still feels like falling behind. The traits that last are closer to patience and record keeping than to boldness.
People change, too. Someone may start as an investor and build trading skills in simulation later, or trade for years and move most of their money into long-term holdings once their circumstances shift.
Related lesson: Trading psychology
Should Beginners Start With Trading or Investing
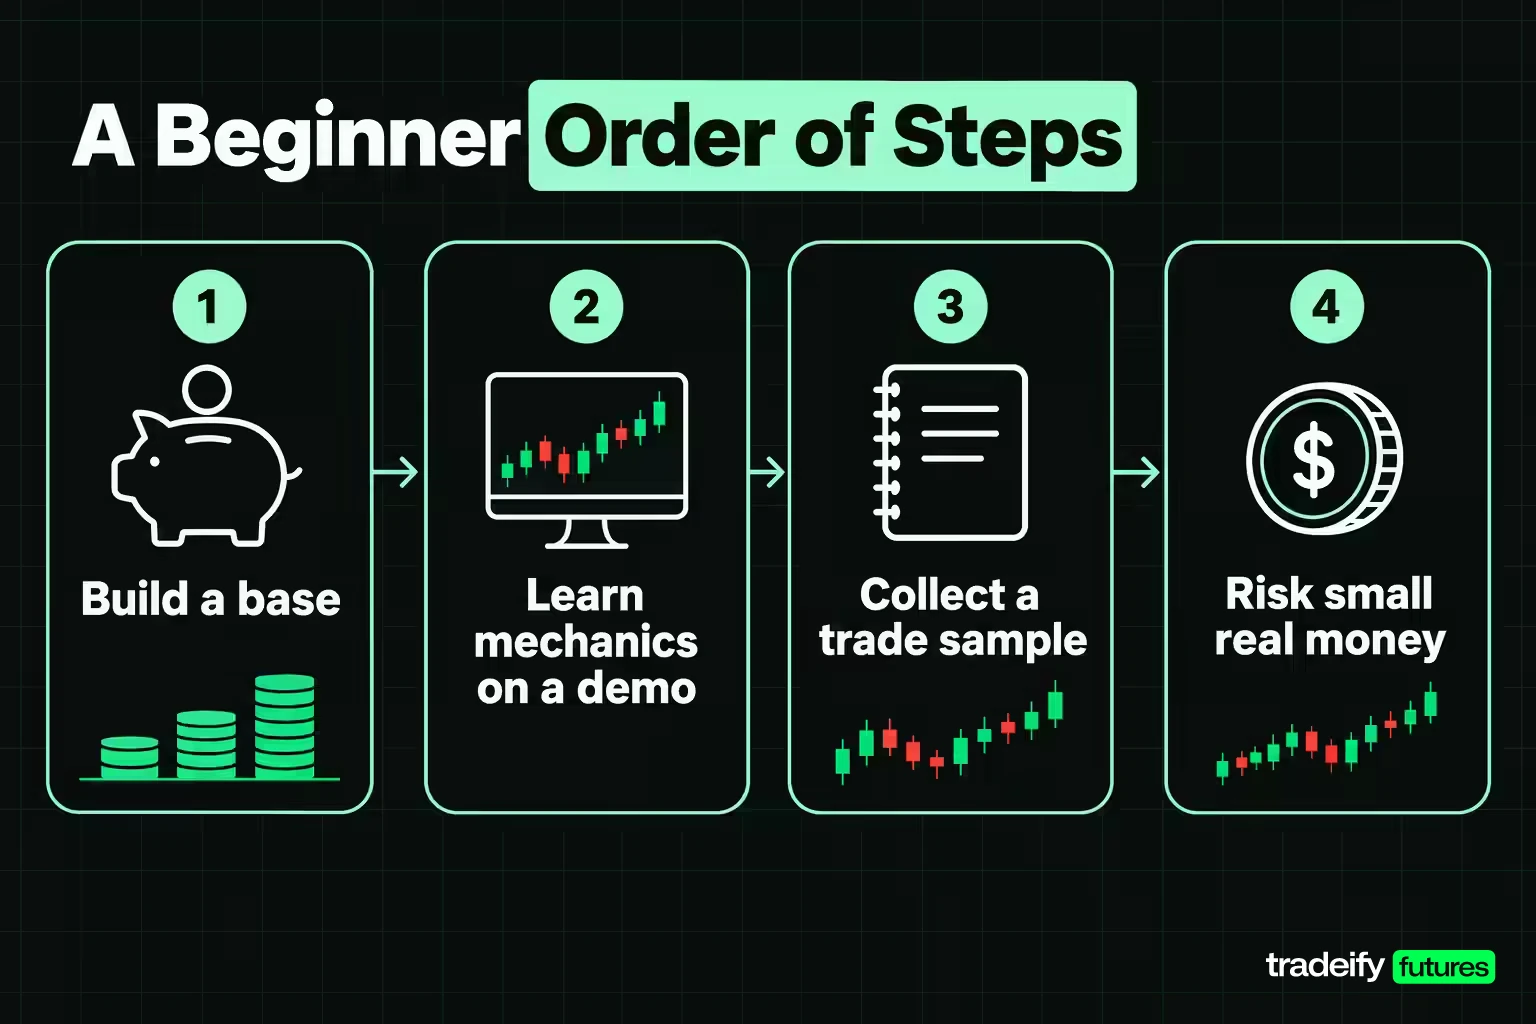
For most beginners, investing is the easier first step, and trading is a skill to build deliberately rather than a place to start with savings.
A practical order for a beginner looks like this:
- Build a base. Keep an emergency fund in cash, then start long-term investing in a broad, low-cost fund with regular contributions.
- Learn trading mechanics with no money at risk. Use a demo or paper-trading account to learn order types, position sizing and how fills really happen.
- Collect a sample. Log at least 50 to 100 trades of one setup with a fixed risk unit, then check the win rate, average win and loss, and costs.
- Risk small real money only after the sample. If the numbers clear break-even after costs, trade at the smallest size available and keep the investing account separate.
Beginners get caught in two predictable ways. One is treating a trading account like an investment, holding a loser because "it'll come back." The other is treating an investment like a trade, selling a fund after one bad month because the red number on the screen feels like a decision waiting to be made. Knowing which job each dollar is doing prevents both. Label each account by its job, if that helps.
Related lesson: Practice with paper trading
How to Choose Between Trading and Investing
Choosing between trading and investing comes down to four things: your hours during market sessions, how you behave after a loss, the evidence you have for a method, and when you will need the money. Five questions test them, and the pattern of answers matters more than a score.
Five questions that decide the fit
- The holding question. Could you leave a position alone for a year without checking it daily? If yes, investing fits your temperament. If you would sell in the first bad week, the problem is the plan, not the asset.
- The attention question. Can you give the same focused hour most days, during market hours? Trading is an attention commitment. With no reliable window in your week, an active style will be managed badly or not at all.
- The loss question. Can you take a planned loss of your full risk unit without changing your next decision? This one is a gate. A no means neither approach is the bottleneck. Sizing and rule-following are.
- The evidence question. Do you have a written record of at least 50 trades from a journal, a backtest or a simulator? Trading without a sample is guessing with money.
- The money question. Is the money you would use money you will not need for at least three years? If not, neither job should be funded with it.
Reading your trading and investing answers
A yes to the holding and money questions, with no pull toward daily screen time, points to investing. Adding yes answers to the attention, loss and evidence questions makes an active trading approach defensible. A no on the loss question should pause both until it becomes a yes, because behaviour breaks a plan long before knowledge runs out.
Doing both trading and investing
Many people do both, and the split is rarely half and half. A common structure is a long-term investing account left alone for years, plus a smaller trading account funded with money you can afford to lose.
Keep them separate in three ways:
- Separate money. Never refill a trading account from long-term savings after a loss. The moment you do, the investor has quietly become a trader with no risk limit.
- Separate rules. The investing account follows an allocation and a rebalancing schedule. The trading account follows a risk unit and a daily loss limit.
- Separate scoreboards. Judge the investing account on total return against a benchmark. Judge the trading account on expectancy per trade, average win and loss, and largest drawdown over a sample.
Mixing scoreboards is how an investing result gets mistaken for trading skill, or the reverse.
Related lesson: Build your first trading plan
Trading With a Drawdown Rule Instead of Savings
Trading inside a funded evaluation account changes the risk question. The loss budget is no longer your savings. It is the account's maximum drawdown rule, and the account fails when that boundary is reached.
That turns position sizing into a survival calculation. In an illustrative account with a $3,000 maximum drawdown, risking $500 per trade means six full losses end it. Cut the risk unit to $250 and the same rule absorbs twelve. The setups did not change. The distance to failure doubled.
Contract choice is part of the same decision. A $250 risk could be one ES with a 5-point stop, or five MES with a 10-point stop. The MES version gives price more room for the same dollar risk, which matters on a volatile day.
The pressure shows up after a few losses, when the temptation is to size up and win the drawdown back in one trade. After three $500 losses that account has $1,500 of room left. At $500 a trade that is three more losses; doubled to $1,000 a trade, it is one. So the useful question on an evaluation account is not how much you can make this week. It is how many ordinary losing trades the drawdown rule can absorb at your size, and whether that is more than the losing streak your setup normally produces.
On our accounts, you trade futures only, and funded accounts are simulated. Every position is closed by 4:45 PM ET on regular trading days, with no overnight, weekend or swing holds, so our accounts sit firmly on the trading side of this comparison. We do not offer cash stocks, options or crypto derivatives, so long-term investing belongs in a separate account with its own rules.
Trading vs Investing FAQ
Is it true that 97% of day traders lose money?
Not as a universal fact, because the 97% figure comes from one study of one market. Economists Fernando Chague, Rodrigo De-Losso and Bruno Giovannetti found that of 1,551 people who day traded Brazilian equity index futures for more than 300 days, 97% lost money after fees. It shows that persistence without a measured edge tends to lose, not that every trader does.
What are the major stock exchanges?
In the US, the major stock exchanges are the New York Stock Exchange and Nasdaq, and the SEC's list of registered national securities exchanges had 29 entries as of its January 2026 update. Investors usually buy stocks and ETFs listed on those exchanges. Futures traders use separate futures exchanges, such as the Chicago Mercantile Exchange and the Chicago Board of Trade, both part of CME Group.
Is investing in stocks a good idea?
Often yes for long-term money, because a diversified stock fund has historically outgrown cash and bonds, with deep drawdowns along the way. For money you need within a few years, the risk of a large decline usually outweighs the expected return.
Can I make $1000 a month in the stock market?
From investing, $1,000 a month takes about $300,000 at an illustrative 4% withdrawal or dividend rate, and returns vary. From trading, there is no reliable fixed figure, because results depend on edge, costs and risk control, and many traders lose money.
Is trading gambling?
Not by definition, but it can become gambling when there is no edge, no fixed risk per trade and no record. Trading behaves like a business when a setup shows positive expectancy over a large sample and each loss is sized in advance.
Is day trading the same as investing?
No. Day trading closes every position within one session and is paid by price moves, while investing holds for years and is paid by the asset's growth.
This guide is educational content, not financial or tax advice; trading futures and other leveraged products can produce losses larger than expected, and investing can lose principal too. Historical index returns do not predict future results, and funded and evaluation accounts are simulated, so their results do not reflect live trading.


