



TL;DR: The MFI indicator is a volume-weighted RSI that sorts each session's money flow by whether typical price rose or fell. On two years of E-mini S&P 500 bars, MFI(14) reached 80 on 17 of 489 sessions, and the next close was higher only 35.29% of the time. Treat extremes as context, choose the length by how often it fires, and size the trade from the stop.
The MFI indicator, short for Money Flow Index, puts a number between 0 and 100 on one question: over the last 14 bars, did more money change hands on up bars or on down bars? Most traders meet it as the line that says "overbought" at 80 and "oversold" at 20. The trouble starts when that label becomes a trade: the MFI prints 85, the market has run for a week, and shorting the top feels like the disciplined call.
This guide works through the formula on real E-mini S&P 500 futures bars, then audits what the classic MFI levels, divergences and failure swings actually did on the E-mini S&P 500 (ES) and E-mini Nasdaq 100 (NQ) futures between September 16, 2024 and September 15, 2026. Every figure was measured for this guide from Yahoo Finance's continuous front-month ES and NQ daily data, 503 completed sessions, so you can see the method and judge the sample size yourself.
What the MFI Indicator Measures
The Money Flow Index was created by Gene Quong and Avrum Soudack and is often called a volume-weighted RSI. That label is accurate, but it hides the part that matters when you read it: the MFI indicator does not measure price change. It measures money.
Each bar gets a typical price, the average of its high, low and close. Multiply that by the bar's volume and you get raw money flow. StockCharts calls this "essentially dollar volume", and on a stock it is. On futures the unit is contracts times index points, so it needs one more step to become dollars.
On ES over the two-year window, the median session's raw money flow was about 9.20 billion. At $50 per index point on the E-mini contract, that is about $460 billion of notional value changing hands in a typical session. The MFI indicator never uses that scale directly, because everything gets turned into a ratio, but it is a useful reminder of what the line is built from.
How the MFI indicator sorts money into buckets
The MFI indicator then sorts each bar's money flow into one of two buckets:
- If today's typical price is above yesterday's, the whole bar's money flow goes into the positive bucket.
- If it is below, the whole bar goes into the negative bucket.
- If it is unchanged, the bar is skipped.
That sorting rule is the part worth pausing on. A session where typical price rose 20 points and one where it rose half a point are bucketed the same way. The size of the move never decides the bucket; volume only sets the amount. The unchanged case sounds important in textbooks, but across 502 day-to-day transitions on each of ES and NQ in the window, typical price never repeated exactly once. On liquid index futures it is dead text. On thin markets and short intraday bars it starts to matter.
What the MFI indicator cannot tell you is who did the trading. A rising MFI shows more volume printed on up bars than on down bars. It does not show that institutions bought, that "smart money" accumulated, or that anyone's position changed hands in a particular direction, because every contract traded has a buyer and a seller.
Related lesson: What is volume
How the MFI Indicator Is Calculated
The MFI calculation has four steps, as published in the TradingView and StockCharts references:
- Typical price = (high + low + close) / 3.
- Raw money flow = typical price x volume.
- Money flow ratio = the sum of positive money flow over 14 bars divided by the sum of negative money flow over the same 14 bars.
- MFI = 100 - 100 / (1 + money flow ratio).
Fourteen bars is the default on most platforms and the setting the creators recommended. Note that a 14-period MFI needs 15 bars of data, because the first bar only supplies the prior typical price for the comparison.
Worked MFI calculation on 14 E-mini S&P 500 sessions
The table works the MFI calculation for ES on September 15, 2026. The August 25 session supplies only the starting typical price of 7,688.75. Money flow is shown in millions, rounded to two decimals, so a spreadsheet can reproduce the last line.
| Date | High | Low | Close | Prior typical price | Typical price | Volume | Raw money flow $m | Bucket |
|---|---|---|---|---|---|---|---|---|
| Aug 26, 2026 | 7,710.25 | 7,670.75 | 7,690.00 | 7,688.75 | 7,690.33 | 1,083,071 | 8,329.18 | Positive |
| Aug 27, 2026 | 7,755.50 | 7,702.75 | 7,742.50 | 7,690.33 | 7,733.58 | 1,347,688 | 10,422.46 | Positive |
| Aug 28, 2026 | 7,782.50 | 7,711.75 | 7,722.00 | 7,733.58 | 7,738.75 | 1,520,831 | 11,769.33 | Positive |
| Aug 31, 2026 | 7,724.00 | 7,674.75 | 7,699.00 | 7,738.75 | 7,699.25 | 1,247,996 | 9,608.63 | Negative |
| Sep 1, 2026 | 7,708.00 | 7,621.50 | 7,642.75 | 7,699.25 | 7,657.42 | 1,599,408 | 12,247.33 | Negative |
| Sep 2, 2026 | 7,691.25 | 7,618.50 | 7,676.50 | 7,657.42 | 7,662.08 | 1,312,751 | 10,058.41 | Positive |
| Sep 3, 2026 | 7,766.50 | 7,661.25 | 7,754.75 | 7,662.08 | 7,727.50 | 1,466,815 | 11,334.81 | Positive |
| Sep 4, 2026 | 7,764.50 | 7,711.75 | 7,722.00 | 7,727.50 | 7,732.75 | 1,266,711 | 9,795.16 | Positive |
| Sep 8, 2026 | 7,728.50 | 7,672.25 | 7,680.50 | 7,732.75 | 7,693.75 | 1,541,813 | 11,862.32 | Negative |
| Sep 9, 2026 | 7,691.25 | 7,628.75 | 7,643.75 | 7,693.75 | 7,654.58 | 1,432,203 | 10,962.92 | Negative |
| Sep 10, 2026 | 7,666.25 | 7,585.50 | 7,598.50 | 7,654.58 | 7,616.75 | 1,713,441 | 13,050.85 | Negative |
| Sep 11, 2026 | 7,683.50 | 7,594.25 | 7,659.50 | 7,616.75 | 7,645.75 | 2,084,922 | 15,940.79 | Positive |
| Sep 14, 2026 | 7,652.00 | 7,593.75 | 7,625.00 | 7,645.75 | 7,623.58 | 1,925,420 | 14,678.60 | Negative |
| Sep 15, 2026 | 7,633.25 | 7,576.75 | 7,589.25 | 7,623.58 | 7,599.75 | 943,078 | 7,167.16 | Negative |
Seven sessions went into each bucket. The positive bucket totals 77,650.14 million and the negative bucket 79,577.81 million, a money flow ratio of 0.975776. Through the transform, the MFI reading for September 15 is 49.39.
Checking an MFI calculation by hand
Two checks keep a hand MFI calculation honest. First, the ratio should multiply back out: 0.975776 x 79,577.81 = 77,650.14, which matches the positive bucket. Second, carry enough decimals. Rounded to four places, 0.9758 x 79,577.81 = 77,652.03, about 1.89 million too high. If your spreadsheet and your platform disagree by a few tenths of a point, rounding is the first suspect, and the lookback length is the second.
On the ES worked example for September 15, 2026, a reading of 49.39 says the prior 14 sessions of money flow leaned very slightly toward down sessions. That is not a signal. It is the most ordinary state the MFI indicator can be in.
How to Read MFI Readings
Reading the Money Flow Index starts with the level, then the direction, then the context:
- Level. Above 50 means more money printed on up bars than down bars over the lookback; under 50 means the reverse. Near 50, the reading carries little information. In this guide's two-year measurement on Yahoo Finance continuous futures data, the median 14-day MFI was 54.16 on ES and 56.16 on NQ, which fits two markets that mostly rose.
- Direction. A rising MFI means the newest bar added more to the positive side, or the bar that dropped out of the window was a heavy positive bar replaced by a lighter one, or both.
- Context. The same reading means different things in a trend and in a range, which is why StockCharts says the 50 centerline "isn't ideal" for setting a bias on MFI.
Rising MFI agrees with price; it does not predict it
A rising MFI line often looks predictive on a chart. This guide's own two-year measurement, run on Yahoo Finance continuous ES and NQ daily futures data from September 16, 2024 to September 15, 2026, shows why that impression misleads. On ES, when the 14-day MFI rose, the index had closed higher that same session 71.14% of the time, across 246 cases. When it fell, the same session closed higher only 35.68% of the time, across 241 cases. NQ gave 69.80% and 39.66%.
Now check the next session in the same Yahoo Finance futures data. After a rising MFI, ES closed higher the following day 52.03% of the time. After a falling MFI, it closed higher 55.19% of the time. The base rate across all sessions with a defined reading was 53.48%. NQ looked the same: 51.76% after a rise, 59.48% after a fall, against 55.33%.
So the direction of the MFI indicator mostly describes the bar you just saw. That is useful for confirming that volume backed a move. It is not a forecast, and a rule that buys because the MFI "turned up" is often buying a description of yesterday.
MFI Overbought and Oversold Levels Measured
The standard MFI overbought level is 80 and the oversold level is 20. Quong and Soudack also suggested 90 and 10 as "truly" overbought and oversold, and StockCharts notes that strong trends are a problem for both sets of levels, because the MFI can stay overbought while prices keep rising.
That persistence is measurable. This guide measured it on Yahoo Finance continuous ES and NQ daily futures data from September 16, 2024 to September 15, 2026. Here is how often each level was reached over the 489 sessions with a defined MFI(14):
| MFI(14) level census | E-mini S&P 500 (ES) | E-mini Nasdaq 100 (NQ) |
|---|---|---|
| Sessions at or above 80 | 17 (3.48%) | 22 (4.50%) |
| Sessions at or below 20 | 2 (0.41%) | 4 (0.82%) |
| Sessions at or above 90 | 3 | 1 |
| Sessions at or below 10 | 0 | 0 |
| Runs above 80 | 3 runs of 5, 10 and 2 sessions | 6 runs, longest 10 sessions |
| Runs below 20 | 1 run of 2 sessions | 1 run of 4 sessions |
| Full range of the reading | 18.54 to 96.62 | 13.27 to 97.07 |
| Median reading | 54.16 | 56.16 |
The asymmetry is the first lesson. In a two-year advance, the oversold side fired on ES during a single two-session run. A trader waiting for an MFI buy signal under 20 had one chance. A trader treating every reading over 80 as a sell signal was shown a "sell" during a 10-session run that kept going.
What happened after MFI readings above 80
The claim worth testing is that an overbought MFI warns of a pullback. The next session answers it directly. The table uses this guide's own measurement on Yahoo Finance continuous ES and NQ daily futures data, September 16, 2024 to September 15, 2026, with MFI(14) and close-to-close changes.
| Forward test after MFI(14) at or above 80 | ES | NQ |
|---|---|---|
| Next session closed higher | 6 of 17 (35.29%) | 13 of 22 (59.09%) |
| Base rate, all sessions | 53.59% | 55.58% |
| Mean next-session change | -0.02% | 0.28% |
| Ten sessions after the first bar of each run, higher | 2 of 3 | 5 of 6 |
| Mean ten-session change from that bar | -0.42% | 1.83% |
| Base rate, any ten-session window higher | 61.87% | 60.24% |
| Mean ten-session change, any window | 0.63% | 0.86% |
The ES next-session number looks like support for the overbought rule: 35.29% against a 53.59% base. But the average move was -0.02%, essentially flat, and NQ went the other way, closing higher 59.09% of the time after an over-80 reading. Over ten sessions, the ES sample is three events and the NQ sample is six. None of that is enough to trade on.
The honest reading is that the MFI overbought level described an uptrend that mostly continued. An overbought reading in a market grinding higher is a description of the grind, not a warning about it. That is still information. It tells you volume was flowing into up bars, which is a reason to be careful about fading the move, not a reason to sell it.
MFI vs RSI on the Same Sessions
The MFI indicator and RSI use the same final transform, so they look alike on a chart. The inputs are what separate them. RSI, created by J. Welles Wilder Jr. in 1978, uses only the size of close-to-close changes. MFI uses typical price and volume and ignores the size of the move when it sorts.
| Comparison point | Money Flow Index (MFI) | Relative Strength Index (RSI) |
|---|---|---|
| Per-bar input | (High + Low + Close) / 3 | Closing price |
| What gets weighted | Typical price x volume | Size of the close-to-close change |
| Bucket rule | Whole bar's money flow goes up or down by typical price direction | Gains and losses averaged separately |
| One-point rise on very heavy volume | Large addition to the positive side | Tiny addition to the average gain |
| 20-point rise on light volume | Small addition to the positive side | Large addition to the average gain |
| Final transform | 100 - 100 / (1 + ratio) | 100 - 100 / (1 + ratio) |
| Conventional levels | 80 and 20, with 90 and 10 as extremes | 70 and 30 |
How often MFI and RSI agree
This guide ran MFI(14) and RSI(14) over the same 489 sessions of Yahoo Finance continuous ES and NQ daily futures data, September 2024 to September 2026. The results show how much the volume term changes the output:
- RSI(14) reached 70 or higher on 42 ES sessions and 61 NQ sessions, and 30 or lower on 8 of each.
- MFI(14) hit its 80 or 20 extremes on 19 ES sessions against 50 for RSI's levels, and 26 NQ sessions against 69.
- Only 4 of the 19 ES MFI extremes coincided with an RSI extreme. On NQ, 12 of 26 did.
- The two readings correlated at 0.700 (ES) and 0.757 (NQ) by rank. The average gap between them was 8.85 and 8.12 points, and the widest gap was 30.83 and 30.99.
Is MFI better than RSI? Neither wins outright. RSI answers "how hard did price move?" and MFI answers "where did the volume print?" The practical risk is copying an RSI rule onto the MFI indicator. If your plan says "RSI above 70" and you change it to "MFI above 70", you have quietly built a different system that fires far more often than the MFI's own 80 level.
Related lesson: Relative strength index
MFI Divergences and How to Confirm Them
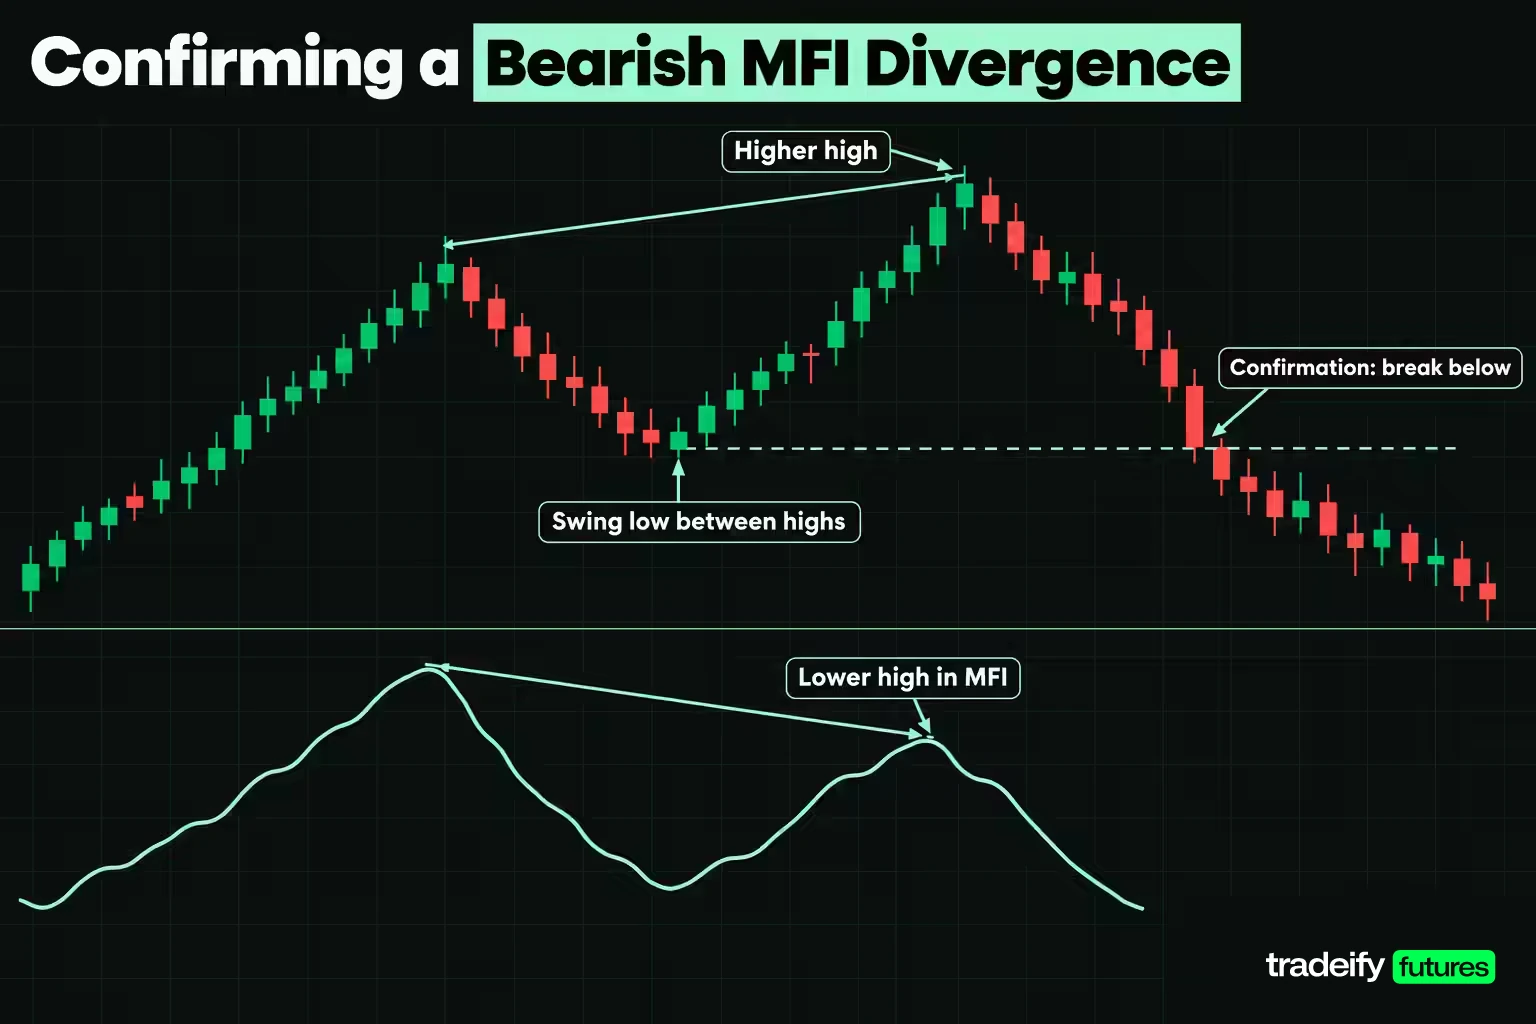
An MFI divergence is a disagreement between price and money flow:
- Bearish MFI divergence. Price makes a higher high while the MFI makes a lower high. Volume on the push to the new high was lighter, or more of it printed on down bars.
- Bullish MFI divergence. Price makes a lower low while the MFI makes a higher low. Selling pressure, measured in money flow, eased even as price fell further.
The appeal is obvious: a divergence seems to show the move running out of fuel before price admits it, and spotting one feels like seeing something the crowd missed. The risk is just as clear. In a strong trend, MFI divergences can stack up one after another while price keeps going, because each new high on lighter volume is still a new high.
Marking an MFI divergence without hindsight
A divergence only exists once the second price swing is confirmed, and confirming a swing high takes bars after the high. On a live chart, that means:
- Mark the first swing high (or low) in price and the MFI value on that bar.
- Wait until the second swing is confirmed by price moving away from it, not while price is still printing new highs.
- Compare the two MFI values. A lower MFI at a higher price high is the bearish case.
- Treat it as a warning, then wait for price to confirm: a break of the swing low between the two highs, or a failure at a level you already marked.
The invalidation is simple. If price makes another higher high and the MFI makes a higher high with it, the divergence is gone. StockCharts notes that a divergence and a failure swing appearing together carry more weight than either alone, which is a reasonable filter when divergences come too often.
MFI Failure Swings and Other Trading Signals
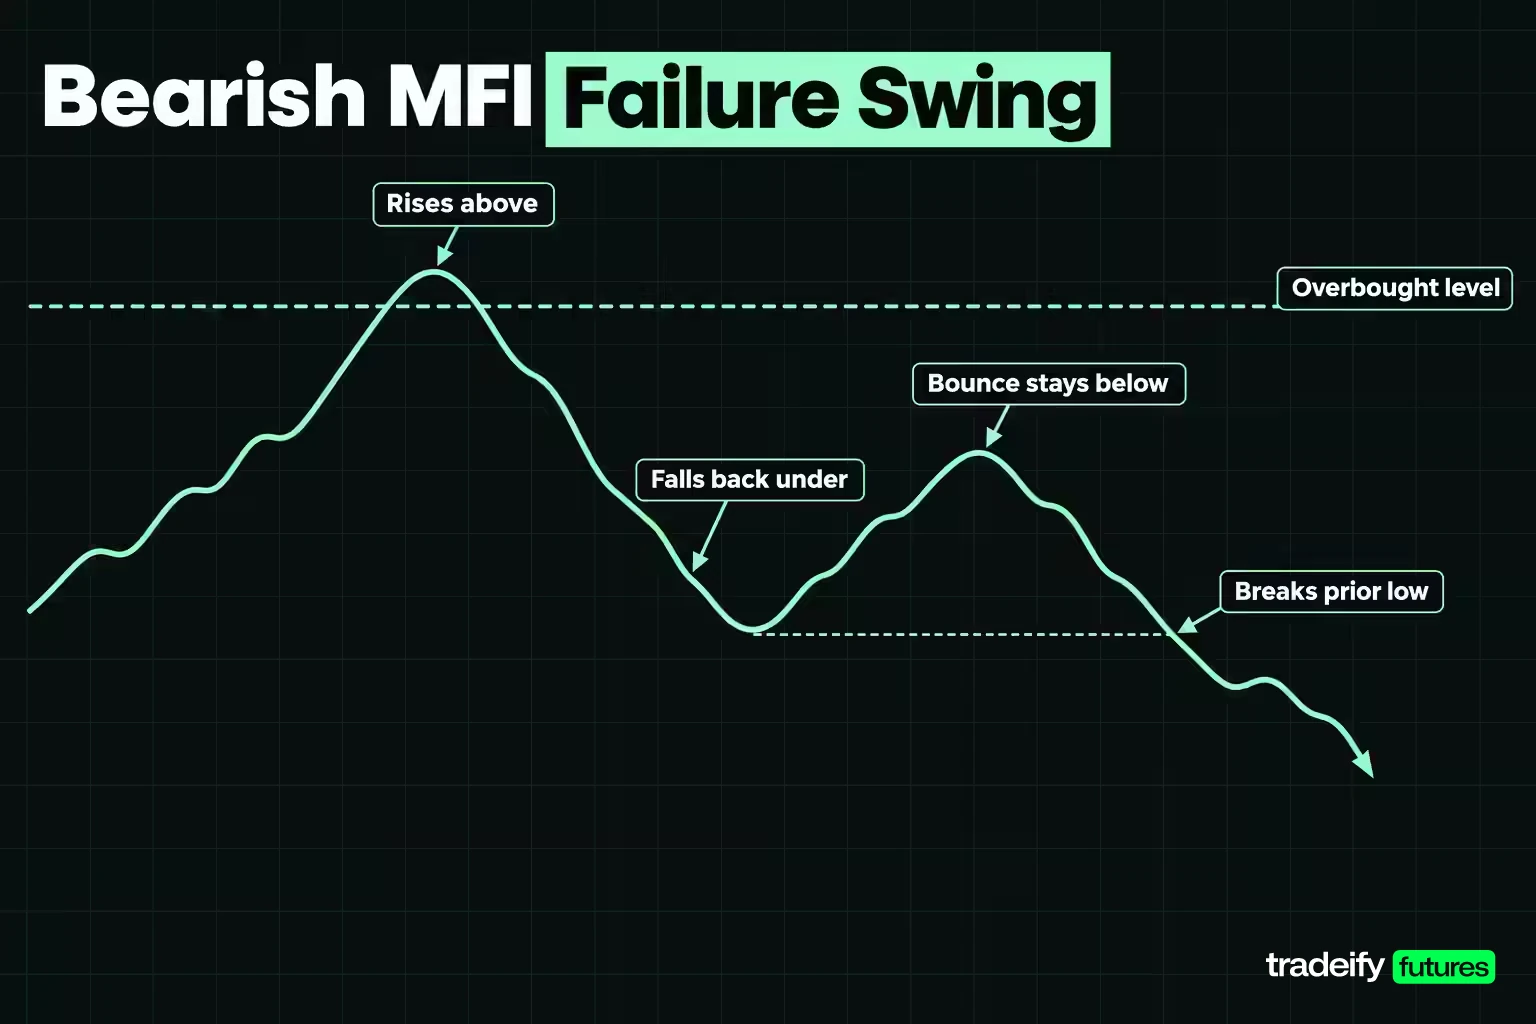
Quong and Soudack named three MFI signals: overbought and oversold levels, divergences and failure swings. The failure swing is the one that relies only on the MFI line, with no reference to price.
A bearish MFI failure swing has four steps:
- The MFI rises above 80.
- It falls back under 80.
- It bounces but stays under 80.
- It breaks lower than the low it made between steps 2 and 3.
A bullish failure swing mirrors it at 20: under 20, back above, a pullback that holds above 20, then a break above the prior high.
Every MFI failure swing in two years of index futures
Because the MFI failure swing is fully rule-based, it can be counted. The bearish version needs the MFI to rise above 80, fall back under 80, bounce while staying under 80, then break the low it made after leaving 80; the bullish version mirrors it at 20. This guide applied that rule to the daily MFI(14) on Yahoo Finance continuous ES and NQ futures data from September 16, 2024 to September 15, 2026, with a bounce of any size counting. It found nine MFI failure swings in total, seven bearish and two bullish:
| Failure swing | Signal date | Change ten sessions later |
|---|---|---|
| ES bearish | December 17, 2024 | -2.27% |
| ES bearish | October 3, 2025 | -0.91% |
| ES bearish | April 27, 2026 | +3.20% |
| NQ bearish | December 17, 2024 | -3.85% |
| NQ bearish | May 30, 2025 | +1.25% |
| NQ bearish | October 3, 2025 | -0.02% |
| NQ bearish | June 5, 2026 | +5.61% |
| ES bullish | November 24, 2025 | +1.89% |
| NQ bullish | March 20, 2025 | -5.10% |
Four of the seven bearish swings were followed by a lower price ten sessions later, and the two bullish swings split one each way. Nine events in two years is too few to call the signal good or bad. What the table does show is how rare a clean failure swing is on daily index futures, roughly one every few months per market, and how large the misses can be. The NQ bullish swing in March 2025 was followed by a 5.10% drop.
MFI crossover and centerline signals
Two other MFI trading signals come up often:
- Level crossovers. Selling when the MFI crosses back under 80, or buying when it crosses back above 20, rather than at the first touch. This waits for money flow to turn, at the cost of a later entry.
- Centerline crosses. Treating a move through 50 as a bias change. StockCharts advises against relying on this for MFI, and the two-year medians of 54.16 and 56.16 suggest why: in a rising market, the MFI indicator spends more time above 50 by default.
MFI Indicator Settings and Lookback Length
The default MFI setting is 14 periods. TradingView, StockCharts and thinkorswim all let you change the length, and thinkorswim also lets you set the overbought and oversold levels and add a moving average of the MFI itself.
Length changes the tails of the MFI indicator far more than its middle:
| MFI length | Defined sessions (each market) | Range ES | Range NQ | Median ES and NQ | At or above 80, ES and NQ | At or below 20, ES and NQ |
|---|---|---|---|---|---|---|
| 7 periods | 496 | 0.00 to 100.00 | 11.13 to 100.00 | 52.80 and 54.89 | 83 and 99 | 15 and 15 |
| 14 periods | 489 | 18.54 to 96.62 | 13.27 to 97.07 | 54.16 and 56.16 | 17 and 22 | 2 and 4 |
| 21 periods | 482 | 24.51 to 85.63 | 25.23 to 89.86 | 54.58 and 56.52 | 7 and 10 | 0 and 0 |
| 50 periods | 453 | 35.63 to 70.48 | 37.56 to 73.97 | 53.30 and 56.77 | 0 and 0 | 0 and 0 |
A 7-period MFI on ES sat at or above 80 on 83 of 496 sessions, 16.73%, and touched 90 or higher 31 times. A 50-period MFI never left a 35.63 to 70.48 range, so it could not produce an 80 or 20 signal at all. The medians barely moved, staying between 52.80 and 56.77 across every setting and both markets.
Choosing an MFI length on purpose
The table turns length into a frequency decision. On ES, 14 periods produced roughly one extreme reading a month in this window. Seven periods produced extremes routinely enough to be noise for a level-based rule. Fifty periods produced none.
Pick the length from how often you want the level to fire on the market you trade, then write it into your plan. The common mistake is changing the length after a losing week until the last loss would have been avoided. It feels like learning. It is curve-fitting the indicator to a story, not to the market.
Using the MFI Indicator by Trading Style
The MFI indicator works on any timeframe that has real volume, but the volume behind each bar changes what a reading means.
MFI for day traders on intraday charts
To see how the MFI indicator behaves intraday, the same MFI(14) was run on 5-minute ES bars from August 27 to November 3, 2026, 13,038 completed bars, and split by time of day:
| 5-minute MFI(14) on ES | Regular hours, 9:30 AM to 4:00 PM ET | Overnight and other hours |
|---|---|---|
| Bars with a defined reading | 3,743 | 9,281 |
| Readings at or above 80 | 140 | 496 |
| Readings at or below 20 | 117 | 515 |
| Share of bars at an extreme | 6.87% | 10.89% |
| Median bar volume, contracts | 12,735 | 1,098 |
| Bars with an unchanged typical price | 1.50% | 2.58% |
Overnight bars carried about a tenth of the regular-hours volume and produced extremes more often. That is the pattern you would expect when a few thin bars decide the 14-bar window. For a day trader, an MFI extreme at 3 AM ET and one at 10 AM ET are not the same signal, even if the number is identical.
Two practical adjustments follow. Read intraday MFI mainly during the liquid session, and remember that the current bar's volume is still filling in. A 5-minute bar that is two minutes old has partial volume, so the MFI on it can change before the bar closes.
MFI on daily charts for swing analysis
On daily and weekly charts used for swing analysis, StockCharts points out that daily volume is incomplete during the trading day, so volume-based scans should use the last completed close. The same applies to any daily MFI rule: an MFI checked at noon is a guess about the close.
Swing traders tend to get the most from the slower MFI signals, such as divergences and failure swings on the daily chart, because the count of false starts per month is lower. The trade-off is fewer setups: on ES daily data over two years, a 21-period MFI reached 80 on only 7 sessions.
MFI Trading Strategies That Pair It With Price
No MFI trading strategy should rely on the MFI alone. StockCharts suggests combining it with a momentum oscillator such as RSI or with chart pattern analysis. Each approach here gives the MFI one job and leaves entries to price.
MFI as a trend-continuation filter
- Condition. Price is in an uptrend you have already defined, for example higher highs and higher lows on the daily chart.
- MFI's job. A pullback where the MFI stays above 50, or above 40 if you prefer more room, suggests the pullback came on lighter money flow.
- Entry. Price, not the MFI: a reclaim of the prior bar's high or a hold of a marked support level.
- Invalidation. A close under the pullback low, or the MFI dropping through 20, which would mean heavy money flow on the decline.
The logic comes from how MFI overbought readings behave in trends: on two years of ES and NQ daily data, readings above 80 mostly came during advances that kept going. In a trend, a high MFI is a sign of strength, so this MFI strategy uses it as permission rather than as a reason to fade.
MFI as a reversal warning with structure
- Condition. The MFI reaches 80 or higher, then forms a bearish divergence or a failure swing.
- Entry. Only after price breaks a level that matters, such as the swing low between the two highs.
- Invalidation. A new price high with a new MFI high.
The MFI provides the warning; the structure break provides the trade. Without the break, a reversal "signal" in a strong trend is just a reading.
MFI with OBV and the accumulation distribution line
On-balance volume (OBV) and the accumulation/distribution line also measure volume, but differently. OBV adds or subtracts a bar's whole volume based on the close, with no price weighting and no lookback window. The accumulation/distribution line weights volume by where the close sits in the bar's range. When MFI and OBV agree, that is two different volume methods telling the same story. When they disagree, the move probably came on mixed volume, and smaller size is a reasonable response.
Related lesson: On-balance volume
Turning an MFI Reading Into a Priced MES Trade
The MFI indicator gives you context. It does not give you an entry, a stop or a position size. Those come from the chart and from arithmetic.
To make that concrete, take an illustrative long entry on the Micro E-mini S&P 500 (MES) at the ES close of 7,589.25 on September 15, 2026. The 14-day average true range (ATR) that session was 70.66 points. MES is $5 per index point with a 0.25-point tick worth $1.25. The ladder models a round turn (commission plus slippage) at 0.50 points, or $2.50 per contract, as an assumption.
| Stop distance | Stop price | Risk in points | Risk per MES | Target | Reward to risk | Break-even win rate | Round turn as share of risk | MES contracts on $1,000 risk |
|---|---|---|---|---|---|---|---|---|
| Half ATR | 7,553.92 | 35.33 | $176.65 | 7,624.58 (half ATR) | 1.0 | 50.00% | 1.42% | 5 |
| Half ATR | 7,553.92 | 35.33 | $176.65 | 7,659.91 (one ATR) | 2.0 | 33.33% | 1.42% | 5 |
| One ATR | 7,518.59 | 70.66 | $353.30 | 7,624.58 (half ATR) | 0.5 | 66.67% | 0.71% | 2 |
| One ATR | 7,518.59 | 70.66 | $353.30 | 7,659.91 (one ATR) | 1.0 | 50.00% | 0.71% | 2 |
| Two ATR | 7,447.93 | 141.32 | $706.60 | 7,624.58 (half ATR) | 0.25 | 80.00% | 0.35% | 1 |
| Two ATR | 7,447.93 | 141.32 | $706.60 | 7,659.91 (one ATR) | 0.5 | 66.67% | 0.35% | 1 |
Each break-even win rate is 1 divided by (1 + reward to risk). Each cost share is 0.50 points divided by that row's risk in points.
How MFI stop distance changes the break-even win rate
The MES ladder for an MFI-based entry makes the trade-off concrete. A half-ATR stop against a one-ATR target needs only 33.33% winners to break even, but costs eat 1.42% of the risk on every trade and the stop sits inside a normal day's range. A two-ATR stop against a half-ATR target needs 80.00% winners. That is the arithmetic behind the common complaint that wide-stop reversal trades "work most of the time" and still lose money.
Set the stop and the size before you look at the MFI reading again. If the MFI makes you want to widen the stop or add contracts, the reading has started making risk decisions it was never designed to make.
On our accounts, positions are intraday only and must be closed by 4:45 PM ET, so a daily MFI reading works as context for the next session, not as a reason to hold a multi-day swing. Size is set by contract limits rather than margin; a 50K account, for example, allows up to 4 minis or 40 micros, and funded accounts are simulated.
Related lesson: Average true range
MFI Indicator Checklist Before You Act
Use this MFI indicator checklist each time a reading tempts you to trade. The first group checks the reading itself; the second turns it into a trade plan.
Checks on the MFI reading
- Name the bucket. Was today's typical price above or below yesterday's? If you cannot say, you are reading the line, not the input.
- Check the length. Confirm the setting your platform is using. On two years of ES daily data, a 7-period MFI hit 80 or 20 about five times as often as a 14-period MFI.
- Check the levels. Make sure the MFI levels are 80 and 20, not RSI's 70 and 30, unless you chose that on purpose.
- Check the bar. On a live bar, volume is incomplete. Decide on completed bars.
- Check the session. Intraday, ask whether the 14-bar window is full of thin overnight bars.
- Name the context. Is the market trending or ranging? In a trend, an overbought MFI describes strength.
Checks before placing an MFI-based trade
- Wait for price. Treat an MFI divergence or failure swing as a warning until price breaks a level you marked in advance.
- Set the stop from structure or ATR, then size the position from the stop distance, including costs.
- Check the target only after the stop and size are fixed.
- Write the invalidation before the session, usually a close back through a level rather than a wick.
Related lesson: Position sizing
MFI Limitations and Common Mistakes
The MFI indicator inherits every weakness of RSI and adds the weaknesses of volume data.
- Extremes persist in trends. On ES, over-80 runs lasted up to 10 sessions. A rule that sells every 80 will be early, sometimes for weeks.
- The oversold side can disappear. In a rising market, ES reached 20 or lower on 2 of 489 sessions. A system that needs oversold readings may sit idle for a year.
- The bucket rule is coarse. A half-point rise on heavy volume counts as fully positive money flow. Small, noisy changes in typical price can flip large amounts of money between buckets.
- Thin volume adds noise. In this guide's 5-minute measurement on Yahoo Finance ES futures data, overnight bars traded a median of 1,098 contracts against 12,735 in regular hours, and hit MFI extremes more often.
- Partial bars mislead. A live bar's volume is still filling in, so the MFI on it can change before the close.
- Data artefacts happen. In the daily Yahoo series used here, two holiday sessions (July 4, 2025 and October 13, 2025) carried a volume figure identical to the prior session. A repeated or stale volume print distorts money flow directly, so check unusual readings against your platform's own volume.
- Continuous contracts roll. Continuous futures charts switch contracts at expiry, which can shift price and volume on the roll date. Compare the MFI on the specific contract you trade if a reading near a roll looks odd.
Why the MFI indicator cannot detect smart money
The MFI is sometimes sold as a way to see institutional or "smart money" flows. It cannot do that. Futures volume counts contracts traded, and every contract has a buyer and a seller. The MFI only records whether that volume printed on a bar where typical price rose or fell. A high MFI is consistent with large buyers, short covering, a few heavy bars on news, or a thin market. The reading alone cannot tell them apart.
Related lesson: Accumulation/distribution line
MFI Indicator FAQ
Is MFI better than RSI?
Neither is better in general; they measure different things. RSI uses the size of price changes, while MFI weights each bar by volume and sorts it by the direction of typical price. In this guide's measurement on 489 sessions of Yahoo Finance E-mini S&P 500 futures data, the two correlated at 0.700 by rank, and MFI's 80 and 20 levels fired 19 times against 50 for RSI's 70 and 30.
How do you read the Money Flow Index?
Above 50 means more money flow on up bars than down bars over the lookback; under 50 means the reverse. Readings of 80 and 20 are the standard overbought and oversold levels, and 90 and 10 are the extremes. A rising MFI mostly confirms the bar that just printed rather than forecasting the next one.
What is the best MFI setting?
The best starting MFI setting is the 14-period default, which is also the creators' recommendation. Length decides how often the levels fire: on ES over two years, a 7-period MFI reached 80 on 83 sessions, a 14-period on 17 and a 50-period on none. Choose the length by the signal frequency you want.
What indicators do institutional traders use?
Institutional traders often work with volume-weighted measures such as VWAP, but no official list of their indicators exists. CME's daily settlement procedures, for example, can use the volume-weighted average price of the settlement period. No indicator, including the MFI, reveals who is trading, so treat any claim that a line tracks "smart money" with caution.
What is the 3 5 7 rule in trading?
The 3-5-7 rule says to risk no more than 3% of the account on one trade, keep total open risk at or under 5%, and aim for winners at least 7% larger than losers. It is an informal heuristic, not an exchange or regulatory rule. Some versions treat the 7 as a profit target instead of a win-to-loss size ratio.
Is the SMA indicator available on TradingView?
Yes. TradingView's built-in Moving Average indicator is a simple moving average (SMA), the sum of the last N closes divided by N, with a default length of 9 and the close as its default source. Some platforms also smooth the MFI itself; thinkorswim's MFI study, for example, has a moving average length input.
Does the MFI indicator work on futures?
Yes, as long as the volume data is real and complete. On ES and NQ daily bars it behaved as it does on stocks: extremes clustered in trends, the oversold side was rare and the levels did not reliably predict the next session. On thin intraday bars, the volume term adds noise.
This article is for education only and is not investment advice. Futures trading uses leverage and can lose more than you expect, quickly. All measurements here are historical, based on continuous futures data and a stated method, and past behavior of an indicator does not predict future results. Evaluation and funded trading accounts are simulated, and simulated results differ from live trading.


