



TL;DR: Opening range breakout trading means taking the first move through the high or low of the session's opening minutes. The break itself is nearly certain: a 15 minute ES range broke in 48 of 49 sessions. The real decision is whether the target beats the stop, which it did in 50.0% of 15 minute ES trades. Across 48 tested configurations, 12 showed a positive mean and none was distinguishable from luck.
The setup looks simple on a chart. Mark the high and low of the first few minutes after the open, wait for price to leave that box, and go with it. Most guides stop there and attach a win rate with no sample behind it.
The hard part shows up in the session. Price pokes through the high, you are long, and ten minutes later it is back inside the box and heading for your stop. Was that a failed breakout, or noise before the real move? You need to know what the numbers say before you are in that seat.
This guide does the opposite. It measures the opening range on 49 regular hours sessions of E-mini S&P 500 (ES) and E-mini Nasdaq-100 (NQ) futures, then resolves every breakout against its stop in bar order. You get the rules, the range lengths, the entry and exit choices, the dollar cost of the stop, and an honest read on what the numbers do and do not show.
What Is an Opening Range Breakout
An opening range breakout (ORB) is an intraday setup built from two steps. First, record the highest and lowest prices traded during a fixed window right after the regular session opens, commonly the first 5, 15, 30 or 60 minutes. Second, take a position when price trades through either boundary: long above the opening range high, short below the opening range low.
The idea was popularized by Toby Crabel's 1990 book, Day Trading with Short Term Price Patterns and Opening Range Breakout, which opens with a section on opening range breakouts and reports computer-tested results for them. The logic is intuitive. The open is when overnight orders, news and the cash market's first prints collide, so the early high and low mark where buyers and sellers first agreed to disagree. A move beyond them suggests one side has won the first round.
For US index futures, the open that matters is the stock market's 9:30 AM ET start of regular trading, which runs to 4:00 PM ET. ES and NQ trade nearly around the clock, but the cash open is where volume and volatility concentrate, which is why the opening range is anchored there.
The rules are short, but the decision underneath them is not. A breakout level is a price, not a trade. It tells you nothing about whether your target arrives before your stop, and that sequence is what decides whether you made or lost money.
Related lesson: Breakout trading
How to Calculate and Plot the Opening Range
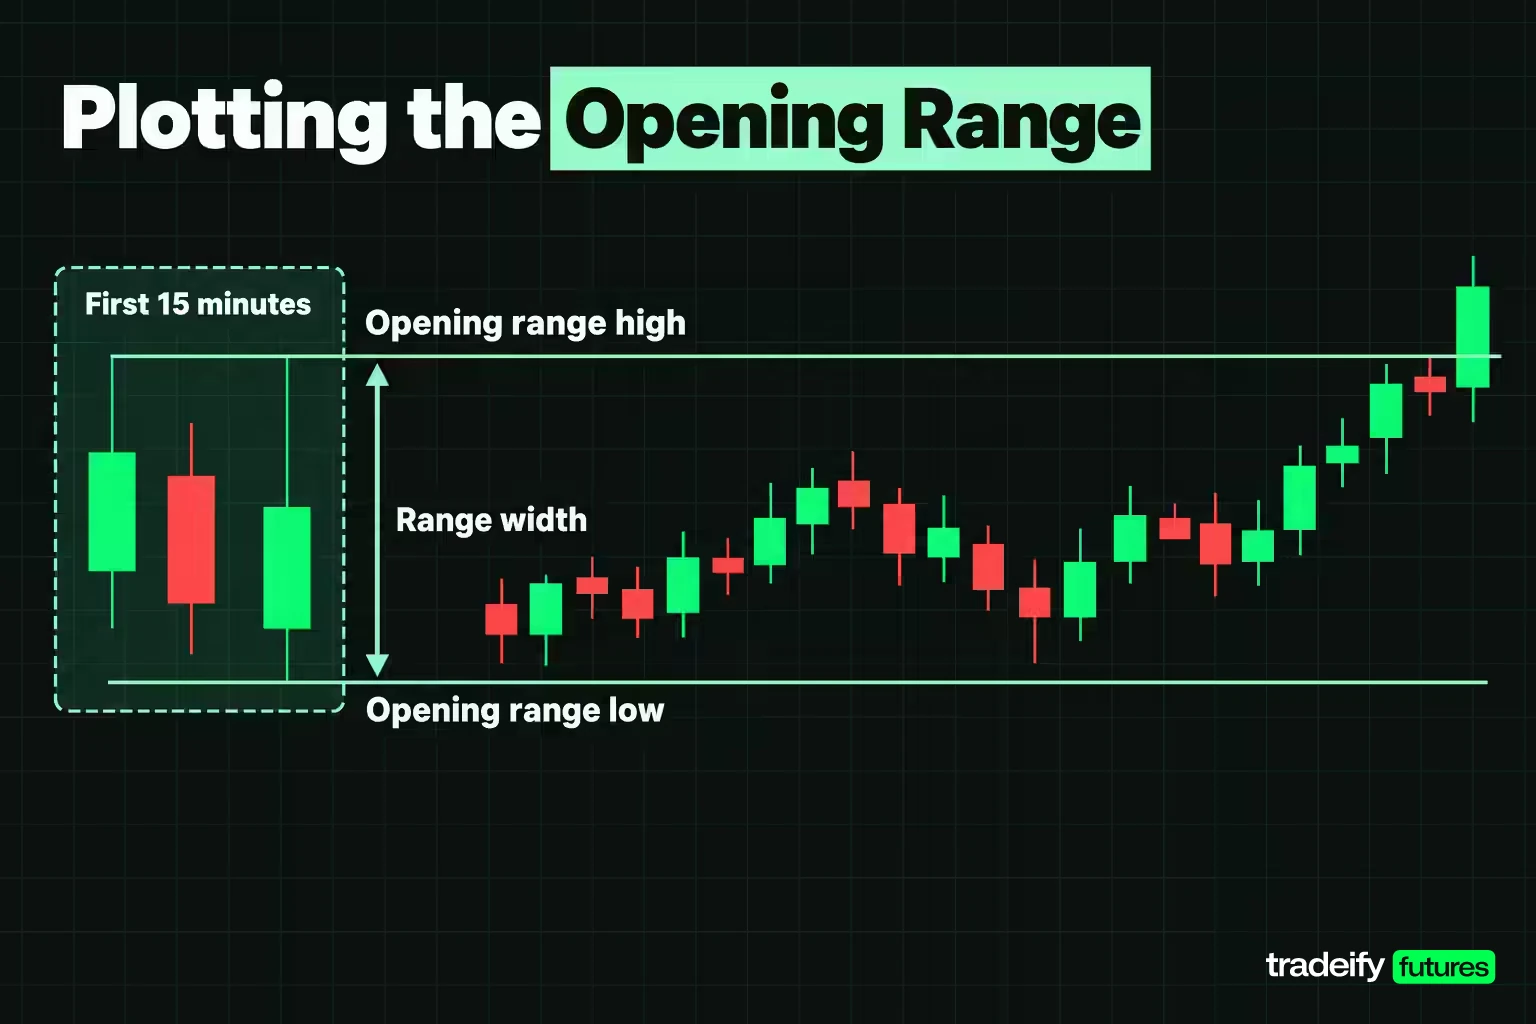
Marking an opening range takes four steps, and doing them in this order keeps the decision honest.
- Choose the range length before the session starts, for example 15 minutes.
- On a 5 minute chart, let the bars from 9:30 AM ET to the end of that window print. A 15 minute range is the first three 5 minute bars.
- Draw a horizontal line at the highest high and another at the lowest low of those bars. Those are the opening range high and low.
- Measure the width in points, then convert it to dollars on your contract and to a percentage of the opening price.
Most platforms can draw the box for you with an opening range indicator or a session high and low study. Draw it by hand a few times first, so you know exactly which bars the indicator is using.
Opening range width in points and dollars
The width step is the one most traders skip when marking an opening range, and it decides how much one trade can cost you. On ES each point is worth $50; on NQ each point is worth $20. These are the median opening range widths across 49 ES and NQ sessions from August 27, 2026 to November 4, 2026.
| Opening range length | ES median width | ES dollars per contract | ES percent of open | NQ median width | NQ dollars per contract | NQ percent of open |
|---|---|---|---|---|---|---|
| 5 minutes | 11.25 points | $562.50 | 0.145% | 87.5 points | $1,750 | 0.285% |
| 15 minutes | 15.75 points | $787.50 | 0.204% | 126.75 points | $2,535 | 0.417% |
| 30 minutes | 21.5 points | $1,075 | 0.278% | 160.75 points | $3,215 | 0.524% |
| 60 minutes | 29.75 points | $1,487.50 | 0.384% | 205.5 points | $4,110 | 0.678% |
Two things stand out in the ES and NQ width table. Width grows with time but not in proportion: the 60 minute ES range covers twelve times as many minutes as the 5 minute range but is less than three times wider, because the first minutes carry the fastest movement. And NQ's opening range is roughly twice as wide as ES's in percentage terms, so the same rule asks for very different risk on each contract.
How the 49 Session ES and NQ Opening Range Study Works
Every figure in this opening range guide comes from one illustrative study, and knowing its rules lets you judge each number on its own.
- Data. Continuous front-month ES and NQ futures, 5 minute bars from Yahoo Finance, regular hours only (9:30 AM to 4:00 PM ET).
- Window. 49 consecutive sessions per instrument, August 27, 2026 to November 4, 2026, 78 bars per session and 3,821 bars per instrument.
- Range lengths. 5, 15, 30 and 60 minutes.
- Entry. One trade per session on the first break. The default fill is a stop order at the boundary (or the bar's open if the bar opened beyond it). If the first bar to leave the range crossed both boundaries, the session is a no-trade.
- Exit. A target of 0.5, 1 or 2 range widths and a stop at the opposite boundary or at the range midpoint. When a bar could have hit both, the stop is assumed to fill first. Trades still open at 4:00 PM ET exit at the close.
- Cost. 0.5 points per round turn on both contracts, which is one 0.25 tick of slippage on each side ($25 on ES, $10 on NQ). Commissions are not included, so real results would be slightly worse.
- Uncertainty. Each configuration's trade list was resampled 5,000 times to produce a 90% interval for the mean result per trade.
Two data repairs were needed. On September 14, 2026 the continuous series switched from the September to the December contract at 11:30 AM, so that whole session uses the December contract instead. On October 30, 2026 the data feed had a gap from 2:54 to 3:02 PM ET followed by one erroneous first print about 190 ES points from the market; the 3:00 PM bar was rebuilt from the 1 minute bars after it, leaving 77 bars that day.
Forty-nine sessions is one autumn, one volatility regime and a few trend legs. Treat every number from this opening range study as a description of that window, not a forecast.
Opening Range Timeframes and How Often the Range Breaks
The opening range length is the only free parameter in the classic setup, and it changes almost everything about the trade. Here is how often each range broke during the session across 49 ES and NQ sessions (August 27 to November 4, 2026).
| Range length | ES sessions that broke | ES broke on the first bar after the range | NQ sessions that broke | NQ broke on the first bar after the range |
|---|---|---|---|---|
| 5 minutes | 46 of 49 | 37 | 47 of 49 | 41 |
| 15 minutes | 48 of 49 | 32 | 49 of 49 | 32 |
| 30 minutes | 48 of 49 | 21 | 49 of 49 | 17 |
| 60 minutes | 47 of 49 | 9 | 44 of 49 | 9 |
The shorter ranges missed a session or two only because a single bar crossed both boundaries before either was cleanly broken (3 sessions on ES and 2 on NQ at 5 minutes). Only the 60 minute range ever survived the whole day, twice on ES and five times on NQ.
So an opening range break is not a rare event to wait for. On a 15 minute ES range, 46 of 48 breaks came within 30 minutes of the range closing and all 48 within an hour. The question is never whether the range breaks. It is what the break is worth.
Opening range length and the size of the move
Measuring each move in units of the range itself shows the cost of a longer window. The table gives the median distance ES and NQ traveled with the break and against an entry at the boundary, from the break to the 4:00 PM ET close, over the same 49 sessions.
| Range length | ES move with the break | ES move against the entry | NQ move with the break | NQ move against the entry |
|---|---|---|---|---|
| 5 minutes | 2.22 widths | 1.99 widths | 1.68 widths | 1.52 widths |
| 15 minutes | 1.72 widths | 1.25 widths | 0.79 widths | 1.13 widths |
| 30 minutes | 1.03 widths | 0.96 widths | 0.76 widths | 0.81 widths |
| 60 minutes | 0.42 widths | 0.57 widths | 0.55 widths | 0.41 widths |
The favorable and adverse numbers sit close together at every length, an early sign that the direction of the opening range break was close to a coin flip over these 49 sessions. On NQ at 15 minutes the median break traveled further against the entry than with it.
Choosing an opening range length is a tradeoff, not a search for the "best" one. Short ranges break early and cheaply but more often reverse through the other side. Long ranges filter out some noise but cost more in dollars, trigger later and leave less of the day for the move. Pick the length your risk budget can hold, then test it.
Bullish and Bearish Opening Range Breakout Setups
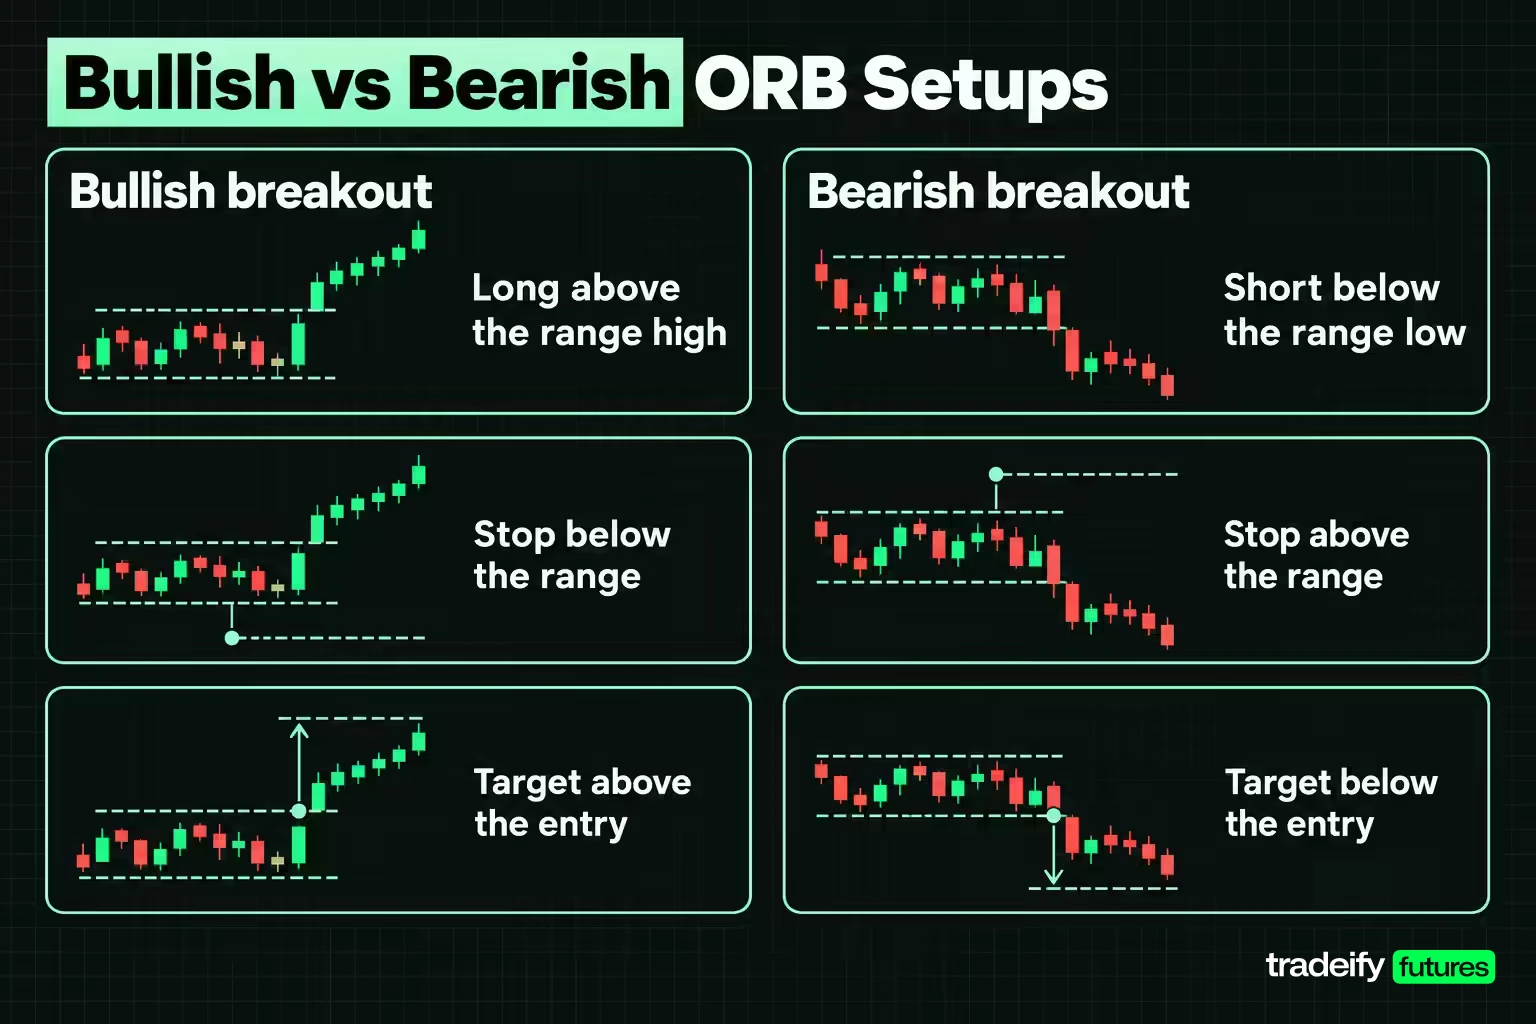
The bullish opening range breakout is a long entry when price trades above the opening range high. The stop goes below the range (the low or the midpoint) and the target sits above the entry, often a multiple of the range width.
The bearish setup mirrors it: a short entry when price trades below the opening range low, a stop above the range, and a target below the entry. Neither side needs a forecast in advance. The market's first exit from the box picks the direction, which is part of the setup's appeal.
In practice, traders identify the likely side using context they already have: where price opened relative to the prior day's range, whether there was a large overnight gap, and whether the first bars closed near their highs or lows. None of those are required by the rules, and they are the first place discretion creeps in.
Here is how each side performed across the 49 ES and NQ sessions on the 15 minute range, with target and stop both one width away.
| Instrument and side | Trades | Winning trades | Mean net points per trade |
|---|---|---|---|
| ES long | 24 | 12 | -2.14 |
| ES short | 24 | 13 | 0.56 |
| NQ long | 31 | 14 | -12.57 |
| NQ short | 18 | 7 | -23.86 |
The window included both rallies and selloffs, and ES split its breaks evenly between longs and shorts. Neither side held up on both contracts. A rule like "only take long breakouts" would be fitting this particular stretch of market, not finding a durable edge.
Opening Range Breakout Entry Rules Compared
There are three common ways to enter the break, and each trades fill rate against entry price.
- Touch entry. A buy stop resting at the range high and a sell stop at the range low. You are filled the moment the boundary trades, so you never miss a move, but you also get filled on every brief poke through the line.
- Close confirmation. Wait for a 5 minute bar to close beyond the boundary and enter at that close. It skips some false pokes, but the entry is often several points further from the stop.
- Retest entry. After a close beyond the boundary, rest a limit order back at the boundary and wait for price to return. The entry price is the best of the three, but the fill is not guaranteed and the strongest moves never come back.
Tested on 49 ES and NQ sessions (August 27 to November 4, 2026) with target and stop both one range width away, the three entries produced these mean results per trade after 0.5 points of assumed slippage.
| Range and entry | ES trades | ES mean net points | NQ trades | NQ mean net points |
|---|---|---|---|---|
| 15 minute, touch | 48 | -0.79 | 49 | -16.72 |
| 15 minute, close confirmation | 40 | -0.51 | 42 | -18.89 |
| 15 minute, retest | 33 | -3.88 | 38 | -24.11 |
| 30 minute, touch | 48 | -0.54 | 49 | 18.83 |
| 30 minute, close confirmation | 44 | -4.43 | 44 | 7.8 |
| 30 minute, retest | 39 | -3.31 | 39 | 7.87 |
No entry method ranked first everywhere. The retest, often sold as the "higher quality" entry, filled on the fewest sessions and was the weakest on the 15 minute range for both contracts, because the sessions that never came back were often the ones that ran. The close confirmation helped slightly on the 15 minute ES range and hurt badly on the 30 minute ES range.
Whichever breakout entry you choose, decide it before the open and keep it. Switching entry styles after a loss is how a trader ends up with the worst fill of each.
Related lesson: Limit orders
Breakout Level Reached Versus Reached Before the Stop
The most misleading number in opening range breakout material is "the target was reached." A level that prints later in the day says nothing about whether your stop was hit first. This table separates the two, measured for this guide on Yahoo Finance 5 minute bars across 49 ES and NQ sessions, with target and stop both one range width from a touch entry at the boundary.
| Range and instrument | Trades | Target reached at any point | Target reached before the stop | Stop hit first | Still open at the close |
|---|---|---|---|---|---|
| 15 minute ES | 48 | 34 (70.8%) | 24 (50.0%) | 20 | 4 |
| 30 minute ES | 48 | 25 (52.1%) | 20 (41.7%) | 19 | 9 |
| 15 minute NQ | 49 | 20 (40.8%) | 17 (34.7%) | 19 | 13 |
| 30 minute NQ | 49 | 19 (38.8%) | 19 (38.8%) | 12 | 18 |
In this guide's 49-session measurement of the 15 minute ES range, the target printed at some point in 70.8% of sessions but arrived before the stop in 50.0%. Of the 34 sessions that reached it, 10 (29.4%) got there only after the stop had already been taken. Someone reviewing charts after the close would count those as wins. A trader in the session was already out.
With a 1:1 target and stop, the break-even win rate is 50% before costs, so 50.0% leaves nothing to pay the slippage. That is why the 15 minute ES breakout came out at -0.79 points per trade after a 0.5 point cost assumption.
A winning ES opening range trade, bar by bar
On October 16, 2026 the 15 minute ES range ran from 7803.25 to 7780.5, a width of 22.75 points ($1,137.50 on one contract). The 9:50 AM bar traded down to 7779.75, triggering a short at 7780.5 with the stop at 7803.25 and the target at 7757.75.
| Bar time (ET) | Open | High | Low | Close | What happened |
|---|---|---|---|---|---|
| 9:30 AM | 7802.75 | 7803.25 | 7792.5 | 7792.75 | Range high set |
| 9:35 AM | 7792.75 | 7795.25 | 7784.0 | 7787.0 | Inside the range |
| 9:40 AM | 7787.0 | 7792.5 | 7780.5 | 7792.0 | Range low set, range closes |
| 9:50 AM | 7792.25 | 7793.25 | 7779.75 | 7786.0 | Breaks the low, short at 7780.5 |
| 10:50 AM | 7795.0 | 7796.5 | 7781.25 | 7782.5 | Worst point, 6.75 points from the stop |
| 11:05 AM | 7780.5 | 7781.5 | 7767.0 | 7767.75 | Move resumes |
| 11:20 AM | 7766.25 | 7770.0 | 7754.0 | 7759.25 | Target at 7757.75 filled |
The trade made 22.75 points, $1,137.50 gross or $1,112.50 after 0.5 points of assumed slippage. Look at the path, though. For an hour after the entry, price drifted back inside the range, and at 10:50 AM it rallied 16 points against the short, ending 6.75 points from the stop. The session eventually closed at 7703.0, 77.5 points below the entry. The winning breakout spent most of its first hour looking like a failed one. Holding it meant sitting through that without moving the stop.
Failed Opening Range Breakouts and How to Handle Them
A failed opening range breakout is a break that reverses and hits the stop. On the 15 minute ES range over 49 sessions (August 27 to November 4, 2026), with target and stop one width away, 20 of 48 trades did exactly that. The most painful version is the one where the market later goes exactly where you expected.
On September 24, 2026 the 15 minute ES range ran from 7744.75 to 7730.0, 14.75 points wide ($737.50). The 9:45 AM bar traded up to 7747.75, filling a long at 7744.75 with the stop at 7730.0 and the target at 7759.5. At 10:05 AM the high reached 7758.0, just 1.5 points short of the target. Then price faded for an hour, and the 11:10 AM bar traded down to 7725.25, stopping the trade for -14.75 points (-$737.50). At 12:15 PM the market ripped to 7778.0, straight through the target, and closed at 7765.25.
The direction read was right, and the trade still lost. Reading direction and getting a valid trade are two different decisions, and this breakout setup only pays for the second.
Rules for handling a failed breakout
- Accept the stop as the answer. Once the opposite boundary trades, the opening range breakout thesis for that side is invalidated. Re-entering the same direction because "it should still go" turns one planned loss into two unplanned ones.
- Decide on a reversal rule in advance, or not at all. Some traders flip to the other side when the opposite boundary breaks. That is a separate setup with its own stop and needs its own test, not an improvised response to a loss.
- Log both events. Record whether the target was later reached after you were stopped. Over many sessions, that count tells you whether your stop is too tight for the range length you trade.
- Do not widen the stop mid-trade. Moving it past the opposite boundary to avoid the loss changes the risk you sized for.
Opening Range Stop Placement and Risk Management
The two common opening range breakout stop placements are the opposite boundary and the midpoint of the range. The opposite boundary gives the trade a full range width of room. The midpoint halves the risk, which lets you trade more size for the same dollars, but it sits inside the noise that the opening minutes just printed.
Tested for this guide on Yahoo Finance 5 minute bars, using the 15 minute range across 49 ES and NQ sessions with a one width target, the tighter stop did worse on both contracts.
| Stop placement | ES target reached first | ES mean net points | NQ target reached first | NQ mean net points |
|---|---|---|---|---|
| Opposite boundary | 24 of 48 (50.0%) | -0.79 | 17 of 49 | -16.72 |
| Range midpoint | 12 of 48 (25.0%) | -3.07 | 10 of 49 | -25.4 |
In that 49-session test, the midpoint stop cut the risk in half but also cut the share of ES trades that reached the target first in half, from 50.0% to 25.0%. A tighter stop looks better on paper and then gets hit far more often, because the opening minutes are exactly when price swings the hardest.
Risk management for an opening range breakout comes down to three decisions made before the open: where the stop goes, what reward-to-risk ratio the target gives, and the win rate that ratio needs to break even. At 1:1 that win rate is 50% before costs; at 2:1 it is about 33%. If your measured rate is not clearly above the break-even line, the setup is not paying for its slippage.
Related lesson: Stop-loss orders and placement
Position Sizing an Opening Range Trade in Dollars
Opening range position sizing is awkward because the stop distance changes every session with the range width. A fixed number of contracts means a different dollar risk every day. This is the dollar cost of a 15 minute range stop at the opposite boundary, on one contract, across 49 ES and NQ sessions.
| Contract | Median stop cost | Smallest | Largest | Sessions over $1,000 |
|---|---|---|---|---|
| ES | $787.50 | $387.50 | $2,587.50 | 13 of 49 |
| NQ | $2,535 | $935 | $8,075 | 47 of 49 |
Turn it around and the problem is clearer. A $1,000 risk budget holds a 20 point stop on one ES contract and a 50 point stop on one NQ contract. The median 15 minute ES range is 15.75 points, so one ES usually fits. The median NQ range is 126.75 points, so one NQ almost never does.
Micro contracts solve most of this. The Micro E-mini S&P 500 (MES) is worth $5 per point and the Micro E-mini Nasdaq-100 (MNQ) $2 per point. The median 15 minute range costs $78.75 on one MES and $253.50 on one MNQ, which lets you size by contract count instead of moving the stop to fit.
The rule is simple. Measure the range, convert the stop to dollars, then set the contract count from your budget. Never set the stop from the budget, because a stop placed to fit your account rather than the range sits wherever the market happens to be noisy.
Related lesson: Position sizing
Opening Range Breakout Exits and Profit Targets
Opening range breakout exits usually take one of three forms:
- Range-width targets. A target set at a multiple of the range width (0.5, 1 or 2 widths), which scales with the day's volatility.
- Time exit. Close the position at a fixed time, often the end of the regular session, whatever the price.
- Trailing exit. Move the stop behind price, for example to the boundary or the prior bar's low, once the trade moves a set distance.
A 49-session ES and NQ test combined the first two, closing every trade that hit neither target nor stop at 4:00 PM ET. Here is how target size changed the result on the 15 minute range with the stop at the opposite boundary.
| Target size | ES target first | ES mean net points | NQ target first | NQ mean net points |
|---|---|---|---|---|
| 0.5 width | 32 of 48 | -1.15 | 25 of 49 | -22.42 |
| 1 width | 24 of 48 | -0.79 | 17 of 49 | -16.72 |
| 2 widths | 12 of 48 | -2.42 | 6 of 49 | -32.34 |
A smaller target raised the hit rate, as it always does, but the smaller wins did not cover the full-size losses. A 2 width target was reached first on only 12 ES sessions, with 10 trades still open at the close. No target size turned the 15 minute setup positive on either contract.
The October 16, 2026 ES session shows the cost of a fixed target. A short from 7780.5 exited at its 7757.75 target while the session went on to close at 7703.0, 77.5 points below the entry. A trailing exit would have captured more on that day and given back more on the days that reversed. Test a trailing exit as its own configuration rather than switching to it after one big runner.
Indicators and Filters for Opening Range Breakouts
Most opening range guides recommend filters: skip big gap days, skip wide ranges, require volume or a VWAP alignment, or stop taking signals after a set time. Three of those were tested on 49 ES and NQ sessions (August 27 to November 4, 2026) using the 15 minute range with target and stop both one width away.
Overnight gap filter. The gap is the 9:30 AM open measured against the prior session's 4:00 PM close (September 14 is left out because the contract switched that day). The median absolute gap was 0.274% on ES and 0.458% on NQ.
| Filter split | ES sessions | ES mean net points | NQ sessions | NQ mean net points |
|---|---|---|---|---|
| Gap over 0.5% | 11 | -8.61 | 21 | -28.51 |
| Gap of 0.5% or less | 35 | 0.75 | 26 | -5.68 |
| Range narrower than the median | 24 | 1.31 | 25 | -10.38 |
| Range wider than the median | 24 | -2.89 | 24 | -23.32 |
Both splits pointed the same way on both contracts in this window: big-gap sessions and wide-range sessions did worse for the breakout. On ES, narrow ranges produced a median move of 2.08 widths with the break against 1.16 for wide ones; on NQ it was 1.02 against 0.49.
That looks like a filter. Be careful anyway. The split was chosen after looking at the data, the subsets hold only 11 to 35 trades, and the NQ result stayed negative even in the "good" half. A popular 0.5% width cap would have removed just one ES trade (47 of 48 kept, mean -0.59) and left NQ negative (34 of 49 kept, mean -21.6). A filter that improves one sample is a hypothesis to test on the next one.
Time, volume and VWAP filters for the opening range
Time cutoff. On the same 49 ES and NQ sessions, a cutoff such as "no new entries after 10:30 AM" barely binds on a 15 minute range: 47 of 48 ES breaks and 47 of 49 NQ breaks had already happened by then.
Volume and VWAP. Relative volume on the breakout bar and price's position against VWAP are common quality checks. They were not tested here, so treat them the same way: a reasonable idea that needs its own measured sample before it becomes a rule.
Related lesson: Gap trading strategies
Opening Range Breakout Variations
The classic opening range breakout is a stop entry at either boundary of a fixed early window. Most opening range variations change one element of that:
- Range length variations. The 5 minute ORB, the 15 and 30 minute versions and the first-hour range are the same setup with different windows, and they behave differently enough to be treated as separate strategies.
- Entry variations. Close-confirmed and retest entries trade later or at a better price in exchange for missed fills.
- One-and-done versus two-sided. One-and-done takes only the first break each session. A two-sided version also takes the opposite break if the first fails, which turns a failed breakout into a reversal trade.
- Gap-filtered ORB. Trades the break only on days with a small overnight gap, or only in the direction of the gap.
- Pre-market or overnight range. Some futures traders use the overnight high and low instead of the post-open range. That is a different set of levels with different behavior.
An opening range breakout is not the same as a "gap and go." A gap and go depends on an overnight gap and on price continuing away from the prior close. The ORB depends only on the first minutes of the regular session and fires on days with no gap at all.
Related lesson: Range trading
Best Markets for an Opening Range Breakout
An opening range breakout needs three things from a market: a clear session open, enough early volume for the range to mean something, and tight spreads so the stop entry does not slip badly. Liquid equity index futures fit all three, which is why ES and NQ are the standard test cases.
They are not interchangeable, though. Across 49 sessions from August 27 to November 4, 2026, the median 15 minute range was 0.204% of the open on ES and 0.417% on NQ, and the median move with the break was 1.72 range widths on ES against 0.79 on NQ. NQ's opening range was wider and its breaks traveled less in proportion to their own width. Treating NQ as "ES with bigger numbers" is a common error.
For single stocks, the opening range approach changes. Traders usually build a watchlist before the open by screening for stocks with a gap, unusual pre-market volume and a news catalyst, then apply the opening range rules only to the names that pass. Stocks carry single-name news risk and wider spreads, so the futures figures here should not be transferred to them without separate testing.
Other futures such as crude oil and gold have their own reference opens and session patterns. Check the exchange's trading hours before deciding which open defines the range.
Backtesting an Opening Range Breakout and What to Expect
The full opening range breakout test combined four range lengths, three targets and two stop placements: 24 configurations per contract, 48 in total, each run across 49 ES and NQ sessions (August 27 to November 4, 2026) with 0.5 points of assumed slippage deducted from every trade.
| Configuration | Trades | Mean net points per trade | 90% interval | Profit factor |
|---|---|---|---|---|
| ES 15 minute, 1 width target, opposite stop | 48 | -0.79 | -4.55 to 2.96 | 0.9 |
| ES 30 minute, 0.5 width target, opposite stop | 48 | 1.03 | -2.39 to 4.42 | 1.17 |
| NQ 15 minute, 1 width target, opposite stop | 49 | -16.72 | -43.36 to 10.92 | 0.73 |
| NQ 30 minute, 1 width target, opposite stop | 49 | 18.83 | -13.32 to 51.65 | 1.35 |
| NQ 60 minute, 1 width target, midpoint stop | 44 | 22.46 | -11.84 to 57.17 | 1.48 |
Of the 48 configurations, 12 produced a positive mean: 2 of 24 on ES and 10 of 24 on NQ. All six NQ 60 minute configurations were positive, with means from 19.61 to 22.46 points. Not one of the 48 had a 90% interval that stayed above zero.
That is the honest read. With 44 to 49 trades per configuration and wide session-to-session swings, a positive average in one ten-week window is what chance alone often produces. Testing 48 versions and picking the best one makes it more likely, not less. The NQ 60 minute result is worth re-testing on a longer history, not trading on this evidence.
How to backtest your own opening range rules
- Fix every rule before looking at results: range length, entry, stop, target, cost and the treatment of bars that touch both target and stop.
- Use at least several hundred sessions across different volatility regimes, not one quarter.
- Report the share of sessions where the target arrived before the stop, not just whether it was reached.
- Put an interval on the mean. A positive average whose interval spans zero is not evidence of an edge.
- Hold back a later stretch of data that you only test once, after the rules are final.
Published opening range win rates rarely state the entry, stop, target or sample behind them. Expect your own numbers to land near break-even before costs until a long, out-of-sample test says otherwise.
Related lesson: Backtesting a trading strategy
Opening Range Breakout Pros and Cons
The opening range breakout has real strengths:
- Clear, objective levels. Two prices define the setup, so entries and stops are not open to interpretation.
- Fast feedback. Most breaks happen within the first hour, and the trade usually resolves the same morning.
- Built-in invalidation. The opposite boundary is a natural stop that reflects the day's actual volatility.
- Easy to test. Every rule can be written down and measured on historical bars.
It also has clear limitations:
- Near coin-flip direction. Across 49 ES and NQ sessions, median moves with and against the break were close at every range length.
- Variable dollar risk. The stop cost on one NQ contract ranged from $935 to $8,075 across 49 sessions.
- Whipsaw. In this guide's 49-session ES measurement of the 15 minute range, 29 of 48 breaks traded back through the opposite boundary at some point in the session.
- Sensitivity to settings. Small changes in range length, entry or stop flipped results from negative to positive, which points to noise rather than edge.
Common Opening Range Breakout Mistakes
- Judging the setup by whether the level printed. In this guide's 49-session ES test, a one width target on the 15 minute ES range was reached in 70.8% of sessions but before the stop in only 50.0%. Grade trades by arrival order.
- Sizing by contracts instead of dollars. A fixed one-contract NQ trade risked anything from $935 to $8,075 on the opposite-boundary stop. Convert the range to dollars first.
- Tightening the stop to afford the trade. On the 15 minute ES range, a midpoint stop halved the risk and halved the share of trades that reached the target first.
- Choosing the range length after the open. Picking the length that "looks right" today is curve fitting in real time. Decide it the night before.
- Adding filters after a losing streak. Every filter needs its own test. Stacking untested filters shrinks the sample until any result looks meaningful.
- Treating NQ like ES. Over 49 sessions, NQ's 15 minute range was about twice as wide as ES's in percentage terms and its breaks traveled less relative to the range.
- Chasing a missed entry. If the stop order was not working when the boundary broke, the next price is a different trade with a different stop distance.
- Re-entering after the stop in the same direction. That doubles the day's risk on a thesis the market has just rejected.
An Opening Range Checklist Before the Open
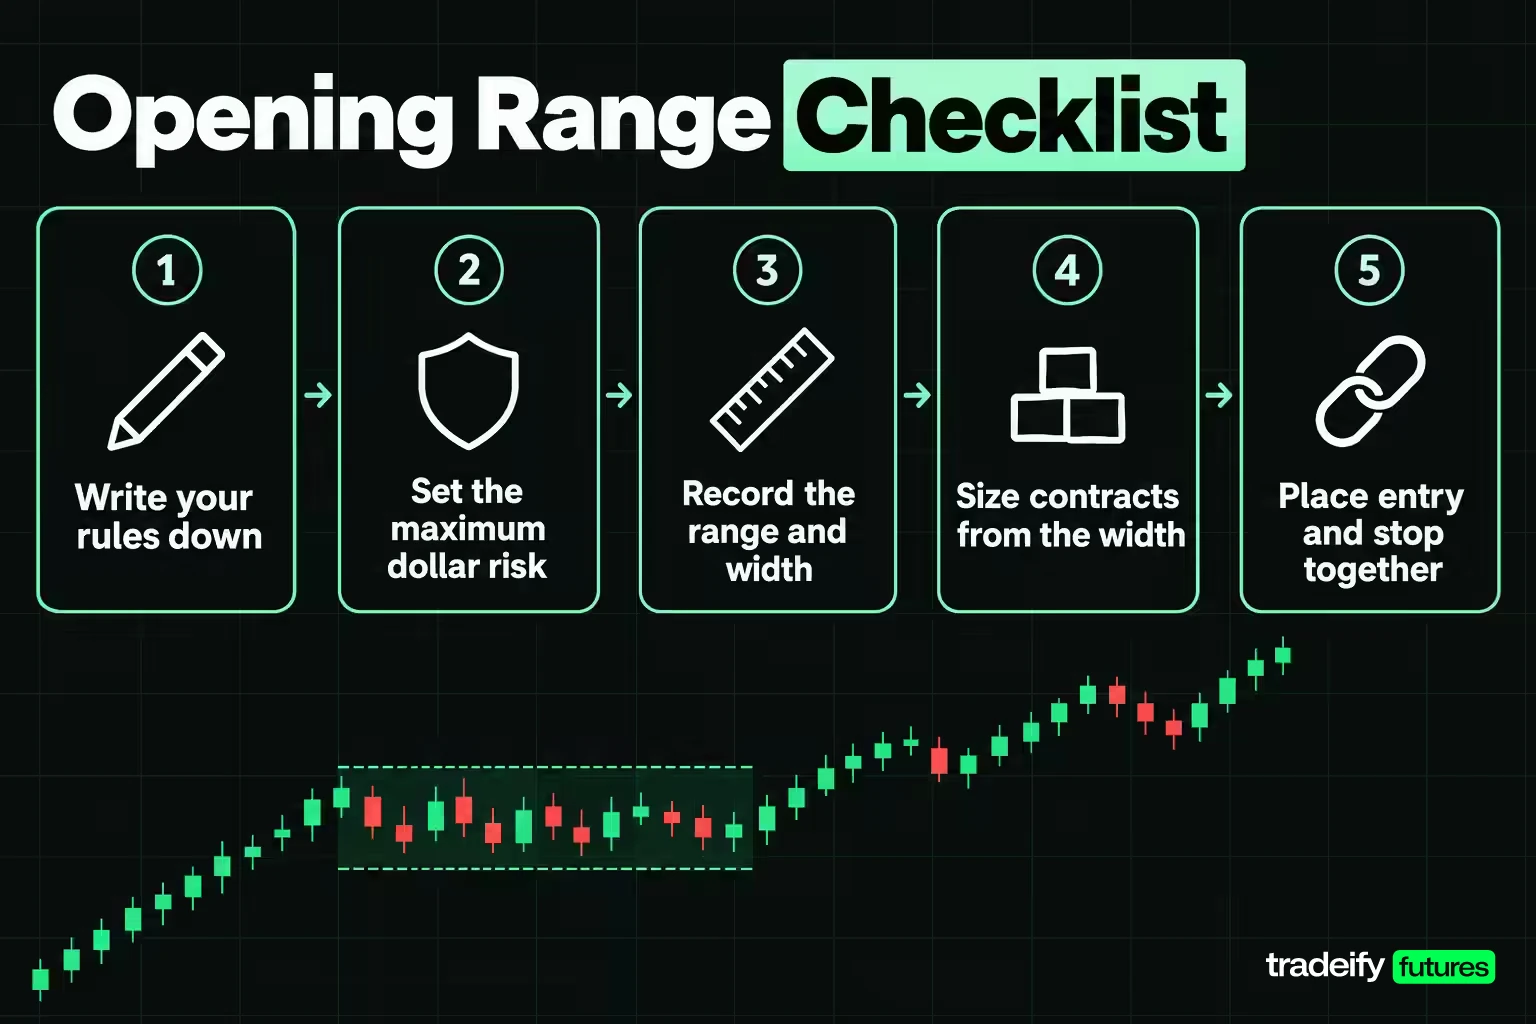
Run this opening range routine before 9:30 AM ET, not after the first break.
- Write down the range length, entry method, stop placement and target in range widths.
- Decide the maximum dollar risk for the trade.
- When the range closes, record the two boundary prices and the width in points.
- Convert the width to dollars per contract and set the contract count from your budget, using micros when one full-size contract does not fit.
- Place the entry and stop orders together so a fast break does not leave you unprotected.
- If the trade stops out, log whether the target was reached later. Do not re-enter the same side.
- Review the log after at least 50 sessions before changing any rule.
On our accounts, ES and NQ and their micros MES and MNQ are all on the supported product list, every position has to be closed by 4:45 PM ET, and a 50K account can hold up to 4 minis or 40 micros. A 50K Growth evaluation also carries a $1,250 daily loss limit. Set the median NQ 15 minute stop from this sample, $2,535 on one contract, beside that limit and the sizing answer is micros: the same stop on one MNQ is about $253.50.
Opening Range Breakout FAQ
What is an opening range breakout?
An opening range breakout is an intraday setup that marks the high and low of the first minutes of the regular session, often the first 5, 15, 30 or 60 minutes. A trade is taken when price moves through either boundary, long above the high or short below the low. The opposite boundary or the range midpoint is the usual stop.
What is the best opening range length?
No opening range length was best on both ES and NQ in a 49-session test. Shorter ranges broke almost every day and cost less, but reversed through the other side more often. Choose the length whose dollar stop your budget can hold, then test it over a long sample.
What is the success rate of opening range breakout trades?
In this guide's 49-session ES test, a 15 minute opening range trade with a 1:1 target and stop hit its target before its stop 50.0% of the time. The same target was reached at some point in 70.8% of sessions, so the answer depends on what you count. Any published win rate without the entry, stop, target and sample behind it is hard to use.
Does an opening range breakout work on ES and NQ?
The setup triggers on both, but it behaved differently on each. In a 49-session test from August 27 to November 4, 2026, NQ's 15 minute range averaged about twice ES's width in percentage terms, and its breaks traveled less relative to that width. None of the 48 ES and NQ configurations tested showed an edge distinguishable from chance over 49 sessions.
Should you wait for a close beyond the opening range?
Not as a rule: waiting for a 5 minute close beyond the boundary skips some false breaks but gives a worse entry price. In this guide's 49-session test it was slightly better than a touch entry on the 15 minute ES range and much worse on the 30 minute ES range. Pick one method in advance and test it on your own market.
How do you find opening range breakout stocks?
Stock traders usually screen before the open for names with a gap, high pre-market volume and a clear news catalyst. They then apply the opening range rules only to those names. Single stocks behave differently from index futures, so test the rules separately.
Trading futures involves substantial risk of loss and is not suitable for everyone. Futures are leveraged, so losses can exceed what you expect, and a stop order can fill worse than its price in a fast market. The figures in this guide come from one historical 49-session sample of ES and NQ futures and are educational illustrations, not a forecast or a recommendation to trade any setup or size. Evaluation and funded accounts are simulated, and simulated results do not reflect every condition of live markets. Nothing here is investment advice.


