



TL;DR: Range trading means selling the top of a price box and buying the bottom until the box stops holding. On 47 sessions of 5 minute ES and NQ bars, the 30 minute opening range was touched every session and broke on most. No fade or breakout stop width produced a result clearly above zero. The stop width decided single trades more than the entry did, so size it to the instrument.
Range trading is usually taught in one line: buy support, sell resistance, repeat until the range breaks. Simple, but not easy. The box on your chart is drawn after the fact. What you face in real time is a live boundary, a limit order resting at it, and a question nobody can answer in advance: is this the touch that holds, or the touch that breaks?
This guide covers the definitions and the standard strategies, then measures what most range trading guides skip. How long does an intraday range survive on E-mini S&P 500 (ES) and E-mini Nasdaq-100 (NQ) futures? What does a boundary touch tend to pay, and what does it cost in heat? And does the classic fade beat the breakout once costs are included?
What Is Range Trading
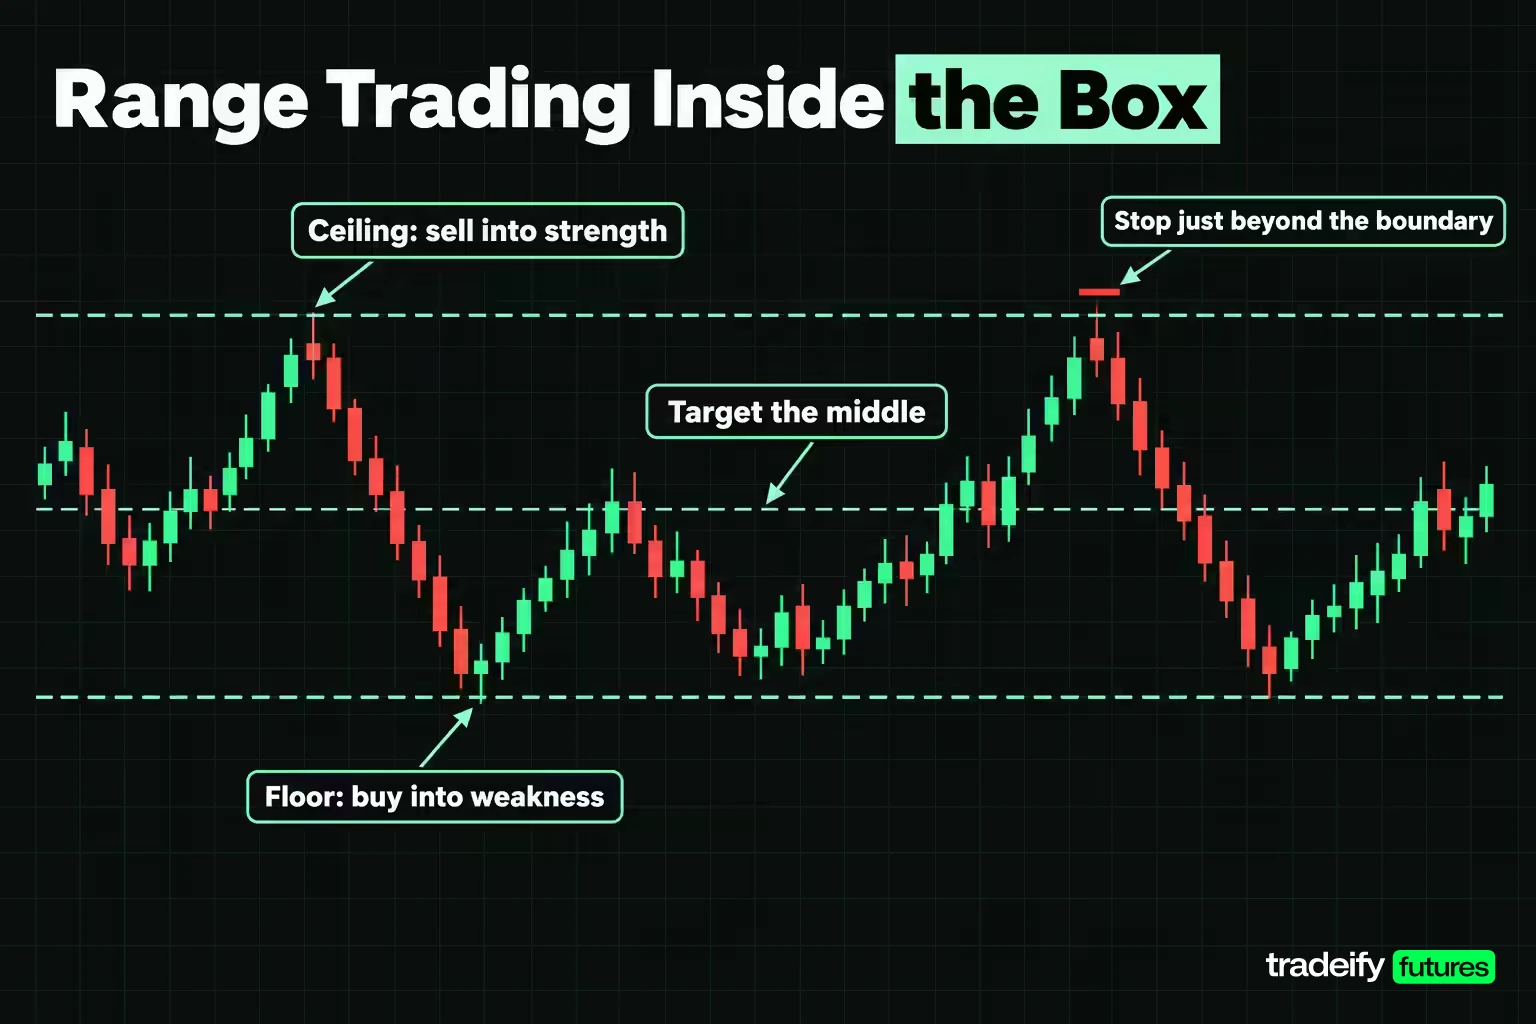
Range trading is a strategy that treats a sideways market as a box with a ceiling and a floor, and trades toward the middle of that box from its edges. A trading range forms when price visits a high and a low more than once without making progress beyond either. Sellers absorb buying near the top, buyers absorb selling near the bottom, and price keeps rotating between levels it has already tested.
A ranging market is the opposite of a trending one. In a trend, each push makes a new high or low and pullbacks are bought or sold. In a range, pushes fail and price returns to where it came from. StockCharts describes the classic version, the rectangle, as two comparable highs and two comparable lows joined by parallel lines, and notes the pattern also goes by the names trading range, consolidation zone and congestion area.
Three mechanics separate range trading from trend and breakout trading:
- The entry is a limit order into the edge. A range trader sells into strength at the top or buys into weakness at the bottom, instead of using a stop order to chase a move out of the box.
- The invalidation sits just beyond the boundary. That makes the stop cheap, right up until the boundary stops mattering.
- The holding time is short. The trade has to reach the middle or the far side before the box breaks, and most intraday boxes do break.
That third point is where the arithmetic bites, and it is measurable on real futures bars.
Related lesson: Support and resistance
How to Identify a Trading Range
Identifying a trading range starts with touches, not with lines. A level becomes a boundary after price reverses from it more than once. One reversal is a swing high. Two reversals at roughly the same price, with a reversal at the opposite side in between, start to look like a range.
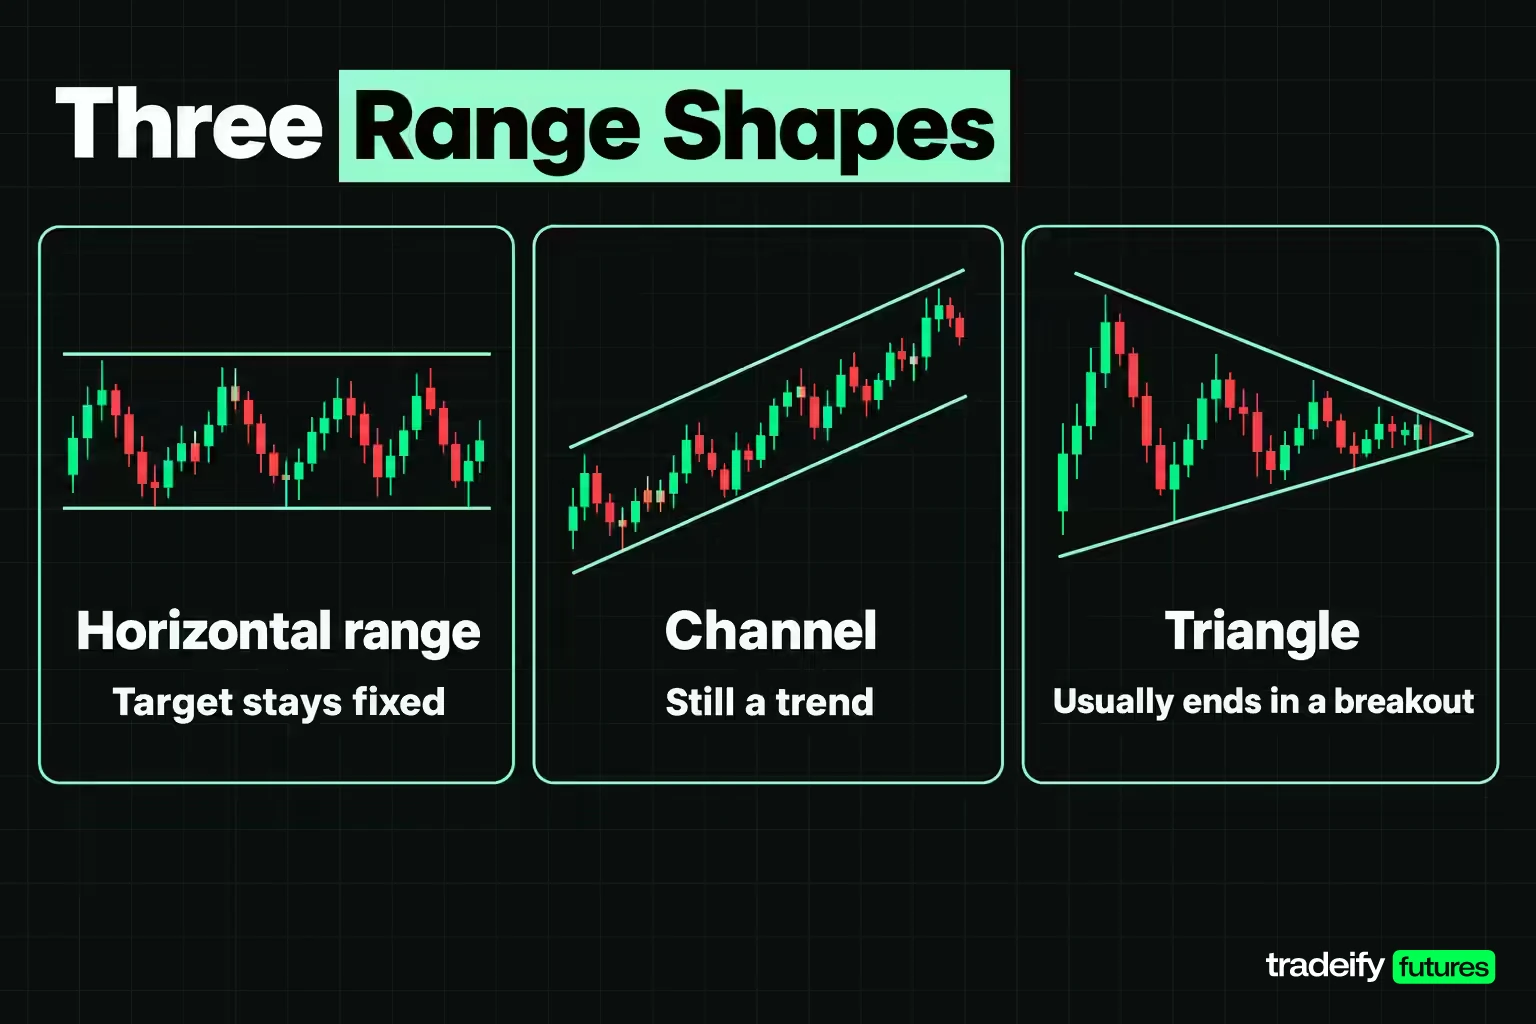
Ranges come in three common shapes:
- Horizontal range (rectangle). Flat top, flat bottom. The cleanest shape for range trading because the target, the opposite boundary, does not move.
- Channel. Parallel sloping lines. A rising channel is still a trend; trading its lower edge long is closer to buying pullbacks than to range trading.
- Triangle. Converging lines. The box shrinks with each swing, so the room between entry and target shrinks too. Triangles usually end in a breakout, which makes them poor candidates for repeated fades.
Telling a ranging market from a trending one
A few checks help separate a real range from a pause inside a trend:
- Failed pushes. In a range, a new high gets sold back below the prior high quickly. In a trend, the new high holds and becomes support.
- The higher timeframe. A 5 minute range inside a strong daily trend often resolves in the direction of the daily move.
- The slope of a moving average through the box. A flat average suggests rotation; a steep one suggests a pause.
- A trend-strength reading. On the Average Directional Index (ADX), Welles Wilder treated readings below 20 as no trend and above 25 as a strong trend, per StockCharts' summary of his work.
Each check is an observation, not confirmation. A range is only confirmed in hindsight, which is why the stop matters more than the drawing.
The clock window box used in the measurement
Hand-drawn boxes are hard to test because two traders draw them differently. The measurement in this guide uses a clock window instead: the high and low of a fixed time slice, such as the first 30 minutes after the 9:30 AM ET open. A clock box is not a better range than a hand-drawn one. It is a box that can be counted the same way on every session, which is what a test needs.
Related lesson: Rectangles and trading ranges
How the Range Trading Study Was Measured
The range trading study uses five minute bars on two futures markets, E-mini S&P 500 (ES) and E-mini Nasdaq-100 (NQ), taken from Yahoo Finance's continuous front-month series on November 4, 2026. Only the NYSE core session, 9:30 AM to 4:00 PM ET, is used, which is 78 five minute bars per session. Forty-seven sessions were usable on both markets, from August 27, 2026 to November 4, 2026, so 3,666 bars per market. October 30 was dropped because its bar set was incomplete, and September 14 because the continuous series switched contract months in the middle of that session.
The definitions:
- Box. The high and low of a clock window: the first 30, 60 or 90 minutes of the session, or a later window such as 10:00 to 11:00 AM ET.
- Touch. The first bar after the window whose high or low reaches a boundary.
- Close beyond. Any later bar that closes outside the box.
- Held inside to the close. No bar after the window closes outside the box for the rest of the session.
- Trades. Entries fill at the boundary on the touch bar. When a bar reaches both the stop and the target, the stop is counted first, because a five minute bar does not reveal which came first. Trades still open at 4:00 PM ET close at the last price.
- Costs. An assumed round-turn cost of 0.35 ES points ($17.50) and 0.50 NQ points ($10.00), roughly one tick of slippage plus commission, is subtracted from every trade.
- Uncertainty. Each trade list is resampled 5,000 times to give a 90% bootstrap interval for the mean result. An interval that includes zero means the sample cannot tell the result apart from noise.
Point values come from CME's contract specifications: ES is $50 per index point and NQ is $20 per index point. A ten year daily series, 2,514 sessions per market from November 7, 2016 to November 4, 2026, provides the longer view.
Forty-seven sessions is a short sample. Every intraday figure here describes that sample and nothing more, and none of it is a trading result.
How Long an Opening Range Survives
The opening range is the first box most intraday traders see, so it is the natural test of whether a range holds. On ES and NQ five minute bars from August 27 to November 4, 2026, it rarely held for long.
| Opening range | Market | Median width (points) | Touched after forming | Closed beyond | Held inside to the close | Median first touch (ET) |
|---|---|---|---|---|---|---|
| First 30 minutes | ES | 21.5 | 100% | 100% | 0% | 10:00 AM |
| First 30 minutes | NQ | 159 | 100% | 95.7% | 4.3% | 10:05 AM |
| First 60 minutes | ES | 29.75 | 95.7% | 91.5% | 8.5% | 10:40 AM |
| First 60 minutes | NQ | 203.5 | 89.4% | 85.1% | 14.9% | 10:50 AM |
| First 90 minutes | ES | 34.25 | 89.4% | 85.1% | 14.9% | 11:10 to 11:15 AM |
| First 90 minutes | NQ | 217.5 | 78.7% | 76.6% | 23.4% | 11:10 AM |
In this guide's own measurement, the 30 minute ES opening range was closed beyond on 47 of 47 sessions. It was touched before 11:00 AM ET on 97.9% of ES sessions and 91.5% of NQ sessions. Read plainly, the first half hour is not a box that holds. It is a launch pad, and a boundary touch inside the first hour is close to certain.
Widening the box helps, but not by as much as the extra time suggests. In the same ES and NQ study, a 90 minute ES opening range held inside to the close on 14.9% of sessions, roughly one session in seven, and its median width grew from 21.5 points to 34.25 points. On NQ the 90 minute box held on 23.4% of sessions.
So if you want a range to fade intraday, the opening range on its own is a poor candidate. A box that breaks on nearly every session hands the fade trader the losing side of that break on most days, unless the stop and the exit plan were built for it before the touch.
Related lesson: Opening range breakout
Range Trading Entry and Exit at the Boundary
Range trading entries and exits live or die at the boundary, and the boundary produces two different events: the touch and the close beyond. Treating them as one event is the most common range trading mistake.
On the 30 minute opening range, both events happened on nearly every ES session in this guide's 47-session study. What keeps a fade alive is that price can go outside and come back. After the first five minute close outside the ES opening range, an average of 33.7% of the session's remaining bars still closed back inside the box. On NQ the figure was 37.6%. That rotation is what a range trader harvests, and it is why the stop has to survive the first excursion.
Reward and heat after the first touch
The excursion after the first touch shows the trade's real shape. Favorable excursion is how far price moved back toward the middle of the box after the touch; adverse excursion, or heat, is how far it pushed beyond the boundary. Both are measured from the touch to the 4:00 PM ET close, on the 30 minute opening range.
| Market | Touches measured | Median favorable excursion | Median adverse excursion | Heat larger than reward |
|---|---|---|---|---|
| ES | 46 | 22.50 points ($1,125.00) | 16.75 points ($837.50) | 47.8% |
| NQ | 47 | 139.00 points ($2,780.00) | 94.25 points ($1,885.00) | 44.7% |
The dollar figures are per contract at $50 per ES point and $20 per NQ point. One ES session was left out because a single bar reached both boundaries, so the side touched first is unknown.
In this guide's ES measurement, heat was larger than reward on 47.8% of touches. Which one shows up first is close to a coin flip, and the median fade had 16.75 points of heat to sit through. That is not a reason to avoid ranges. It is the reason stop width decides the outcome more than the entry price does: the entry tells you where you are wrong, the stop tells you whether you get to find out.
Where entries and exits go
- Entry. A limit order at or just inside the boundary, placed before the touch. Missing the touch does not make the next price a good entry. Chasing a bounce that already happened gives you a worse price with the same stop.
- Stop. Beyond the boundary by more than the instrument's normal noise. On ES a median 16.75 points of heat after the first touch means a 4 point stop beyond a 21.5 point box sits inside ordinary movement.
- First target. The middle of the box. It is reached more often than the far side and lets a trader reduce size before the trade has to prove itself.
- Final target. The opposite boundary, minus a tick or two, because the far edge is where other range traders are selling or buying against you.
- Time exit. If the trade has not reached the middle by a chosen time, exit. A box that is not rotating is often getting ready to break.
Range Trading Strategies
Range trading strategies all start from the same box but disagree about what the boundary means. The three most common, plus one way of filtering them, cover most of what traders actually do.
Fading the boundary
The classic range strategy sells at resistance and buys at support, with a stop just beyond the edge and a target at the middle or the far side. It works when the box keeps rotating and fails when the box breaks. It needs patience, because the best fade entries come at the edge and nowhere else; an entry in the middle of the box has no nearby invalidation and no room to the target.
Trading the breakout when the range fails
A breakout trader takes the other side of the same boundary: buy above the top or sell below the bottom, expecting the range to expand. Breakouts accept a worse fill for confirmation that price has left the box. The common failure is the false breakout, a push outside that reverses back in, which is exactly what the range trader is betting on.
The failed breakout back into the range
A hybrid waits for price to break out, then trades back toward the middle once a bar closes back inside the box. It gives up the best fade price in exchange for evidence that the breakout failed. The stop goes beyond the extreme of the failed push, which is usually wider than a plain fade stop.
Multi-timeframe range context
Many traders use a higher timeframe to choose which side of a lower-timeframe range to trade. If the daily chart is rising, they take long fades at the bottom of a 5 minute box and skip shorts at the top. The filter does not change the arithmetic of any single trade; it changes which trades are taken.
Asked for the top three trading strategies, most educators would name trend following, range trading and breakout trading. They are three answers to the same question about a boundary: will it hold, or will it give way?
Related lesson: Breakout trading
Fade vs Breakout Range Trading Results on ES and NQ
The fade and breakout results below are this guide's own test on Yahoo Finance ES and NQ five minute bars. They trade the first touch of the 30 minute opening range on 47 sessions from August 27 to November 4, 2026, both ways at the same boundary. A fade sells the top touch or buys the bottom touch, targets the opposite boundary and uses the listed stop. A breakout buys the top touch or sells the bottom touch, targets one box width beyond, and uses the same stop. Costs of 0.35 ES points and 0.50 NQ points are already subtracted. Box-scaled stops are a fraction of that day's opening range width.
ES fade and breakout ladder
| ES stop | Fade mean net (points) | Fade stopped out | Fade 90% interval | Breakout mean net (points) | Breakout 90% interval |
|---|---|---|---|---|---|
| 4 points | -2.17 | 91.3% | -3.81 to -0.43 | +1.87 | -0.95 to +4.84 |
| 6 points | -1.26 | 82.6% | -3.87 to +1.65 | +2.11 | -1.13 to +5.52 |
| 8 points | -1.09 | 73.9% | -4.11 to +2.17 | +1.99 | -1.59 to +5.72 |
| 10 points | -1.43 | 69.6% | -4.75 to +2.06 | +1.88 | -1.96 to +5.84 |
| 12 points | -2.07 | 65.2% | -5.61 to +1.62 | +0.97 | -3.08 to +5.14 |
| 14 points | -0.49 | 54.3% | -4.37 to +3.50 | +0.71 | -3.52 to +5.10 |
| 16 points | +0.12 | 50.0% | -4.04 to +4.51 | +0.45 | -3.98 to +4.95 |
| 20 points | +0.22 | 41.3% | -4.46 to +4.94 | +0.21 | -4.70 to +5.12 |
| 0.25 x box width | -0.26 | 80.4% | -2.86 to +2.67 | +1.51 | -1.73 to +4.85 |
| 0.5 x box width | -2.21 | 71.7% | -5.56 to +1.43 | +0.98 | -3.11 to +5.18 |
| 0.75 x box width | -0.07 | 50.0% | -4.44 to +4.47 | -0.72 | -5.63 to +4.04 |
| 1 x box width | -0.35 | 41.3% | -5.32 to +4.69 | -0.35 | -5.39 to +4.62 |
Each ES row covers 46 trades, one per session with a clean first touch.
NQ fade and breakout ladder
| NQ stop | Fade mean net (points) | Fade stopped out | Fade 90% interval | Breakout mean net (points) | Breakout 90% interval |
|---|---|---|---|---|---|
| 15 points | -5.54 | 91.5% | -12.70 to +3.73 | +6.73 | -6.01 to +21.26 |
| 20 points | -10.12 | 91.5% | -17.59 to -0.53 | +6.65 | -7.89 to +22.74 |
| 30 points | -4.56 | 83.0% | -18.38 to +10.84 | +7.33 | -10.57 to +26.26 |
| 40 points | -6.57 | 78.7% | -22.31 to +10.71 | +7.07 | -12.54 to +27.49 |
| 50 points | -6.52 | 72.3% | -24.39 to +11.70 | +5.85 | -15.47 to +27.85 |
| 60 points | -9.08 | 66.0% | -28.01 to +10.34 | +2.14 | -20.03 to +25.21 |
| 80 points | -10.06 | 59.6% | -32.04 to +12.54 | -0.68 | -26.53 to +25.25 |
| 100 points | -1.97 | 44.7% | -26.35 to +23.14 | +1.45 | -27.34 to +30.07 |
| 0.25 x box width | +2.61 | 74.5% | -15.50 to +22.76 | +5.41 | -14.97 to +26.61 |
| 0.5 x box width | -5.06 | 59.6% | -28.57 to +20.29 | -1.53 | -29.43 to +26.25 |
| 0.75 x box width | -8.48 | 46.8% | -37.01 to +21.17 | +1.17 | -32.23 to +33.03 |
| 1 x box width | -12.98 | 36.2% | -45.22 to +19.93 | +11.98 | -20.93 to +44.22 |
Each NQ row covers 47 trades.
What the ladder establishes and what it does not
In the fade and breakout ladders from this guide's ES and NQ test, read the interval columns before the mean columns. Not one of the 48 rows across both markets and both directions produced an interval entirely above zero. The best-looking ES fade row, a 20 point stop at +0.22 points per trade, has an interval from -4.46 to +4.94. Picking a row like that out and publishing it alone would be the most misleading thing this guide could do.
Two rows did produce intervals entirely below zero: the ES fade with a 4 point stop (-3.81 to -0.43) and the NQ fade with a 20 point stop (-17.59 to -0.53). That is the one firm finding of the test. A tight stop beyond an opening range boundary was stopped out on more than 90% of fades and lost money reliably after costs. The box was wider than the stop was patient.
The breakout side looked slightly better at tight stops on both markets. That fits the opening range's survival record in the same study, where the 30 minute box was closed beyond on 47 of 47 ES sessions: a box that breaks almost every day rewards the side betting on the break, at least until the stop gets wide enough to let the fade survive its heat. None of the breakout rows cleared zero either.
The honest summary for 47 sessions: the boundary was not a directional signal in this sample. What it did predict is that something happens near it on nearly every session. How much of that a trader keeps depends on stop width and costs, and 47 sessions is not enough to say more. A trader who wants a real answer for their own market needs their own, longer record.
Related lesson: Backtesting a trading strategy
Which Range Is Worth Trading Later in the Session
If the opening range breaks too often to fade, the next question is whether a box formed later does better. The test compares the 30 minute opening range with two later ES and NQ boxes, 10:00 to 11:00 AM ET and 10:00 AM to 12:00 PM ET, each judged on the bars after it finished forming.
| Box (ET) | Market | Sessions touched | Returned to opposite boundary | Broke and never came back | Session range still to come beyond the box |
|---|---|---|---|---|---|
| 9:30 to 10:00 AM | ES | 46 | 47.8% | 10.9% | 57.4% |
| 9:30 to 10:00 AM | NQ | 47 | 34.0% | 10.6% | 50.7% |
| 10:00 to 11:00 AM | ES | 43 | 34.9% | 14.0% | 41.1% |
| 10:00 to 11:00 AM | NQ | 42 | 28.6% | 11.9% | 34.7% |
| 10:00 AM to 12:00 PM | ES | 35 | 11.4% | 8.6% | 20.8% |
| 10:00 AM to 12:00 PM | NQ | 34 | 5.9% | 8.8% | 15.9% |
"Returned to opposite boundary" means price touched one side and later traded to the other side before 4:00 PM ET. "Session range still to come" is the median share of the full session's high-to-low range that was made beyond the box after it finished forming.
In this guide's ES and NQ measurement the pattern is clear even on 47 sessions. A two hour box from 10:00 AM to noon returned to its opposite side on only 11.4% of ES touches, and only about a fifth of the day's range was still to come beyond it. By midday, much of the session's movement has already happened, so a box that took two hours to build tends to be the session's resting place rather than a box that rotates.
That changes what each box is for. The opening range offers the most rotation and the most movement still to come, but it breaks almost every session. The noon box is the most stable and the least rewarding. A range trader looking for a box with both rotation and room is choosing between those two costs, not finding a box without either.
Markets and conditions where ranges are common
Range trading tends to suit:
- Quiet sessions within a market's day. In equity index futures, the midday hours after the morning's movement is spent often rotate in a narrower band.
- Liquid instruments with tight spreads. Range targets are small, so a wide spread eats a larger share of each trade. A one tick spread matters far more on a small target than on a large one.
- Low-volatility stretches before scheduled news. Price often compresses ahead of a known release, then leaves the box on the release.
- Forex during slower sessions. Currency traders often describe the Asia session in EUR/USD as more range-bound than the London open, though that is a tendency, not a rule.
Range trading tends to struggle around major data releases, at the open of a new session, and in markets trending on a higher timeframe.
What Ten Years of Daily Bars Say About Ranges
Ten years of daily ES and NQ bars give a longer test than 47 intraday sessions: 2,514 sessions per market from November 7, 2016 to November 4, 2026, using Yahoo Finance's continuous front-month daily bars.
| Daily measure | ES | NQ |
|---|---|---|
| Close inside the prior 20 sessions' high-low range | 82.9% | 83.1% |
| Inside days (high and low inside the prior day's) | 12.8% | 11.8% |
| Narrowest range of the last seven sessions (NR7) | 16.1% | 15.4% |
| Median daily range, all sessions | 49.0 points | 220.5 points |
| Median daily range the day after an inside day | 46.5 points | 220.25 points |
The strongest figure in this guide's daily study is the first one. ES closed inside its prior 20-session range on 82.9% of 2,494 measurable sessions, and NQ on 83.1%. Over ten years, price spent most of its time inside a box it had already visited. Ranges are the normal condition on a daily chart.
The catch is that being inside a range does not say where the boundary will hold. In the same daily ES data, NR7 days appeared on 16.1% of ES sessions against the 14.3% you would expect if range size came in random order, a small tilt toward clustering. The day after an inside day had a median range of 46.5 ES points against 49.0 for all days, so a quiet day did not reliably produce a quiet next day.
Related lesson: Market structure highs lows and trends
Range Trading Indicators and What They Add
Range trading indicators mostly restate the box in another form. Oscillators show where price sits within its recent range; trend-strength tools try to say whether a range is likely to continue. Neither can tell you whether the next touch holds.
| Indicator | What range traders use it for | Standard levels |
|---|---|---|
| Relative Strength Index (RSI) | Marks stretched moves near the edges of a box | Above 70 overbought, below 30 oversold (Wilder) |
| Stochastic oscillator | Shows where the close sits within the recent high-low range | 80 overbought, 20 oversold |
| Commodity Channel Index (CCI) | Flags moves beyond a statistically normal band | +100 and -100; roughly 70% to 80% of values fall between them by design |
| Average Directional Index (ADX) | Rates trend strength to separate ranging from trending markets | Below 20 no trend, above 25 strong trend (Wilder) |
| Bollinger Bands | Draws an envelope around price; narrowing bands show compression | 20-period average with bands two standard deviations away by default |
| Pivot points | Pre-calculated support and resistance levels from the prior session | Pivot plus several support and resistance levels |
| Volume and volume profile | Show where trading concentrated inside the box | No fixed levels |
Did a low ADX predict a range
ADX is the indicator most often recommended for range trading, so the daily ES and NQ series was split by the 14-period ADX reading at the prior session's close, using Wilder's 20 and 25 thresholds.
| ADX at prior close | ES sessions | ES close inside prior 20-session range | NQ sessions | NQ close inside prior 20-session range |
|---|---|---|---|---|
| Below 20 | 1,024 | 82.3% | 913 | 83.8% |
| 20 to 25 | 484 | 83.1% | 585 | 80.7% |
| Above 25 | 978 | 83.7% | 988 | 83.9% |
A low ADX made no visible difference in this guide's ten year test. ES closed inside its prior 20-session range on 82.3% of low-ADX sessions and 83.7% of high-ADX sessions. Prices stay inside recent ranges most of the time whatever ADX reads, so a low ADX confirms a quiet market without adding much about the next session.
That does not make indicators useless. An oscillator at an extreme at the edge of a box is a reasonable timing aid, and ADX helps you avoid fading a market in an obvious trend. The point is narrower: if price is trapped in the middle of a range, adding another indicator does not create direction.
Related lesson: Average directional index adx
Advanced Range Trading Techniques
Advanced range trading techniques try to answer the question the box cannot: is the boundary being defended right now?
- Volume profile inside the box. A range with a thick high-volume node in the middle and thin volume at the edges is behaving like a balanced market. A range where volume builds at one edge is often absorbing orders before a break.
- VWAP as the box's middle. Many intraday traders use the volume-weighted average price as the first target of a fade, because it often sits near the box's center of gravity.
- Order flow at the edge. Watching the tape or a footprint chart at the boundary shows whether aggressive buying at resistance is being absorbed by resting sellers, which supports a fade, or is lifting through them, which supports a break.
- Failed auction logic. A push outside the box on light volume that quickly returns inside is a classic failed auction, the basis of the failed-breakout entry.
- Fibonacci levels inside the box. Some traders mark Fibonacci retracement levels of the box as scale-out points. They are reference points, not evidence that price will stop there.
- Volatility-sized stops. Sizing the stop to the market's average true range (ATR) instead of a fixed number of points keeps a stop from sitting inside ordinary noise on a volatile day.
None of these techniques stops an intraday box from breaking; on ES five minute bars the 30 minute opening range was closed beyond on 47 of 47 sessions in this guide's study. They are tools for deciding which range trading touches to skip.
Related lesson: Volume profile
Range Trading Risk Management
Range trading risk management starts with one number: how far beyond the boundary the stop sits. In this guide's ES opening range test, a 4 point stop was stopped out on 91.3% of fades, while a 20 point stop was stopped out on 41.3%.
Sizing the stop to the instrument
A stop has to be sized to the instrument's movement, not copied from another market. In this guide's August to November 2026 sample, the median 30 minute opening range was 21.5 points on ES and 159 points on NQ, more than seven times wider on NQ. A 10 point stop is a real stop on ES and a rounding error on NQ, which is why every NQ fixed-stop fade tested, from 15 to 100 points, lost money on average.
Sizing the position to the stop
Once the stop is set, the position size follows from what you are willing to lose. Using CME point values (illustrative account figures):
- ES is $50 per point, so a 16 point stop risks $800 per contract.
- Micro E-mini S&P 500 (MES) is $5 per point, so the same 16 point stop risks $80 per contract.
- With a $400 risk budget per trade, that is five MES contracts and no ES contracts.
- NQ is $20 per point and Micro E-mini Nasdaq-100 (MNQ) is $2 per point, so an 80 point NQ stop risks $1,600 on NQ or $160 on MNQ.
Wider stops only make sense with smaller size. Widen the stop to survive the heat while keeping the same contract count, and all you have done is raise the risk per trade.
A worked range trade from the sample
ES on October 29, 2026 had a 30 minute opening range of 7,732.25 to 7,753.75, a width of 21.50 points, exactly the median of this guide's 47-session sample. The first touch came on the 10:00 AM ET bar, at the top of the box. A fade short at 7,753.75 targeted the bottom of the box.
Price pushed up to a session high of 7,767.25, 13.50 points beyond the boundary, then fell to 7,725.25, below the far side of the box. The same short, after costs, ended four ways depending only on the stop:
- 4 point stop: stopped out, -4.35 points, -$217.50 on one ES contract.
- 8 point stop: stopped out, -8.35 points, -$417.50.
- 12 point stop: stopped out, -12.35 points, -$617.50.
- 16 point stop: reached the far boundary, +21.15 points, +$1,057.50.
The breakout long at the same boundary was stopped out at every stop width in the ladder, including -16.35 points (-$817.50) with a 16 point stop. One session proves nothing about an edge, but it shows the shape: the entry was identical, and the stop width alone turned a $617.50 loss into a $1,057.50 gain.
Common range trading risk mistakes
- Misidentifying the range. Fading a pause inside a trend, where the "top" is about to become support.
- Overtrading the middle. Entries away from the edges have a distant stop and a close target, the worst ratio a range offers.
- Moving the stop after the touch. Widening a stop once the heat arrives turns a planned loss into an unplanned one.
- Re-fading a broken box. After a close beyond and no return, the old boundary is no longer the trade.
- Ignoring costs. On ES a 0.35 point round-turn cost is 1.6% of a 21.5 point target, but 8.75% of a 4 point stop.
Range trading inside a single session
On our accounts, every position is closed by 4:45 PM ET on regular days and there are no overnight or weekend holds, so a range trade has to work inside one session. Contract limits set the size, and 10 micros count as one mini, so five MES contracts use half the limit of one ES. On a Growth evaluation, hitting the daily loss limit puts the account in liquidation-only until the next trading day, which is one more reason to set a range trading stop that fits the box before the first touch.
Related lesson: Stop loss orders and placement
Range Trading vs Trend Trading, Breakouts and Mean Reversion
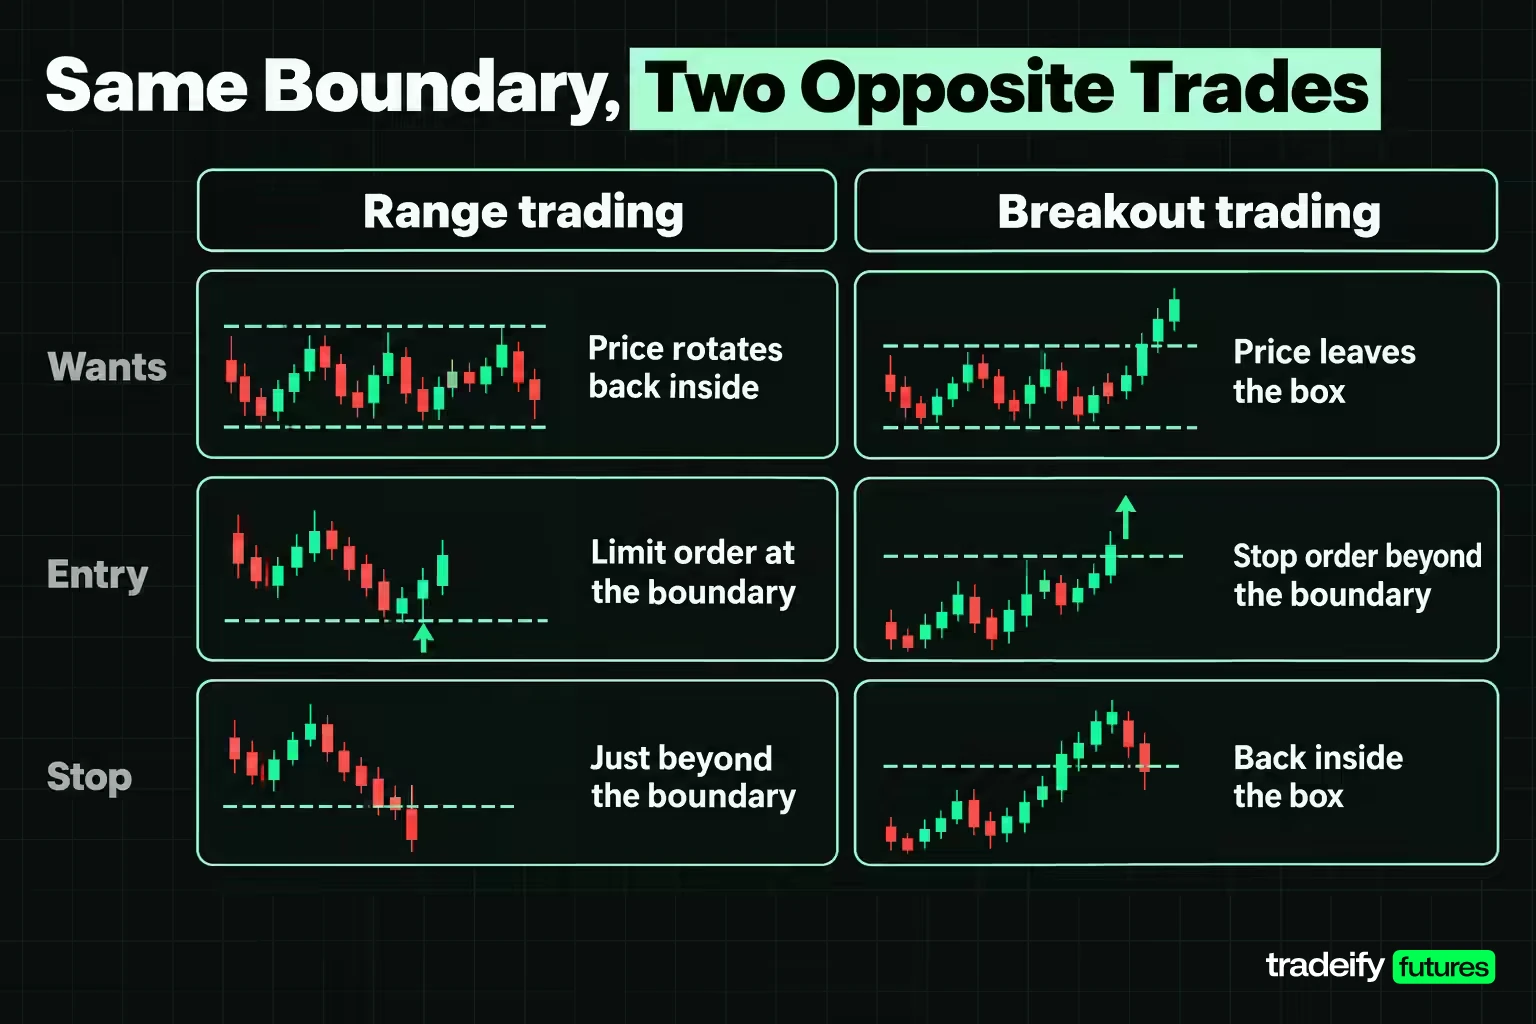
Range trading sits beside three related approaches, and the differences come down to what each one wants price to do at a level.
| Approach | What the trader wants | Typical entry order | Stop location | Fits best when |
|---|---|---|---|---|
| Range trading | Price rotates back toward the middle of a box | Limit order at the boundary | Just beyond the boundary | The box keeps rotating and has room left |
| Trend following | Price keeps moving in the direction of the trend | Stop order on a break or a limit on a pullback | Below the last swing low or above the last swing high | Higher highs and higher lows, or the reverse |
| Breakout trading | Price leaves the box and expands | Stop order beyond the boundary | Back inside the box | Compression before a catalyst, or a box that keeps getting tested |
| Mean reversion | Price returns to an average after a stretch | Limit order at a statistical extreme | Beyond the extreme, or a time stop | Price is stretched far from a mean that is not trending |
Range trading and mean reversion are close cousins: both bet on a return. The difference is the reference point. A range trader's target is the opposite edge of a visible box; a mean reversion trader's target is an average such as a moving average or VWAP, which can move.
Range trading and breakout trading are mirror images on the same level. In this guide's ES and NQ opening range test, neither the fade nor the breakout cleared zero across 47 sessions, which is the point: the same boundary served both trades, and the stop decided which one paid.
Related lesson: Mean reversion trading
Range Trading Pros and Cons
Range trading has a real appeal and real costs. This guide's ES and NQ measurements put numbers on both.
| Pros | Cons |
|---|---|
| Clear, nearby invalidation at the boundary | Tight stops beyond the boundary were stopped out on more than 90% of opening range fades on ES and NQ |
| Defined target at the middle or the far side | The target is capped by the box width, so a range trade rarely catches a large move |
| Ranges are common: price closed inside its prior 20-session range on about 83% of daily sessions | Being inside a range does not tell you where the next boundary holds |
| Works in quiet markets where trend strategies stall | Intraday boxes break often: the 30 minute ES opening range broke on 47 of 47 sessions |
| Entries are planned in advance with limit orders | False breakouts and real breakouts look identical at the moment of the touch |
| Easy to test because the rules are mechanical | Costs take a larger share of small targets, and short samples cannot tell an edge from noise |
The biggest advantage is that the trade's risk is visible before entry. The biggest disadvantage is that the visible risk is often too small to survive the market's ordinary heat.
Range Trading Psychology
Range trading psychology is mostly about sitting still at the right times. The edge of a box is the only good entry, which means long stretches of watching price drift through the middle while doing nothing.
The temptations are predictable:
- Chasing a missed edge. Price touches the boundary without you and bounces. Entering two points later feels like the same trade. It is a different trade, with the same stop and less room to the target.
- Fear of the breakout. After a few broken boxes, a trader may start exiting fades at the first sign of heat. In this guide's ES study, the median heat after the first opening range touch was 16.75 points, so that heat is normal, not a warning.
- Overconfidence after a run of fades. Three clean rotations make the box feel permanent. Ranges end without notice, and the fourth fade is the same bet as the first.
- Revenge after the break. When a box breaks and the stop hits, re-fading the broken edge to win it back is the most expensive habit in range trading.
The fix is precommitment. Write down the box, the entry, the stop and the time exit before the first touch, and treat the stop as a planned cost. A clean loss at a well-placed stop does not need revenge. It needs the same plan on the next qualified touch.
Related lesson: Trading psychology
Range Trading FAQ
What is range trading in simple terms
Range trading means selling near the top of a sideways price box and buying near the bottom, with a stop just beyond the edge. It works while the box keeps rotating and loses when the box breaks.
How long does a trading range last
Intraday ranges are short-lived. In this guide's test of 47 sessions of ES five minute bars, the 30 minute opening range was closed beyond on all 47. A 90 minute opening range held inside to the close on 14.9% of sessions.
What is the best indicator for range trading
The best indicators for range trading are oscillators such as RSI and stochastics for timing entries at the edges, plus ADX to screen out strong trends. None of them predicts whether a boundary holds. In this guide's ten year ES test, a low ADX did not raise the share of closes inside the prior 20-session range.
What is the 3-5-7 rule in trading and how does it work
The 3-5-7 rule in trading is an informal risk guideline, not an exchange or regulatory rule. A common version says to risk no more than 3% of the account on one trade and keep total open risk at or under 5%. It also aims for winners of at least 7%, though versions differ on whether that is a profit target or a win-to-loss ratio.
Can you make $200 per day in day trading
Some days a trader might, and many days they will lose instead; no strategy guarantees a daily amount. Before costs, $200 is 40 points on one MES contract, 4 points on one ES or 100 points on one MNQ. Chasing a fixed daily number often leads to overtrading, which is costly in range trading.
What are the top 3 trading strategies
Trend following, range trading and breakout trading are the three most commonly taught strategy families. They disagree about the same boundary: range traders expect it to hold, breakout traders expect it to fail, and trend followers trade in the direction of the larger move.
Is range trading profitable
It can be, but this guide's sample does not show it. On 47 sessions of ES and NQ, no fade or breakout stop width tested on the 30 minute opening range produced a 90% interval entirely above zero after costs. Keep risk per trade small until your own record is long enough to judge.
Futures trading involves substantial risk of loss, and leverage means losses can exceed what you expect. The figures in this guide come from historical five minute and daily bars on a short intraday sample and are not trading results or a forecast. Funded and evaluation accounts at prop firms are simulated. This guide is educational and is not investment advice.


