



TL;DR: Trading discipline is the share of your trades that match a rule you wrote down before the entry, and you can count it. In 20 years of E-mini S&P 500 data, chasing a late entry removed 67.1% of a breakout rule's total return. Cutting the 2R target to 1R removed 61.2%. Moving or removing the stop barely hurt the average but stretched the worst trade from -1.25R to -24.26R. Build discipline with written if-then rules and a tracked adherence rate, not willpower.
Price is grinding toward your stop. The level you wrote down on Sunday made sense then, and now it feels like a suggestion. You drag it a few points lower, just this once.
Most traders who look up trading discipline already have a plan. They know where the stop belongs and how big the position should be. What they want is a way to make the plan survive contact with a live position.
This guide treats trading discipline as something you can measure and price. It defines the term, explains why rules break under pressure, then runs one plain E-mini rule through 20 years of data six times, breaking a single rule each time. The point is to see which lapses are expensive and which only feel that way, because the answer is not the one most traders expect.
What Trading Discipline Means
Trading discipline is the share of your trading decisions that match a rule you wrote down before the trade. That makes it an execution rate. If you planned 20 trades and 17 went in at the planned price, with the planned size and the planned exits, your discipline on those trades was 85%.
That definition is narrower than "having the right mindset", and that is the point. A mindset is hard to check. An execution rate is easy to check from a fill log, and it tells you whether your trading discipline is improving or just feels better this week.
It also separates two things traders blend together. Strategy quality is whether the rule makes money when followed. Discipline is whether you followed it. A good rule executed at 60% and a mediocre rule executed at 95% are different businesses, and only one of those numbers is fully in your control on any given day.
The trading mindset that supports this is closer to a professional's than a gambler's:
- The plan is the decision. The live trade is just the execution of it.
- A single outcome says little about a rule. A sample of 50 or 100 trades says something.
- A loss taken exactly as planned is a good trade. A win taken by breaking a rule is a bad one, even when it pays.
- "I will try harder" is not a plan. "If price reaches X, I do Y" is.
Once you accept that framing, the useful questions change. You stop asking whether you are a disciplined person and start asking which rule you break, how often and what it costs.
Why Discipline Breaks Under Pressure
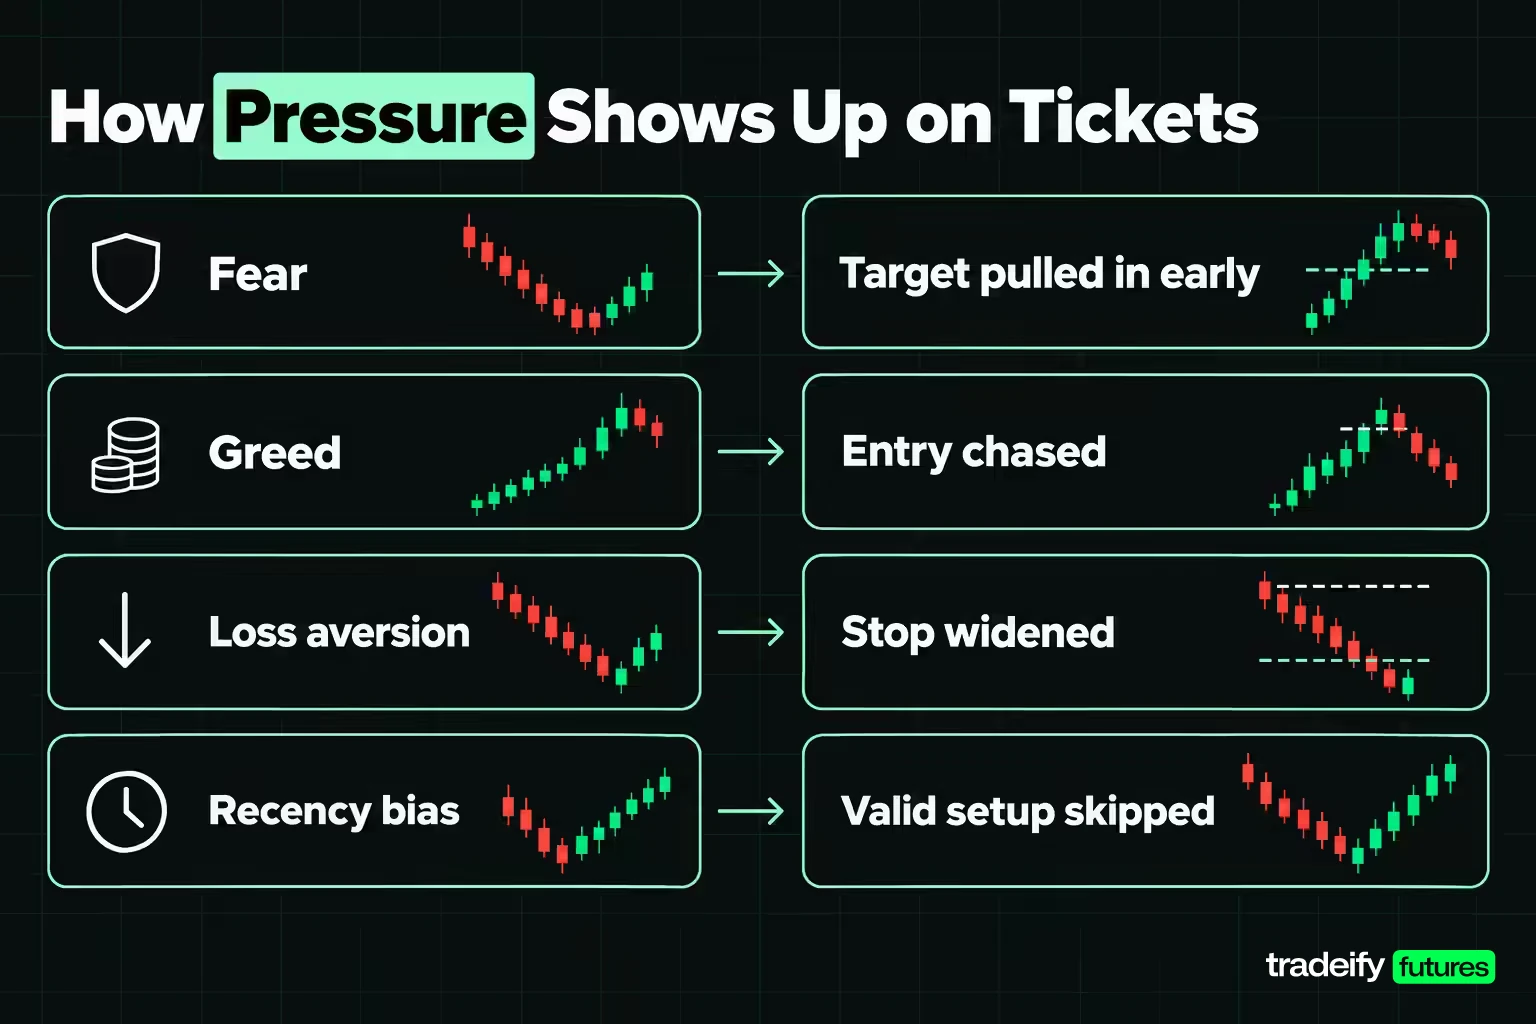
Trading discipline usually breaks for predictable reasons, and they show up as specific orders on the ticket. Knowing which force produces which order makes it easier to write a rule that catches it.
Fear and greed are the obvious ones. Fear shows up as a target pulled in after a few ticks of profit, or a skipped signal after a loss. Greed shows up as a position held past the target, a size bumped up after a winning week, or an entry chased because the move is already running.
Cognitive biases do the quieter damage:
- Loss aversion. Losses feel larger than equal gains, so a trader widens a stop to avoid "making it real" and takes profits early to lock in the good feeling.
- Recency bias. The last three trades start to define the rule. Three losers in a row and a valid setup gets skipped; three winners and the size creeps up.
- Overconfidence. A good run makes the plan feel optional, because "I can read this market now".
- Hindsight bias. After the session, the right trade looks obvious, which tempts a trader to write rules from a handful of memorable outcomes.
- The break-even urge. After a loss, a trader wants to get back to flat on the day, which leads to unplanned entries and larger size.
Emotional control, as part of trading discipline, does not mean feeling nothing. It means noticing the feeling and letting the pre-written rule make the decision. The practical habit is to name the urge before acting on it: "I want to move this stop because I don't want the loss." Once it is said plainly, it is easier to see that it is not a reason found in the plan.
Related lesson: Avoiding trading tilt
A Measurable Test of Trading Discipline
The cleanest way to price a discipline lapse is to hold everything constant except the one broken rule. This guide's illustrative study does that on 20 years of E-mini S&P 500 futures data, and the rule is stated in full so you can rebuild it.
The rule used in the E-mini discipline study
- Data. Continuous front-month E-mini S&P 500 futures (ES) daily bars from Yahoo Finance, 18 September 2006 to 4 November 2026: 5,067 sessions, with 9 rows that carried no price excluded.
- Signal. A session closes above the highest high of the prior 20 sessions. That produced 592 signals.
- Entry. Long at the next session's open, one unit, every signal taken (positions can overlap).
- Risk unit (1R). One times the 14-session average true range (Wilder's smoothing) at the signal bar. The stop sits 1R below the entry.
- Target. 2R above the entry.
- Time cap. If neither level is hit, exit at the close of the 20th session in the trade.
- Costs. 0.5 index points per round turn, about 1.3% of the average risk unit of 38.20 points.
- Fills. A gap through a level fills at the open. If the stop and target both sit inside one daily bar, the stop is assumed to come first.
The median risk unit was 27.41 points. On one Micro E-mini S&P 500 (MES) at $5 a point, that is $137.04 of risk per trade. On one E-mini at $50 a point, it is $1,370.42.
Baseline result when discipline holds
Followed exactly, the E-mini breakout rule in this guide's study averaged 0.13R per trade with a 40.2% win rate, a total of 77.02R and a worst peak-to-trough drawdown of 22.09R. The worst single trade lost 1.25R, and no trade lost more than 2R.
The bootstrap 95% interval on the average runs from 0.02R to 0.24R. That is a small, real-looking edge that does not leave much room for error, which is exactly the situation most rule-based traders are in. Every lapse in this guide is measured against that baseline, using the same 592 signals and the same costs.
This is a historical illustration on one market, not a strategy recommendation or a forecast.
Related lesson: How to create a trading plan
What Each Broken Rule Costs
The cost of a trading discipline lapse depends on which rule you break, not on how bad the break feels. Each row in this table keeps the E-mini study's 592 entries and exits identical except for one change. "Cost per trade" is the drop in average R across all 592 trades, so a negative cost means the average went up.
| Lapse against the same plan | Trades affected | Average R after | Total R after | Cost per trade | Share of plan total removed |
|---|---|---|---|---|---|
| None, plan as written | 0 | 0.13R | 77.02R | 0R | 0% |
| Chased entry at the session close | 558 | 0.04R | 25.33R | 0.09R | 67.1% |
| Target cut from 2R to 1R | 316 | 0.05R | 29.86R | 0.08R | 61.2% |
| Stop widened to 1.5R near the stop | 391 | 0.11R | 64.74R | 0.02R | 16.0% |
| Time cap dropped | 40 | 0.13R | 79.85R | -0.005R | none |
| Stop removed entirely | 349 | 0.37R | 216.68R | -0.24R | none |
Two of these lapses are expensive on the average trade, and both feel reasonable in the moment. The one that feels most reckless, pulling the stop, looks harmless on the average. That should make you suspicious of averages, and the tail numbers explain why.
Chasing a missed entry
The chased entry models a trader who missed the open and bought at the close of the same session, keeping the planned stop and target prices. It affected 558 trades, cost 0.09R per trade (interval 0.06R to 0.12R) and removed 67.1% of the plan's total return.
The mechanism is simple. Buying higher after the move has started shrinks the distance to the target and stretches the distance to the stop, on the same risk budget. At the median risk unit, that is about $12 per MES trade, every time. Patience in trading is often described as a virtue. In this study, it is a number: the missed entry was cheaper skipped than chased.
Cutting the winner short
Cutting the target from 2R to 1R raised the win rate from 40.2% to 53.5%, which is why it feels like good discipline. It cost 0.08R per trade (interval 0.005R to 0.15R) and removed 61.2% of the total return.
A rule with a 40% win rate depends on the winners being about twice the size of the losers. Taking half the winner leaves the losers intact. This is the lapse most likely to hide in a journal, because each individual trade looks like a sensible profit.
Moving or removing the stop
In this guide's own E-mini study, widening the stop to 1.5R once price came within a quarter of a risk unit of it happened on 391 of 592 trades, 66.0%. It cost 0.02R per trade, with an interval of -0.05R to 0.09R, so this sample cannot prove it hurt the average.
Removing the stop entirely raised the average to 0.37R, because the E-mini rose over most of these 20 years and a 20-session time cap eventually closed most losing trades higher. That is not an argument for trading without a stop. Its cost shows up in the tail: 91 trades lost more than 2R and one lost 24.26R.
Consistent execution as the core of discipline
Consistent strategy execution means the same rule produces the same order in the same situation. The E-mini lapse test shows why that matters more than any single trade: two of its lapses removed more than 60% of the plan's return, and neither required a dramatic mistake. A slightly late entry and a slightly early exit, repeated, were enough to turn a small edge into almost nothing.
Related lesson: Trading expectancy
How Broken Stops Change the Worst Case
Stop lapses are the trading discipline failures that hide best. In this guide's E-mini study they barely move the average, but they reshape the distribution of outcomes. That shows up in the two numbers that end trading accounts: the deepest drawdown and the worst single trade.
| What the lapse changed | Average R | Max drawdown | Worst single trade | Trades worse than -2R |
|---|---|---|---|---|
| Plan as written | 0.13R | 22.09R | -1.25R | 0 |
| Chased entry | 0.04R | 38.13R | -2.35R | 4 |
| Target cut to 1R | 0.05R | 20.33R | -1.25R | 0 |
| Stop widened to 1.5R | 0.11R | 38.67R | -2.28R | 2 |
| Time cap dropped | 0.13R | 26.16R | -1.25R | 0 |
| Stop removed | 0.37R | 53.22R | -24.26R | 91 |
In this guide's own E-mini study, the widened stop pushed the max drawdown from 22.09R to 38.67R, 1.75 times the plan, on an average that barely moved. Removing the stop produced 91 trades worse than -2R (15.4% of all trades), 26 worse than -5R, and one trade that lost 24.26R. At 1% of the account risked per trade, that single trade is a 24% loss.
Even the honoured stop is not a perfect cap. In the study's plan as written, 4 of 592 trades (0.7%) opened past the stop, and the worst of those lost 1.25R instead of 1R. A stop limits risk; it does not guarantee a price.
Where your discipline is breaking
The E-mini study's lapse results point to a simple diagnostic you can run on your own trading journal:
| What your results show | Lapse to check first | What it damages |
|---|---|---|
| Drawdowns deeper than your plan predicts | Stops widened or removed | The worst case, not the win rate |
| Win rate fine but profits small | Targets cut early | The average winner and the edge |
| Losses larger than planned on entry | Entries chased after the signal | Risk per trade and the reward left |
| More trades than your rule produces | Entries taken on near-miss setups | Total exposure and drawdown |
| Rules followed but results still poor | No lapse, possibly the rule itself | Strategy quality, not discipline |
Related lesson: Recovering from a drawdown
Overtrading and the Trades Outside the Plan
Overtrading is usually described as an edge killer, and in practice it often is, especially when the extra trades are revenge entries or boredom trades. The E-mini study gives a more careful answer for one specific kind of overtrading: taking near-miss setups the rule did not produce.
This guide's own E-mini test added a trade every time the close finished within a quarter of a risk unit below the 20-session high without breaking it. That added 496 trades to the 592 planned ones. Those extra trades averaged 0.19R (interval 0.06R to 0.31R) with a 41.5% win rate, so in this sample they were not worse than the plan's own trades.
What they did change was exposure. With 1,088 trades instead of 592, the max drawdown rose from 22.09R to 43.36R, 1.96 times the plan. If your risk limit was built around the plan's trade count, the extra trades doubled the hole you could dig before the edge had time to show.
Be careful with that result. The lesson for trading discipline is not "near-miss trades are good". It is that a rule change belongs in a review, tested on a full sample, with position size adjusted for the new trade count. Taking the extra trade live because it "looks close enough" skips every one of those steps.
Practical guardrails against overtrading:
- A maximum number of trades per session, written before the open.
- A maximum total risk across open positions, not just per trade.
- A checklist the setup must pass before the order ticket opens.
- A rule that any new setup is paper-tracked for a set number of occurrences before real size.
Losing Streaks and a Discipline Rule That Used Hindsight
Losing and winning streaks test trading discipline because they make the last few trades feel like information about the next one. A common rule is to sit out the next trade after a loss. The E-mini study shows why rules like that need checking before you adopt them.
Taken naively, skipping the next signal after any losing trade looks brilliant in this guide's own E-mini study. It kept 239 trades averaging 0.93R, against the plan's 0.13R. Trade results also look streaky: the lag-1 autocorrelation was 0.49.
The catch is timing. Signals in the study's breakout rule often arrive while the previous trade is still open, because breakouts cluster. The prior trade had closed before the next signal in only 200 of 591 consecutive pairs (33.8%), and the median gap between the prior exit and the next entry was -3 sessions. In most cases you could not have known the last trade lost when the next signal fired. The streakiness itself comes from overlapping trades sharing the same price path.
The executable version of the skip rule, tested on the same E-mini data, skips a signal only when the loss was already known. It kept 399 trades averaging 0.16R and skipped 193 averaging 0.07R. The difference over the plan was 0.03R, with an interval from -0.05R to 0.11R, which is no reliable effect.
Learning from losses without breaking discipline
Losses are feedback, but only some of them are feedback about the rule. A useful review sorts every loss into one of three bins:
- Planned loss. The rule fired, you followed it, the market went the other way. Nothing to fix.
- Execution loss. You broke a rule. Fix the behaviour, not the rule.
- Rule question. You followed the rule and it keeps failing in a recognisable situation. Write it down, collect more cases and test the change on a full sample later.
On a winning streak, the same sorting applies in reverse. A winner that came from a broken rule goes in the execution bin, even though it made money. Before adopting any rule of the form "after X, don't trade", write down when in the sequence you would actually know X.
Related lesson: Handling trading losses
Systems That Beat Willpower for Trading Discipline
Willpower is a poor tool for trading discipline because it is spent at the worst moment: in the middle of a trade, under stress, with money moving. Systems move the decision earlier, to a moment when you are calm.
The research behind this is strong outside trading. A meta-analysis by Gollwitzer and Sheeran (2006) of 94 independent tests found that forming implementation intentions, plans in the form "if situation Y happens, then I will do X", had a medium-to-large effect on goal attainment (d = .65). A trading plan written as if-then rules is the same tool.
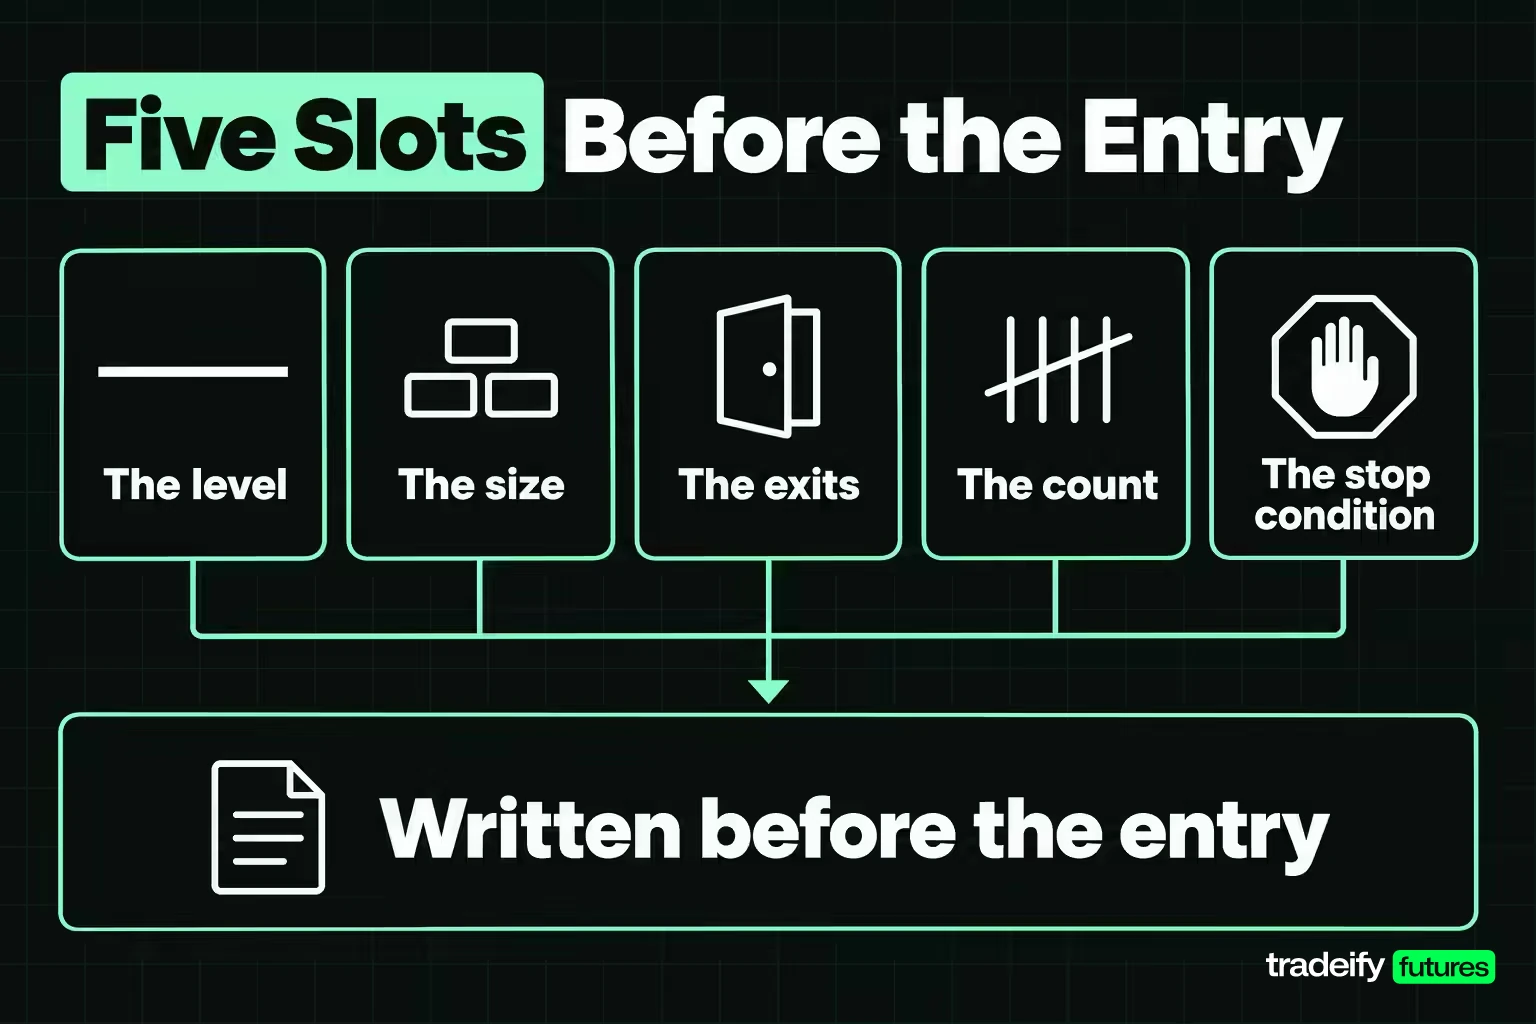
A five-slot discipline sheet to fill before the entry
Most broken rules are rules that were never fully written. Filling these five slots takes about a minute and covers what traders most often renegotiate mid-trade:
| Slot | What you write before the entry | Why it has to be written first |
|---|---|---|
| The level | The exact price that proves the trade wrong | After entry, the level drifts to wherever price is |
| The size | Contracts, from the stop distance and the risk budget | A size chosen live tends to grow after wins and losses |
| The exits | Target, time cap and what happens at each | Without it, the target gets cut when profit appears |
| The count | Maximum trades this session | Extra trades arrive on near-miss setups and boredom |
| The stop condition | The observable event that ends the session | "If I feel tilted" is never triggered in time |
The last slot changes behaviour the most, because it pre-commits your response to your own breach. Write it as an outcome you can check from your fill log, such as "two full stops and I close the platform", not as a feeling.
Other systems that take willpower out of the loop:
- Bracket orders that place the stop and target with the entry, so there is no gap in which to hesitate.
- Platform loss limits and lockouts that stop new orders after a set loss.
- A written pre-market routine that ends with the day's maximum trade count and loss.
- A rule to step away from the screen for a fixed time after any full stop.
Tracking Your Trading Discipline Rate
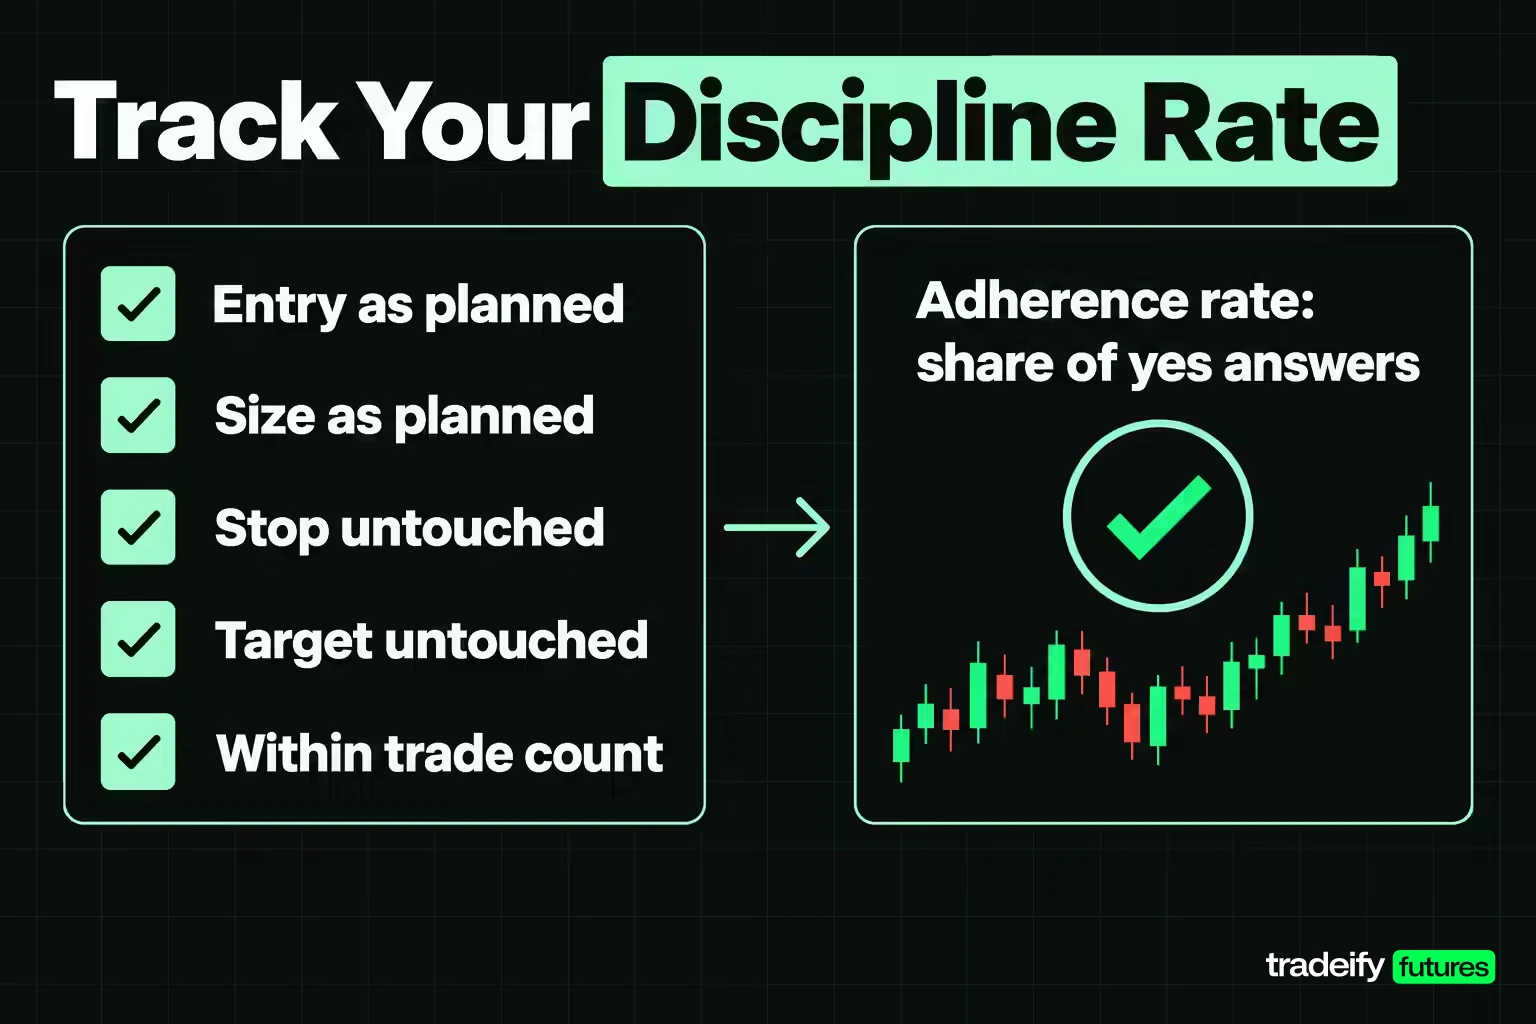
Tracking rule adherence turns trading discipline from a feeling into a number. For each trade, log a yes or no for every rule: entry as planned, size as planned, stop untouched, target untouched, within the session's trade count. Your adherence rate is the share of yes answers.
Track it separately from your win rate. A trade that followed every rule can lose, and a trade that broke every rule can win. Over a short sample, the two numbers can move in opposite directions, and only adherence is in your control.
What a discipline rate is worth in R
Rule adherence converts into expectancy with simple arithmetic. If you follow the E-mini breakout rule from this guide's own 20-year study on a share of trades and commit one specific lapse on the rest, your average is a simple blend of the two. This table assumes 1% of the account risked per trade and adds 100 trades without compounding.
| Rule adherence | Average if lapses are early exits | Average if lapses are widened stops | 100 trades with early exits | 100 trades with widened stops |
|---|---|---|---|---|
| 100% | 0.130R | 0.130R | 13.0% | 13.0% |
| 90% | 0.122R | 0.128R | 12.2% | 12.8% |
| 80% | 0.114R | 0.126R | 11.4% | 12.6% |
| 70% | 0.106R | 0.124R | 10.6% | 12.4% |
| 60% | 0.098R | 0.122R | 9.8% | 12.2% |
| 50% | 0.090R | 0.120R | 9.0% | 12.0% |
Treat this as arithmetic, not a forecast. It assumes lapses land randomly, and in real trading they cluster in the worst moments, which usually makes them more expensive. It also ignores the drawdown cost of widened stops, which the averages hide.
Accountability that keeps discipline honest
A self-graded discipline journal drifts toward kindness. Accountability mechanisms that help:
- A weekly review where you score adherence before looking at profit and loss.
- A trading partner or mentor who sees the adherence log, not just the results.
- Screenshots of the plan sheet taken before entry, compared with the fill afterwards.
- A written consequence for a rule break, such as one session at half size, decided in advance.
A trading journal makes all of this possible. Record the planned levels, the actual fills, the rule check and one line on what you felt at the moment of any lapse. After 20 or 30 trades, the most common lapse is usually obvious.
Related lesson: How to keep a trading journal
Self-Trust and Changing a Rule Without Breaking Discipline
Self-trust in trading is the confidence that you will execute your rule the next time it fires, and it is the quiet payoff of trading discipline. It is built from a record, not from affirmations. Each trade taken exactly as planned is a small piece of evidence that the next one will be too.
That is why the count matters. A trader with a 95% adherence rate over 100 trades has a reason to trust the next entry. A trader who does not know their rate is relying on mood.
Habit research suggests this takes longer than people expect. In Lally and colleagues' 2010 study, 96 volunteers repeated one daily behaviour in the same context for 12 weeks. For the 82 who gave enough data, the time to reach most of their eventual automaticity ranged from 18 to 254 days, and missing a single day did not materially set the process back. That was a study of everyday habits, not trading, but the shape is useful: consistent repetition in a stable context, and no catastrophe from one miss.
Adapting to market conditions without abandoning the rule
Markets change, and a rule that never changes will eventually stop fitting. Discipline does not mean never adapting. It means changing rules in a review, not mid-trade.
A workable approach:
- Write down in advance what would make you review the rule, such as a drawdown beyond a set number of R or a volatility regime you have not traded before.
- Reduce size while you review, rather than switching rules on the spot.
- Test any change on a full historical sample and a forward paper sample before trading it with real risk.
- Keep the old rule's adherence record separate from the new one.
Related lesson: Building trading confidence
Discipline Under Prop Account Loss Limits
Trading discipline gets tested harder on prop firm evaluation and funded accounts, which make lapses less forgiving because they usually come with fixed daily loss limits and maximum drawdowns. In this guide's 20-year E-mini breakout study, removing the stop produced a single trade that lost 24.26R. Against a fixed drawdown, a tail like that does not just hurt the average; it can end the account before the average ever matters.
On our accounts, the max trailing drawdown updates at end of day but is enforced in real time against net liquidation value, so an open loss that touches it fails the account even if price recovers later. Our Daily Loss Limit on Growth evaluations is a soft breach: it pauses trading for the day and you can resume the next session after 6:00 PM ET. You can also set your own guardrails with Tradovate's Risk Settings or a Tradesea personal lockout. Our funded accounts are simulated.
Trading Discipline FAQ
What is trading discipline?
Trading discipline is the share of your trading decisions that match rules you wrote before the trade, covering entry, size, stop, target and how many trades you take. It is best measured as an adherence rate in your journal rather than judged by feel.
Why do 90% of traders lose?
Most traders lose because trading costs, small or missing edges and inconsistent execution add up, and the 90% figure is a rough shorthand rather than an official statistic. Studies of retail day traders do find very high loss rates. Chague, De-Losso and Giovannetti studied everyone who began day trading Brazilian equity futures from 2013 to 2015 and found that 97% of those who persisted more than 300 days lost money.
What is the 3-5-7 rule in trading?
The 3-5-7 rule is an informal risk guideline: risk no more than 3% of the account on one trade, no more than 5% across all open positions, and aim for winners at least 7% larger than losers. It is a rule of thumb, not an exchange or regulatory rule, and many traders use a smaller per-trade figure such as 1%.
How to be disciplined when trading?
Write your rules as if-then statements before the session, fill in the stop, size, exits, trade count and stop-trading condition before each entry, and use bracket orders and platform loss limits so fewer decisions happen under stress. Then log a yes or no for each rule on every trade and review the adherence rate weekly.
How long does it take to build trading discipline?
There is no trading-specific timeline. In Lally and colleagues' 2010 habit study, the time to reach most of the eventual automaticity ranged from 18 to 254 days, with repetition in a consistent context mattering more than perfection. Counting your adherence rate shows whether it is actually improving.
What if I keep breaking the same rule?
Fix the rule's design before blaming willpower. If you keep widening a stop, the stop may be too close for the size, so reduce size or move the planned stop and test that change. If you keep cutting targets, try a bracket order that places the target with the entry.
Your Next Step With Trading Discipline
Pick one rule, not five, and count it for your next 20 trades. Log a single yes or no per trade: did the trade match the written rule? At the end, you have an adherence rate and the most common lapse.
Then price that lapse with your own numbers. If it is the early exit or the chased entry, those were the two most expensive breaks in this guide's E-mini study, so fix that rule first and leave the rest alone. If it is the stop, look at your worst trade and your deepest drawdown rather than your average, because that is where a moved stop does its damage.
This article is educational and not financial advice. Futures are leveraged products, and losses can exceed what you expect on a single trade or day. The E-mini study uses historical continuous front-month data with a simple cost assumption, and past or modeled results do not predict future results. Prop firm evaluation and funded accounts are simulated, and no rule here guarantees a profit or prevents a loss.


