




TL;DR: Discretionary trading keeps the final take-or-skip call with the trader, while rule based trading commits every decision in advance. On 134 ES and NQ opening range signals, three of four discretionary filters raised the average, but none cleared its own noise. The same filters on 85 newer trades repeated some effects and reversed others. Measure your own calls on a written control group before you trust them.
Discretionary trading is usually sold as a personality choice: some traders like rules, others like feel. That framing skips the question that matters to anyone running a method. Are the calls you make in the moment adding money, or just adding variety?
Most traders never find out, because the trades they skipped leave no record. The skip feels smart, the chart moves on, and the memory keeps the times it worked.
This guide covers the definition, the comparison with systematic and rule based trading, the analysis discretionary traders lean on, and the psychology and risk control the style demands. It also runs a test most comparisons never attempt. One plain mechanical rule was traded on five-minute E-mini S&P 500 (ES) and E-mini Nasdaq-100 (NQ) bars, four common discretionary calls were written as filters on the same 134 signals, and then the whole thing was repeated on 85 newer signals to see what survived.
What discretionary trading means
Discretionary trading is a style where the trader keeps the final decision on whether, when and how much to trade, usually on top of a framework of rules. The setup may be defined, the risk may be defined, but the trigger stays open: the same pattern can be taken on Tuesday and passed on Wednesday because the trader read the context differently.
CME Group's education course on system-based and discretionary trading puts the distinction well. Discretionary traders have rules to follow, just like their programmer counterparts, and the difference is that they apply those rules based on their subjective understanding of each situation. The same course adds that, because the process is subjective, discipline has to stay at the front at all times.
So a discretionary trader is not someone without rules. It is someone whose rules leave one or more decisions open. In practice those open decisions tend to be:
- Take or skip: the setup is valid, but does it look good enough today?
- Entry timing: enter on the signal, or wait for a pullback?
- Exit: hold for the target, or close early because the market "feels heavy"?
- Size: trade normal size, or press because conviction is high?
The last two are the dangerous ones. An open take-or-skip call can be measured. An open exit and an open size change the method trade by trade, which makes the results almost impossible to audit.
Discretionary trading vs systematic trading
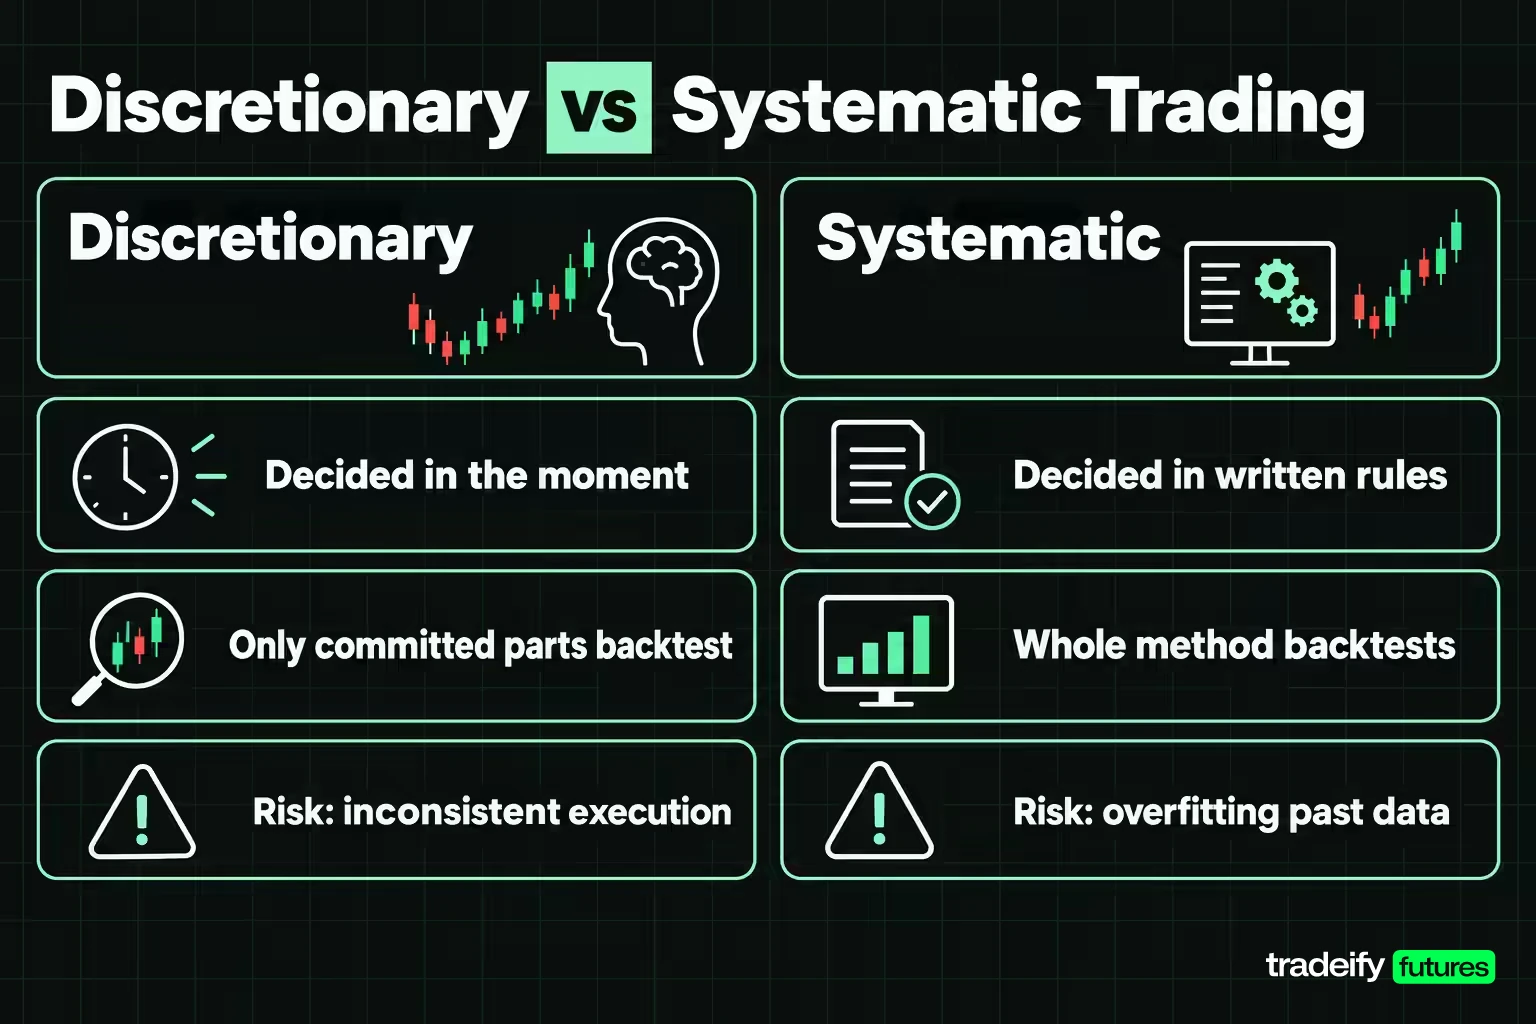
Systematic trading, also called mechanical or rule based trading, commits every decision before the signal arrives. A signal either meets the written conditions or it does not, and another competent trader reading the same rules should take exactly the same trades. Fully automated trading is one form of it, but plenty of systematic traders click their own orders; what makes it systematic is that nothing is left to the moment.
Discretionary trading keeps at least one of those decisions open. Most real traders sit somewhere between the two, which is why the useful question is not "which camp am I in" but "which of my decisions are committed and which are open."
| Factor | Discretionary trading | Systematic or rule based trading |
|---|---|---|
| Where the decision is made | In the moment, by the trader | Before the session, in the written rules |
| Can it be backtested | Only the committed parts | Yes, the whole method repeats |
| Adapts to unusual conditions | Quickly, if the trader reads them correctly | Only when the rules are rewritten |
| Main failure mode | Inconsistent execution, emotion, hindsight | Overfitting to past data, rigid in new conditions |
| What a losing week tells you | Hard to separate a bad call from normal variance | A normal loss or a rule that stopped working |
| Workload | Screen time and judgement every session | Research up front, monitoring after |
Where systematic and discretionary trading each go wrong
The systematic side has its own traps. The CME Group course warns that many system developers optimize until the system has no predictive value, fitting the past data to a conclusion, and that historical data is often corrupted with inaccuracies. A backtest that looks perfect has often just memorized the sample.
Discretionary trading's trap is quieter. Because the open decisions are never written down, a trader can believe a call is helping for years without any record that would show otherwise.
A quick test for your own method: write it out and mark every decision as committed or open. If entry, risk and exit are all open, there is nothing to test because nothing repeats. If they are committed and only take-or-skip is open, you have something measurable, because that call is a filter sitting on a fixed set of signals.
Related lesson: How to build a trading strategy
Technical analysis in discretionary trading
Technical analysis is where most discretionary trading decisions start. The trader reads price structure, key levels, trend and volatility, and decides whether the current situation is the one the setup was built for.
The common inputs are:
- Structure: higher highs and higher lows in an uptrend, the reverse in a downtrend, and ranges where neither holds.
- Levels: prior session highs and lows, opening ranges, and areas where price has reversed before.
- Trend filters: a moving average, such as a 200-period average on the trading timeframe, used to decide which direction to favour.
- Volatility: average true range (ATR), the average size of a bar's full range including gaps, used to judge whether the market is moving enough to reach a target and how wide a stop needs to be.
Each of those becomes a discretionary call when the trader applies it by eye. "The trend looks strong, so I'll only take longs" is a trend filter. "That breakout bar is huge, I'm not chasing it" is a volatility filter. The test later in this guide writes four calls like these as exact conditions so their effect can be counted.
The discipline that separates analysis from storytelling is invalidation. Every chart read should name the price or condition that proves it wrong. "Above the opening range high, favour longs; a close back inside the range cancels the idea" is a read you can act on. "It looks bullish" is not.
Related lesson: Technical analysis basics
Market sentiment and fundamentals behind discretionary calls
Discretionary traders also read the market's mood and the calendar, which a simple price rule ignores. That is one of the genuine advantages of discretionary trading: a person can notice that the session is waiting on an inflation report, or that positioning is crowded, and change behaviour before the chart reflects it.
Sentiment inputs that are published and checkable include:
- The CFTC Commitments of Traders (COT) report, which breaks down open interest in futures and options markets by trader category. The data is generally from Tuesday and released on Friday, so it describes positioning a few days old, not today's order flow.
- The Cboe Volatility Index (VIX), which Cboe describes as a measure of market expectations of near-term volatility conveyed by S&P 500 Index option prices. A rising VIX usually means wider ranges in equity index futures, which changes stop distances.
- Price behaviour itself: how the market reacts to good or bad news often says more about sentiment than the news does.
Fundamental analysis for a short-term trader is mostly about scheduled risk. The Consumer Price Index is released at 8:30 AM ET, and as of November 4, 2026 the next release (October data) is set for Tuesday, November 10, 2026. A discretionary trader might stand aside before that number, cut size, or wait for the first five minutes to settle. Each of those is a decision, and each can be written down and checked later.
The trap is using sentiment as a reason for every trade after the fact. If the COT report "explained" both the long you took on Monday and the short you took on Wednesday, it explained nothing. Decide in advance which reading would change your plan, and by how much.
Discretionary trading strategies by holding period
Discretionary trading looks different depending on how long a trade lasts, because the holding period decides how many open decisions a trader has to make.
- Day trading: positions open and close inside one session. Discretion usually sits in take-or-skip and in when to stop trading for the day. The decision count is high, so small biases compound quickly.
- Swing trading: positions held for days to weeks. Discretion moves to the higher timeframe, such as whether a pullback is a buying opportunity or the start of a reversal, and to overnight and weekend risk.
- Trend following: often run mechanically, but discretionary trend traders decide which markets are trending "cleanly" and when a trend has ended. The danger is exiting winners early because they feel stretched.
- Range trading and mean reversion: buying near support and selling near resistance inside a range. The open call is whether the range is still intact, and the cost of getting it wrong is a breakout that runs through the stop.
- Event trading: trading around scheduled releases. Discretion decides whether to trade the first move, the retest, or nothing at all, and slippage around the release is part of the risk.
None of these styles is inherently discretionary or systematic. The same opening range breakout can be traded by a robot or by a person who skips the ones that look wrong, which is exactly the comparison the test below makes.
Related lesson: Day trading vs swing trading
How the 134 trade opening range test was built
Saying anything measurable about discretionary trading needs a fixed set of signals. This guide's own test, first run for its previous version, uses one deliberately plain opening range rule:
- Long when a five-minute bar closes above the high of the first three bars, the 9:30 to 9:45 AM ET opening range.
- Short when a five-minute bar closes below the low of that range.
- Stop one ATR away, using the 14-period ATR on five-minute bars, with a target two ATR away (a two-to-one target).
- One long and one short at most per session, no new entry after 3:30 PM ET, flat at 4:00 PM ET.
The sample is 13,563 five-minute ES bars and 13,564 NQ bars, front-month continuous data, over 50 regular sessions from 8 July to 16 September 2026. Costs were charged at $17.50 per ES contract and $10.00 per NQ contract per round turn. ES moves $50 per index point and NQ $20 per index point, so those costs equal 0.35 and 0.50 points.
Baseline results from this guide's measurement, per contract after costs (the 95% interval is the average plus or minus 1.96 times the spread divided by the square root of the signal count):
| Instrument | Signals | Win rate | Average per trade | Spread of one trade | 95% interval |
|---|---|---|---|---|---|
| E-mini S&P 500 | 71 | 32.39% | -$35.97 | $680.46 | -$194.25 to $122.31 |
| E-mini Nasdaq-100 | 63 | 30.16% | -$117.94 | $1,782.40 | -$558.08 to $322.20 |
| Both instruments | 134 | 31.34% | -$74.51 | $1,319.34 | -$297.90 to $148.88 |
Neither instrument's result separates from zero. Fifty sessions is not enough to conclude that the rule fails, only that it has not been shown to work. That is the honest starting point for judging any filter laid on top of it.
The break-even arithmetic explains the negative average. With a two-to-one target and no costs, the break-even win rate is 33.33%. Costs push it up. On ES the median risk was 8.80 points, so the 0.35 point cost lifts the break-even rate to 34.66%. On NQ the median risk was 61.43 points and the 0.50 point cost lifts it to 33.60%. The rule won 32.39% and 30.16% of the time, just under the line on both.
Related lesson: Trading expectancy
What four discretionary filters did to 134 trades
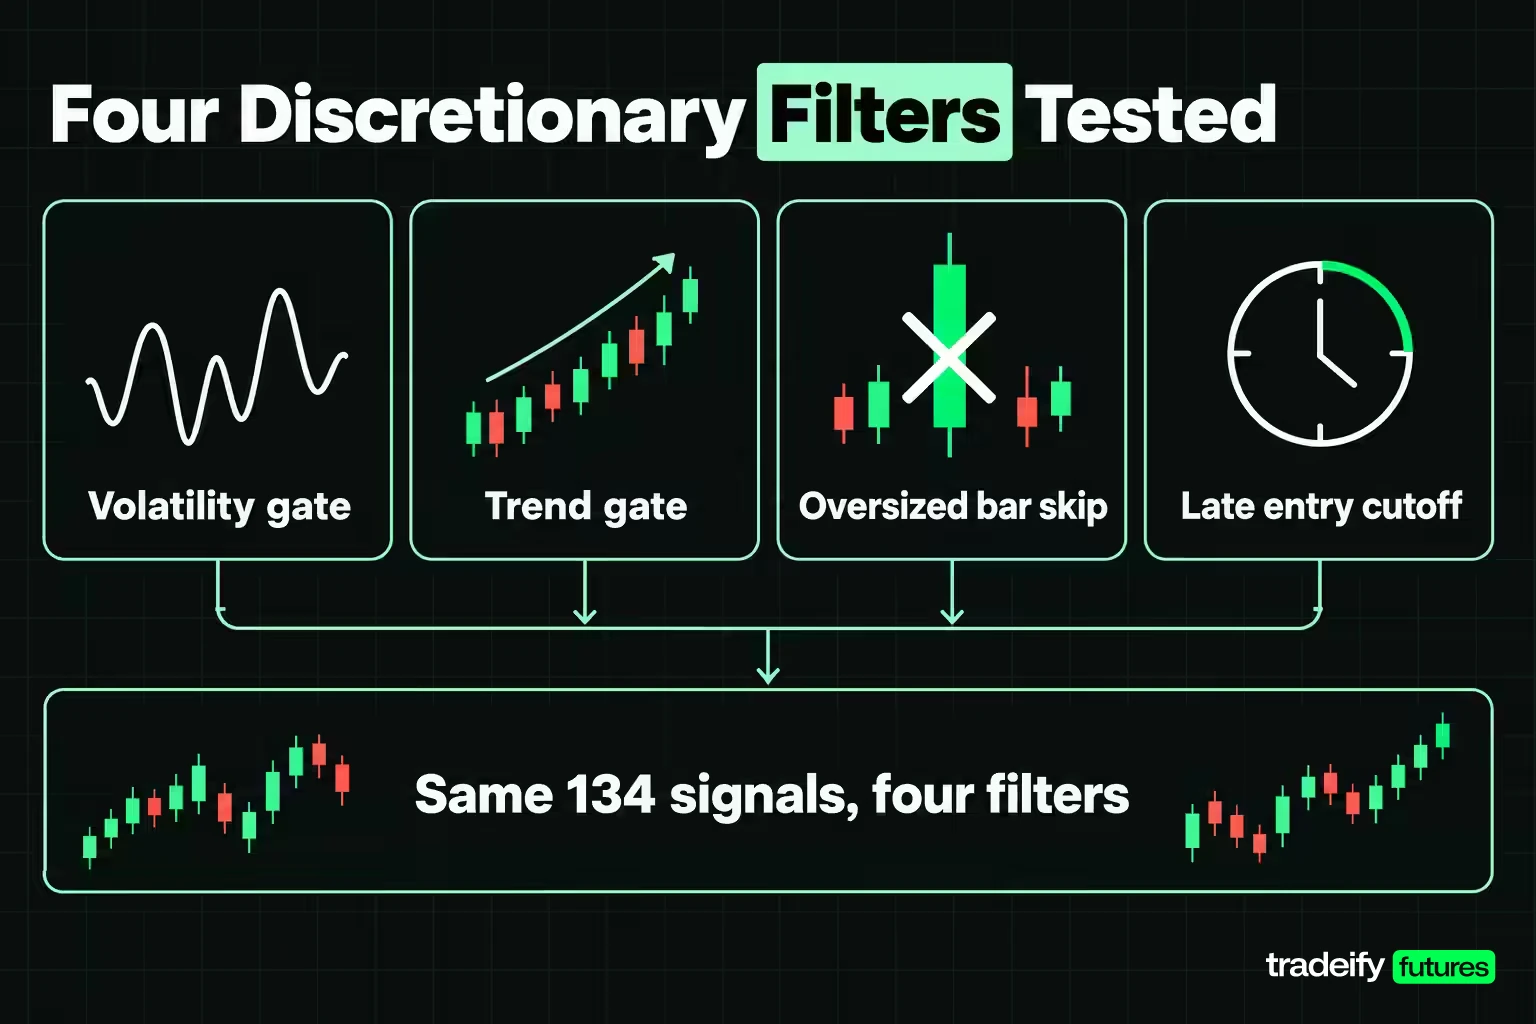
Each filter below is a discretionary call a trader might make on the day, written as a condition so it can be counted. All four were applied to the same 134 signals.
- Volatility gate: take the trade only when the 14-period ATR is at or above the median of its last 50 readings, so the market is moving at least as much as usual.
- Trend gate: take the trade only when it points the same way as price relative to the 200-period moving average.
- Oversized trigger bar skip: pass when the signal bar's range was 1.5 ATR or more, the "I'm not chasing that" case.
- Late entry cutoff: no new entry after 2:00 PM ET.
| Filter | Signals taken | Signals skipped | Taken average | Skipped average | Change vs baseline |
|---|---|---|---|---|---|
| Volatility gate | 125 | 9 | -$53.65 | -$364.23 | +$20.86 |
| Trend gate | 89 | 45 | -$160.91 | +$96.37 | -$86.40 |
| Oversized bar skip | 97 | 37 | -$28.63 | -$194.79 | +$45.88 |
| Late entry cutoff | 129 | 5 | -$55.62 | -$561.79 | +$18.89 |
Three of the four improved the average. The more useful view is what each one removed.
| Filter | Losing dollars removed | Winning dollars removed | Losers skipped | Winners skipped | 95% interval on taken average |
|---|---|---|---|---|---|
| Volatility gate | $4,445.54 | $1,167.50 | 7 | 2 | -$290.63 to $183.33 |
| Trend gate | $22,069.11 | $26,405.71 | 29 | 16 | -$420.70 to $98.88 |
| Oversized bar skip | $20,985.89 | $13,778.57 | 30 | 7 | -$297.48 to $240.22 |
| Late entry cutoff | $3,280.71 | $471.79 | 4 | 1 | -$285.77 to $174.53 |
Reading the filter results
In the 134 trade opening range test, the oversized bar skip (passing when the signal bar spans 1.5 ATR or more) is the call most traders would defend hardest, because passing on a bar that already ran feels like plain discipline. It removed $20,985.89 of losing trades, which looks like a filter doing its job. It also removed $13,778.57 of winners, including a single NQ short worth about $3,891. Every interval on the taken averages still contains zero, so none of the four filters turned the rule into something with a demonstrated edge.
The trend gate (trading only in the direction of the 200-period moving average) is the clearest warning. It removed the most losing dollars of any filter, 29.34% of all losing dollars in the sample, and still made the average worse, because the 45 trades it skipped averaged +$96.37. Split by instrument, the oversized bar skip did the opposite on each market: on ES the trades it kept averaged +$67.12 across 52 trades, the only positive filtered result in the study, while on NQ the kept trades averaged -$139.27 across 45. A call that helps on one market and hurts on the other is not yet a rule.
For scale, the 134 signals held 92 losing trades worth $75,221.96 and 42 winners worth $65,237.50. Skipping every loser in advance is hindsight, not a filter. The gap between that fantasy and what a real-time filter can remove is the price of deciding before you know the outcome.
How many trades a discretionary filter needs
A filter that improves an average has not been shown to work. The question is whether the improvement is larger than the noise around it. A simple way to estimate that: the number of trades needed for an average of a given size to clear a 95% interval is roughly (1.96 × spread of one trade ÷ edge) squared.
| Sample | Spread of one trade | Trades for a $25 edge | Trades for a $50 edge | Trades for a $100 edge |
|---|---|---|---|---|
| ES | $680.46 | 2,846 | 712 | 178 |
| NQ | $1,782.40 | 19,528 | 4,882 | 1,221 |
| Both | $1,319.34 | 10,700 | 2,675 | 669 |
Put the filter results against those numbers. The oversized bar skip's +$103.09 per trade on ES would need about 168 ES trades to stand out from noise, and the sample had 71. Its pooled +$45.88 would need about 3,177 trades. The trend gate's -$86.40 would need about 896. At two or three trades a day, that is months to years of honest records before a single filter is proven, and longer still on a market as volatile as NQ.
Stacking discretionary filters
Adding filters one after another, so each new condition has to be met as well, makes the problem worse rather than better.
| Conditions in force | Signals | Average per trade | Interval | Interval width | Clears zero |
|---|---|---|---|---|---|
| Baseline plus volatility gate | 125 | -$53.65 | -$290.63 to $183.33 | $473.96 | No |
| Plus trend gate | 82 | -$129.79 | -$407.96 to $148.39 | $556.35 | No |
| Plus oversized bar skip | 58 | -$111.64 | -$445.76 to $222.48 | $668.25 | No |
| Plus late entry cutoff | 57 | -$83.08 | -$418.34 to $252.19 | $670.52 | No |
Each condition removed signals faster than it removed uncertainty. The interval widened from $473.96 with one filter to $670.52 with four, because the sample fell from 125 signals to 57. This is the mechanical reason careful traders run out of data at the moment their method starts to look refined.
The filters also mostly describe different trades. The trend gate and the late entry cutoff had no skipped trade in common, and the trend gate and the oversized bar skip shared 10 skipped trades. Four filters that agree with your instinct are four separate ideas, each needing its own evidence.
Related lesson: Backtesting a trading strategy
The same filters on 85 newer trades
An effect that appears once can be luck. So the same opening range rule (a five-minute close beyond the 9:30 to 9:45 AM ET range, a one ATR stop and a two ATR target) and the same four discretionary filters (volatility gate, trend gate, oversized bar skip, late entry cutoff) were re-run on newer data from this guide's own measurement: five-minute ES and NQ bars from 22 September to 3 November 2026, 31 sessions per instrument, starting after the September contract expiry so the continuous data does not splice mid-sample. Costs, stops, targets and filter definitions were unchanged.
| Newer sample | Signals | Win rate | Average per trade | Spread of one trade | 95% interval |
|---|---|---|---|---|---|
| ES newer sample | 45 | 37.78% | $51.11 | $518.52 | -$100.39 to $202.61 |
| NQ newer sample | 40 | 30.00% | -$92.88 | $1,295.85 | -$494.46 to $308.71 |
| Both, newer sample | 85 | 34.12% | -$16.65 | $962.13 | -$221.19 to $187.89 |
ES came out positive this time and NQ negative again, against a 134 trade first sample that was negative on both, and once more every interval contains zero.
| Filter on newer sample | Taken | Skipped | Change vs baseline (both) | Change on ES | Change on NQ |
|---|---|---|---|---|---|
| Volatility gate | 81 | 4 | -$15.14 | -$4.37 | -$27.78 |
| Trend gate | 65 | 20 | -$29.51 | +$4.31 | -$79.37 |
| Oversized bar skip | 47 | 38 | +$90.42 | +$117.39 | +$59.01 |
| Late entry cutoff | 85 | 0 | $0.00 | $0.00 | $0.00 |
Which discretionary filter effects repeated
Across the two samples of the opening range test, two patterns repeated. The trend gate hurt the pooled average again (-$29.51 against -$86.40 in the first sample), almost entirely through NQ, and barely moved ES. The oversized bar skip helped ES again, by +$117.39 per trade this time against +$103.09 before.
Two did not. The volatility gate flipped from a small help to a small hurt, on only four skipped trades. The oversized bar skip flipped sign on NQ, from -$21.33 in the first sample to +$59.01. The late entry cutoff had nothing to filter: no signal in the newer sample came after 2:00 PM ET.
Even the best repeat is not proof yet. With the newer sample's spread of $962.13, the oversized bar skip's +$90.42 pooled improvement would need about 435 trades to clear its interval, and the sample had 85. What two samples do give you is a ranking of where to look next: the oversized bar skip on ES deserves a longer record, and the trend gate on NQ deserves to be dropped unless new evidence says otherwise.
Two ES trades where the oversized bar skip cut both ways
These two trades come from the 134 trade opening range test (five-minute ES bars, 8 July to 16 September 2026). They show one discretionary call, skipping a signal bar that spans 1.5 ATR or more, helping once and costing once. Prices are actual five-minute ES bars from the study data, and each trade risks one ATR for a two ATR target.
The first is an ES long on 14 July 2026. The opening range was 7585.50 high and 7564.25 low, and the 10:30 bar closed at 7591.00, above the range high, so the rule went long. ATR on that bar was 13.38 points, rounded to a 13.50 point stop at 7577.50, with the target at 7618.00.
| Time (ET) 14 July | Open | High | Low | Close |
|---|---|---|---|---|
| 10:30 | 7577.25 | 7603.75 | 7575.00 | 7591.00 |
| 10:35 | 7591.00 | 7592.00 | 7585.75 | 7589.75 |
| 10:40 | 7589.75 | 7593.75 | 7580.00 | 7581.75 |
| 10:45 | 7581.50 | 7585.00 | 7578.25 | 7579.25 |
| 10:50 | 7579.25 | 7586.75 | 7575.25 | 7586.75 |
| 10:55 | 7586.75 | 7590.50 | 7585.75 | 7587.50 |
| 11:00 | 7587.50 | 7600.75 | 7583.25 | 7594.00 |
The trigger bar covered 28.75 points from high to low, about 2.15 ATR. That is the oversized bar case, and a trader watching price run that far in five minutes has a real argument for passing. Passing was right: the 10:50 bar traded down to 7575.25, through the stop, for a loss of $692.50 after costs.
An ES short where the same skip would have cost money
The second trade is an ES short on 5 August 2026, under the same opening range rule. The opening range was 7820.25 high and 7804.00 low, and the 10:25 bar closed at 7799.75, below the range low, so the rule went short with a 15.75 point stop at 7815.50 and the target at 7768.25.
| Time (ET) 5 August | Open | High | Low | Close |
|---|---|---|---|---|
| 10:25 | 7809.50 | 7814.25 | 7799.25 | 7799.75 |
| 10:30 | 7799.75 | 7802.50 | 7794.00 | 7798.25 |
| 10:35 | 7798.00 | 7800.75 | 7790.25 | 7791.25 |
| 10:40 | 7791.00 | 7796.25 | 7788.00 | 7792.25 |
| 10:45 | 7792.00 | 7799.25 | 7790.25 | 7798.00 |
| 10:50 | 7797.75 | 7800.50 | 7776.00 | 7783.25 |
| 10:55 | 7783.00 | 7789.25 | 7778.75 | 7786.25 |
The trigger bar covered 15.00 points, about 0.95 ATR, so nothing looked unusual and the same filter takes the trade. It reached the target at 11:15 for $1,575.00 gross and $1,557.50 net. Over the full sample the filter did both often enough that its net effect stayed inside the noise.
An NQ short where the trend gate helped
The trend gate has its own version on NQ. On 21 July 2026 the 10:00 bar closed at 29113.25, below the opening range low of 29129.50, while price sat above the 200-period average. A trend filter refuses that short, and refusing it was right: the stop at 29202.75 was hit 25 minutes later for a loss of $1,800.00 after costs. One trade like that can carry a filter's whole reputation, and one trade is not a sample.
Consistency in discretionary trading
Consistency in discretionary trading is harder to reach than in systematic trading for a simple reason: the method itself varies. If the same setup is taken one day and skipped the next, two months of results are a mix of the setup's edge and the trader's mood.
Consistency here does not mean winning every week. It means the same process applied to the same situations, so that the results describe the method. A few practical ways to get there:
- Keep the open column small. One open decision, usually take-or-skip, can be measured. Four open decisions are a different method every week.
- Fix risk per trade in advance, so a good or bad call changes how often you win, not how much each trade can cost.
- Write the reason for every skip at the time you skip, in one line, before you know how the trade would have turned out.
- Review in batches of trades, not days. A filter's effect usually needs hundreds of signals before it stands out from normal noise.
Consistency is also not the same as profitability. In this guide's 134 trade opening range test, the mechanical baseline rule was perfectly consistent and still lost $74.51 per trade on average. Consistency makes a method readable; it does not make it good.
Discretionary trading psychology and discipline
Discretionary trading puts emotion directly into the decision loop, which is why the CME Group course stresses that discipline must stay at the front. A systematic trader can feel fear and still follow the rule. A discretionary trader's fear can become the rule.
The recurring pressure points are recognizable:
- After a loss, the next valid setup feels worse than it is, and skipping it feels like discipline. Often it is just flinching.
- After a missed winner, the next marginal setup feels better than it is, and taking it feels like making up for the miss.
- After a winning streak, size creeps up because confidence is high, which is the opposite of what a short sample justifies.
- Near a daily loss limit or a weekly goal, the open calls tilt toward whatever gets the number back fastest.
The fix is to move as many of those reactions as possible into precommitted rules. Decide before the session what a loss means for the next trade (nothing, if risk was taken correctly), how many trades you will take at most, and the condition that ends the day. Then the remaining discretion operates inside a fence the emotional version of you cannot move.
It also helps to separate two questions after each trade. Was the decision sound given what was known, and did it win? A sound decision can lose, and a reckless one can win. Judge calls by outcome and the market will teach you the wrong lessons, one lucky trade at a time.
Related lesson: Trading discipline
Common discretionary trading mistakes
The mistakes that sink discretionary trading are mostly measurement mistakes dressed up as judgement.
- Building filters from hindsight. Looking back at losers and finding something they had in common produces a filter that fits the past, the discretionary version of the overfitting the CME Group course warns about in systems.
- Not recording skipped trades. Without the trades you passed on, there is no control group, so you can never tell whether skipping helped.
- Moving the stop on a feeling. An open exit turns every trade into a different trade and makes the risk per trade unknowable.
- Judging a call on one instrument. In this guide's opening range test, skipping oversized signal bars helped ES and hurt NQ over 134 trades, then helped both over 85 newer trades.
- Stacking filters to explain every loss. Each added condition shrinks the sample and widens the uncertainty, so four stacked filters can leave too few trades to judge any of them.
- Treating a strong opinion as evidence. Conviction is a feeling about a trade, not a measurement of the method.
The common thread is that each mistake feels like skill in the moment. A skipped loser feels like a good read, and a skipped winner is forgotten by lunch. The only defence is a record made before the outcome is known.
Risk management when the trigger is a judgement call
In discretionary trading, the safest place for judgement is the entry decision, and the least safe place is position size. Keep risk mechanical even when the trigger is not.
Start with a fixed dollar risk per trade and work backwards to contract count. ES moves $50 per index point and the Micro E-mini S&P 500 (MES) moves $5 per point. With an illustrative stop of 10 points:
- One ES contract risks 10 × $50 = $500.
- One MES contract risks 10 × $5 = $50.
- If the plan allows $150 of risk per trade, that is 3 MES contracts; ES is too large for that plan at that stop.
Stop placement should come from the chart read, not from the dollar amount. If the structure needs a 20 point stop, the answer is fewer contracts, not a tighter stop that sits inside normal noise. The study used one ATR for exactly that reason: the stop scales with how much the market is moving.
Informal rules of thumb can help set the outer limits. The 3-5-7 rule, for example, is an informal guideline rather than a standard industry rule: risk no more than 3% of the account on one trade, keep combined open risk under 5%, and the third number is read in different ways, usually as a profit-side target. Many traders use much smaller figures.
Finally, cap the damage a bad day of judgement can do. A daily stop, set before the session, keeps one tilted morning from undoing weeks of careful calls.
Related lesson: Risk of ruin
How to backtest and journal a judgement based method
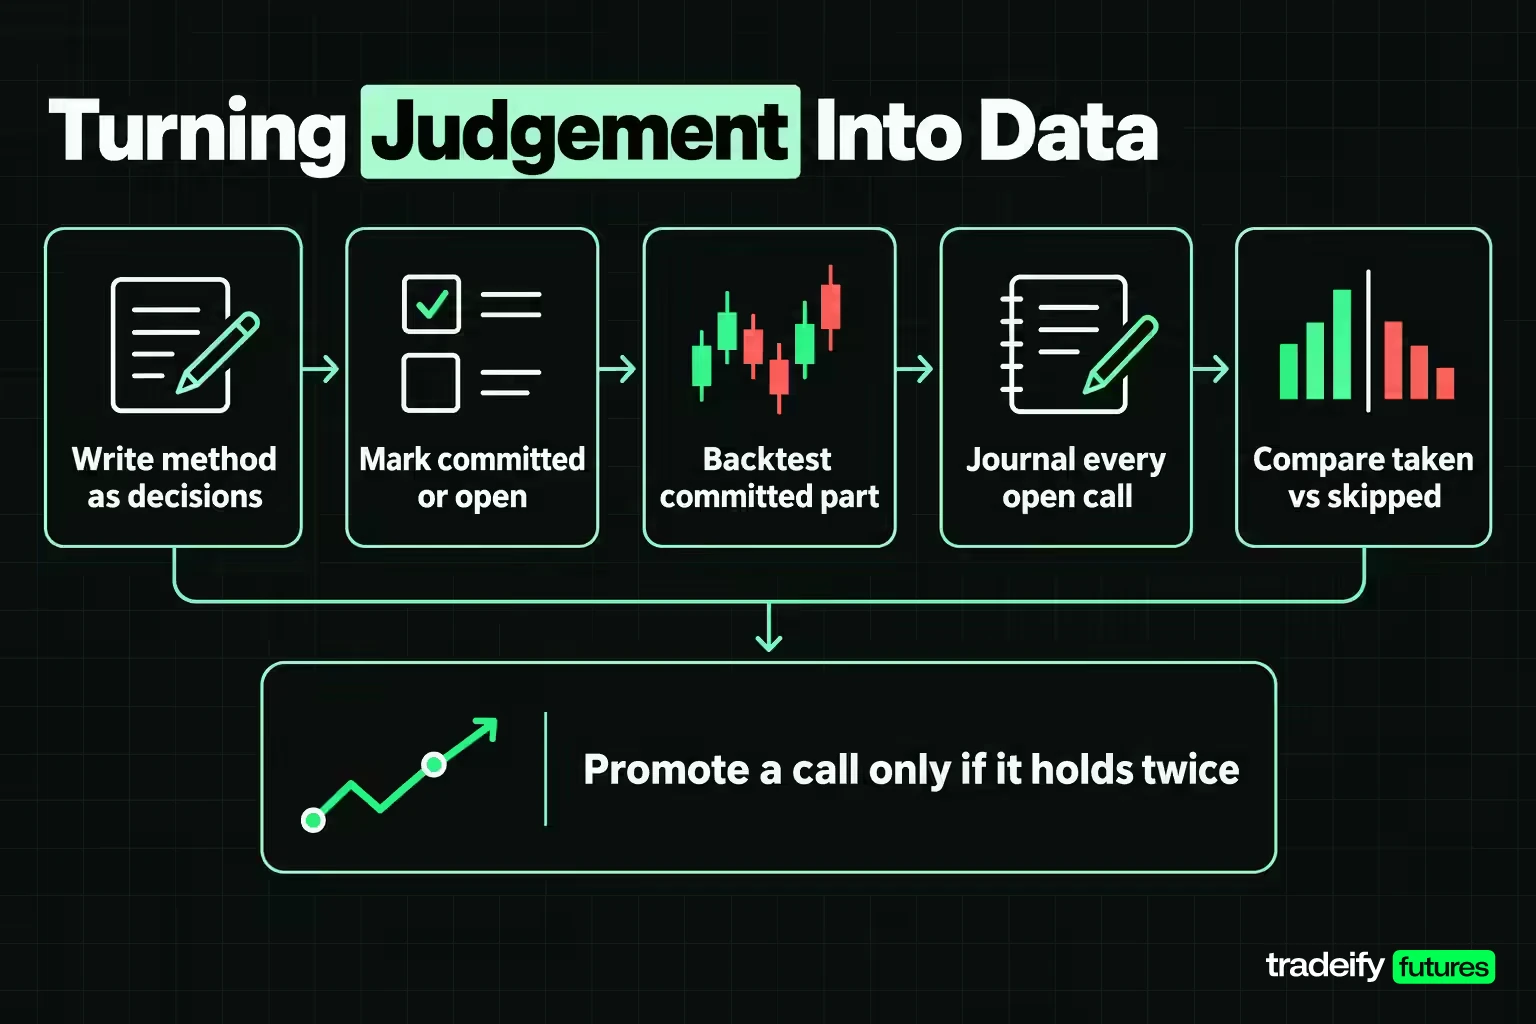
You cannot backtest a feeling, but you can backtest everything around it and journal the rest. That split turns discretionary trading into something you can improve.
- Write the method as decisions: entry condition, stop distance, position size, exit, and take-or-skip.
- Mark each decision as committed or open. Anything you cannot state as a condition another person could apply is open.
- Backtest the committed part on historical data, such as a simple opening range breakout rule, so you know the baseline before any judgement is applied.
- Trade with the smallest open column you can manage, ideally take-or-skip only.
- Record the open call for every signal, including the ones you take, with the reason written before the outcome.
- Compare the taken set against the skipped set on average result per trade, spread and count. If the difference is small next to the spread of one trade, roughly needing more than (1.96 × spread ÷ difference) squared trades to show, you have a preference, not a filter.
- Promote a call into the committed rules only when it holds on a second sample or a second instrument.
Tools that support discretionary trading are simple. A spreadsheet journal with a taken or skipped column does most of the work. Chart replay features, which many trading platforms include, let you practise the open call on historical bars without knowing the outcome, as long as you record each decision before advancing the chart.
Related lesson: How to keep a trading journal
Discretionary trading in a futures prop evaluation
A prop evaluation adds hard limits that a personal account may not have, such as a daily loss limit, a trailing drawdown and a time by which positions must be closed. Those limits are fixed rules sitting on top of whatever discretion you use, and they decide which open calls are affordable. A trader whose discretionary exits sometimes let losers run will meet the daily limit long before a filter has enough trades to judge.
The practical approach is to treat the account rules as the outer committed layer, set personal risk limits inside them, and keep discretion to the take-or-skip decision while the method is being measured. Note every skipped signal at the time, because a month of evaluation trading is too short to prove a filter, but long enough to start the record.
On our accounts, every position must be closed by 4:45 PM ET on regular trading days and nothing is held overnight, so a discretionary "let it run" call always ends at the session close. Our Growth evaluations carry a daily loss limit, $1,250 on a 50K account, that puts the account in liquidation-only until the next trading day when it is hit, and supported platforms let you add your own fence inside it, such as Tradovate's personal Risk Settings or Tradesea's lockout timer. WealthCharts includes Chart Replay for practising the take-or-skip call on historical bars. Our funded accounts are simulated.
Discretionary trading FAQ
What is the difference between mechanical and discretionary trading?
Mechanical trading follows written rules for every decision, so the same signals always produce the same trades. Discretionary trading keeps at least one decision, usually take-or-skip, with the trader in the moment. Most traders mix the two, so the useful question is which decisions you leave open.
Is discretionary trading better than systematic trading?
Neither is better in general. Systematic methods are easier to test and repeat, while discretionary methods can adapt to conditions a rule never anticipated. In the 134 trade test here, no discretionary filter proved an edge, which shows how hard discretion is to verify rather than that it never works.
Can you backtest a discretionary trading strategy?
You can backtest the committed parts and journal the open parts. Record every signal with a taken or skipped flag and the reason, then compare the two sets once you have enough trades. Without the skipped trades there is no control group.
How much can a day trader make with $1,000?
A day trader with $1,000 has no reliable expected income, and many traders with small accounts lose money. Account size mainly limits risk: with $1,000, a 10 point stop on one MES contract risks $50, or 5% of the account. That leaves little room for a normal losing streak, so the realistic first goal is surviving long enough to measure a method.
What is the 3-5-7 rule in trading?
The 3-5-7 rule is an informal money management guideline that caps risk at 3% of the account per trade and 5% across open positions. It is not an exchange or regulatory rule. The 7 is read in different ways, usually as a profit-side target, and many traders risk far less than 3%.
Which suits a beginner, discretionary or rule based trading?
Rule based trading is usually easier to learn from, because a loss can be traced to either the rule or normal variance. A beginner with open entries cannot tell a mistake from bad luck. Starting with written rules and adding one measured discretionary call later is a sensible order.
This guide is educational and describes one rule and four filters measured on historical futures data. It is not investment advice or a recommendation to trade any instrument or method. Futures trading uses leverage and can produce losses larger than expected, and results on historical bars do not reflect real fills, slippage or how a trader behaves under live risk. Evaluation and funded prop accounts are simulated, and past results in any account do not predict future ones.


