



TL;DR: Swing trading means holding a position for several days to a few weeks to catch one price leg, accepting overnight risk. On 155 ES and NQ breakout signals from 2021 to 2026, stops under 1 ATR mostly lost to normal noise. The best stop and target changed from year to year, so test a swing rule on several years and size from the stop.
The hard part of swing trading is rarely finding a setup. It is deciding how much room to give a trade you will not be watching overnight, and how big to be once you have given it that room.
Swing trading is a trading style where you hold a position for several days to a few weeks to capture one move in price. This guide covers what swing trading is, how it compares with day trading, the main strategies, patterns and indicators, and then tests one plain swing trading rule on five years of E-mini futures data so you can see what the stop, the target and the hold time actually do.
What Swing Trading Is and How It Works
Swing trading sits between day trading and investing. A swing trader is not trying to be right about the next five minutes or the next five years. The aim is to be right about the next leg, the multi-day move that follows a breakout, a pullback in a trend or a turn at the edge of a range. Investopedia describes it as trading short-term price moves that play out over several days to a few weeks.
The defining choice is holding through the close. Once a position stays open overnight, you own the move that happens while you are not watching. News can land after the close, and a futures market can travel a long way during the overnight session before you are back at the screen. Investopedia lists that overnight and weekend exposure as a core risk of the style.
In exchange, you get time. A swing trade does not need to work in the next ten minutes, and you do not need to be at the screen when it does. It needs to work over days, which means the target can be larger, and you make far fewer decisions. The price of that time is a wider stop, because a stop has to survive several sessions of ordinary movement, and a wider stop means a smaller position.
A typical swing trade has four parts:
- A setup on a daily or 4-hour chart, such as a breakout above a recent high or a pullback to a rising moving average.
- An entry level and an invalidation level, the price that says the idea was wrong.
- A target or exit rule, such as a fixed multiple of the risk, a trailing stop, or a time limit.
- A position size calculated from the distance between entry and invalidation.
Swing Trading vs Day Trading and Position Trading
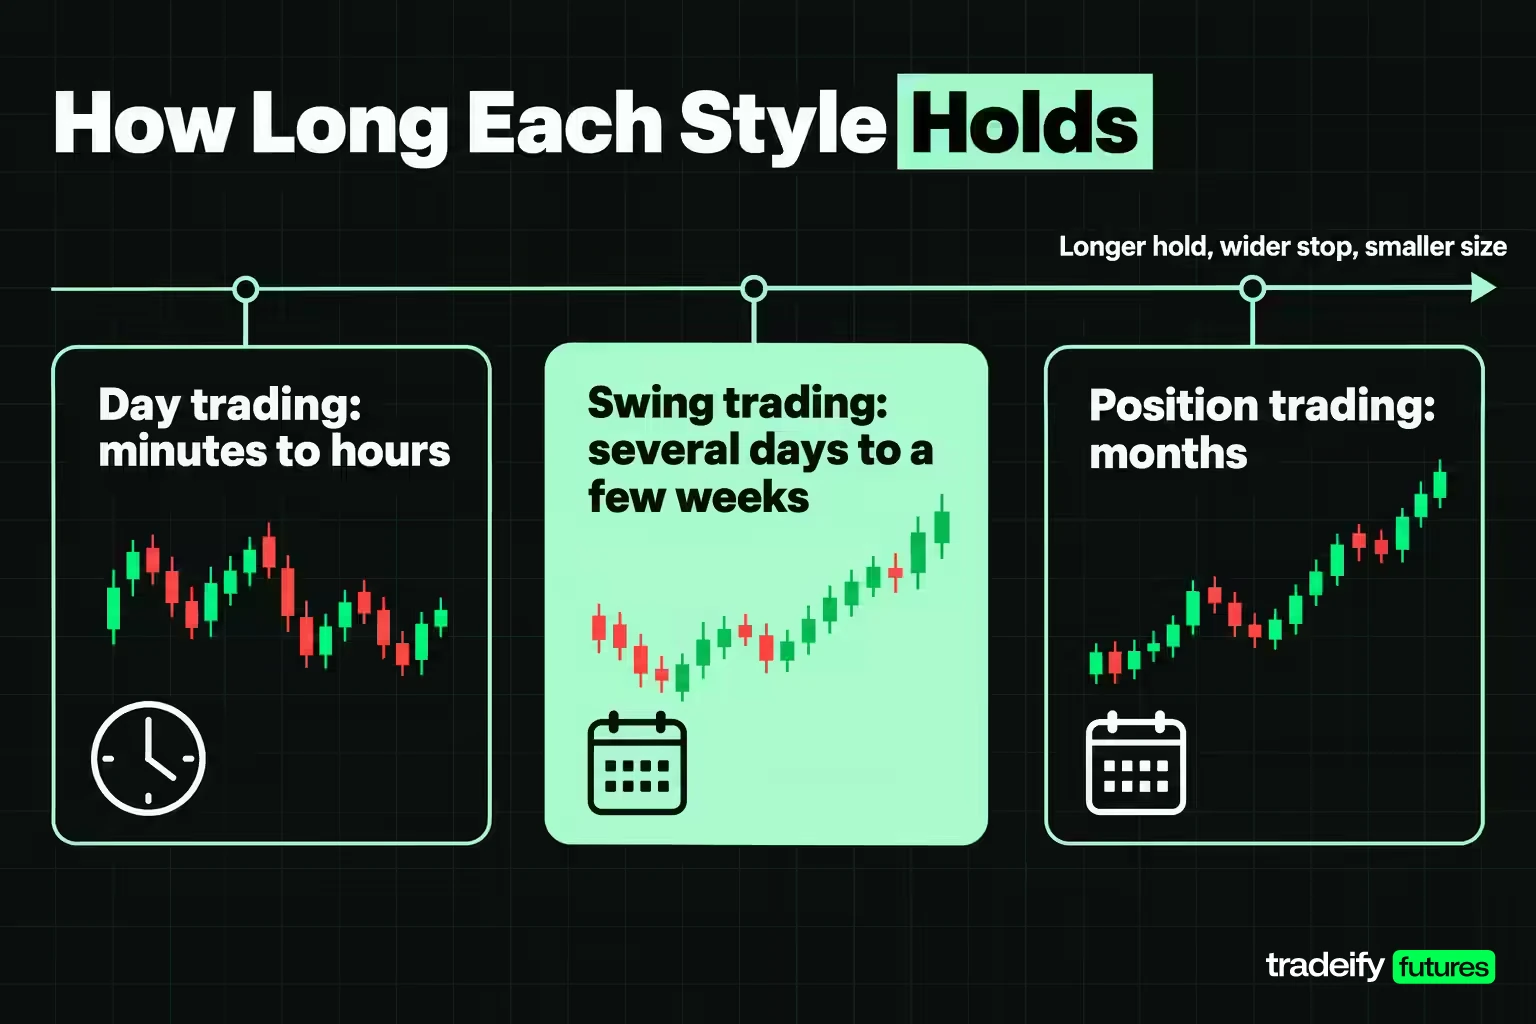
Swing trading differs from day trading and position trading mainly in how long you hold, and everything else follows from that. A longer hold means a wider stop, a smaller size, fewer signals and exposure to whatever happens while the market is moving and you are asleep.
| Style | Typical hold | Stop width | Signals | Overnight exposure |
|---|---|---|---|---|
| Day trading | Minutes to hours, flat by the close | Tight, a few points on ES | Several per session | None |
| Swing trading | Several days to a few weeks | Wide, often 1 to 2 daily ATR | A handful per month per market | Every night and weekend |
| Position trading | Months | Widest, thesis based | A few per year | Constant |
Day trading closes every position before the session ends. The stop can be tight because it only has to survive intraday noise, and the trader gets many attempts, but commissions take a bigger share of each small move.
Swing trading holds across closes. In the test later in this guide, a daily breakout rule produced between 9 and 23 signals per market in a full year. A rule that fires several times a session on a 5-minute chart fires a handful of times a month on a daily chart, so a year of swing trading is a small sample.
Position trading holds for months and is usually driven by a broader thesis, such as an economic or earnings view, rather than a chart setup.
Related lesson: Day trading vs swing trading
Swing Trading Strategies and Entry Methods
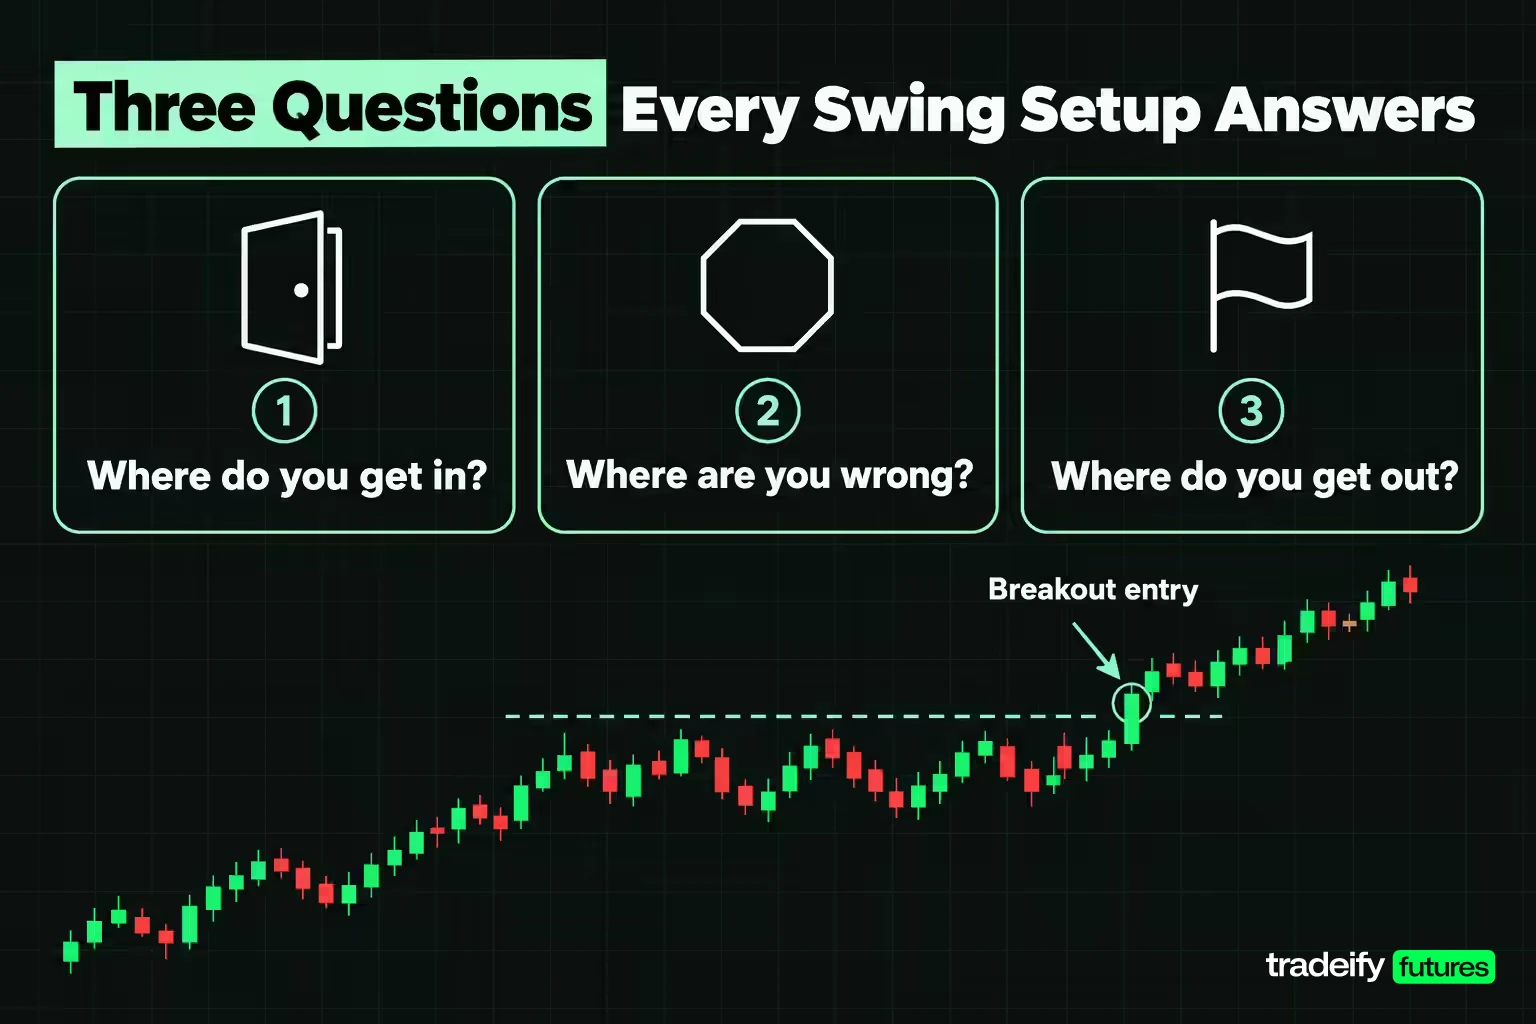
Swing trading strategies fall into a few families. Each one answers the same three questions in a different way: where do you get in, where are you wrong, and where do you get out.
Breakout swing trading
A breakout entry buys when price closes above a recent high, such as the highest high of the last 20 sessions, or above the top of a consolidation. The logic is that a market making new highs has buyers in control. The stop usually goes below the breakout level or a fixed multiple of ATR below the entry. The failure mode is the false breakout, where price closes above the level and then falls back inside the range within a few sessions.
Pullback swing trading in a trend
A pullback entry waits for a trending market to retrace toward support, such as a rising 20- or 50-day moving average or a prior breakout level, and buys when it turns back up. The appeal is a better price and a tighter invalidation than a breakout. The risk is that a pullback can turn into a reversal, and you only find out which one it was after the fact.
Range and channel swing trading
In a sideways market, a swing trader can buy near the bottom of the range and sell near the top, with a stop just outside the range. This works while the range holds and fails hard when it breaks, so the stop placement matters more than the entry.
Moving average swing trading
Some swing traders use a moving average crossover or a close above or below a moving average as the trigger. It is simple and testable, but moving averages lag, so in a choppy market the signals arrive late and reverse often.
Related lesson: Breakout trading
Chart Patterns Swing Traders Use
Chart patterns give a swing trader a visual way to define an entry and an invalidation level on the same chart. The pattern is only useful if it tells you both.
- Trend structure. Higher highs and higher lows define an uptrend. A swing trader buying pullbacks wants the last higher low to hold, so it becomes the invalidation level.
- Flags. A sharp move followed by a short, tight drift against it. The entry is a break of the flag in the direction of the original move, and the stop goes on the other side of the flag. Thomas Bulkowski's pattern research notes that tight flags tend to perform better than loose, jagged ones.
- Bases and breakouts. A sideways stretch after a decline or advance, followed by a close above its top. The longer and tighter the base, the clearer the level that should not be revisited.
- Double bottoms and double tops. Two tests of the same level that hold, followed by a break of the middle peak or trough. The second test gives a natural stop just beyond it.
- Support and resistance. Prior highs, lows and breakout levels where price reacted before. Most swing trading stops and targets reference one of these.
A pattern describes what price did. It does not tell you the odds that it continues, which is why a swing rule needs testing on many examples rather than a few well-chosen charts.
Swing Trading Indicators and What Each One Changes
Indicators compress several days of price into one readable line. Investopedia lists moving averages, RSI, MACD, and support and resistance as common swing trading tools. The useful question for each is what it changes about your entry, stop or exit.
- Moving averages define trend direction and act as pullback areas. Common lengths are 20, 50 and 200 sessions; an exponential moving average weights recent prices more heavily than a simple one.
- RSI, the relative strength index developed by J. Welles Wilder, moves between 0 and 100. StockCharts notes that readings above 70 are generally treated as overbought and below 30 as oversold, with 14 periods as Wilder's default. In a strong trend, RSI can stay overbought for weeks, so it works better as a pullback filter than as a sell signal.
- ATR, the average true range, measures how far price typically travels in a session, including gaps. It says nothing about direction. For a swing trader, ATR is the most practical indicator because it sets the stop distance and therefore the position size.
- MACD tracks the gap between two moving averages and is used to judge momentum and spot divergence.
An indicator that changes none of the entry, the stop or the exit is decoration. If you add one, test the rule with and without it.
Related lesson: Average true range ATR
Finding Swing Trading Candidates
Finding swing trading candidates is mostly about filtering out markets that do not fit the method. Keep the screen short:
- Liquidity. Tight spreads and steady volume, so entries and stops fill close to the planned price.
- A clean structure on the daily chart. A clear trend for breakout and pullback methods, or a clear range for range methods. A chart you have to squint at is a pass.
- Volatility that fits your risk budget. If a normal stop on the instrument is larger than the amount you are willing to lose, the instrument is too big for the account, however good the setup looks.
Stock swing traders often run screeners for new highs, volume surges or pullbacks to moving averages. Futures traders usually work from a short list of liquid contracts, such as the E-mini S&P 500 (ES), E-mini Nasdaq-100 (NQ) and their micro versions.
A Swing Trading Breakout Rule Tested on ES and NQ
A swing trading rule you can test has to be specific enough that two people would take the same trades. Here is the one tested for this guide. It is deliberately plain so the arithmetic is easy to check.
- Entry. Buy at the daily close of the first session that closes above the highest high of the previous 20 sessions. If the prior session already closed above its own 20-session high, it is not a new signal.
- Risk unit. The 14-period average true range (ATR) at the entry bar. Every result is expressed in multiples of that ATR, so ES and NQ results can be pooled.
- Stop. A fixed multiple of ATR below the entry: 0.5, 1.0, 1.5 or 2.0.
- Target. A fixed multiple of ATR above the entry: 1.0, 2.0 or 3.0.
- Time stop. Exit at the close of session 5, 10 or 20 if neither level is hit.
The data is daily E-mini S&P 500 (ES) and E-mini Nasdaq-100 (NQ) front-month futures bars from Yahoo Finance, with signals from December 20, 2021 to October 6, 2026 and every trade followed for up to 20 sessions through November 4, 2026. That produced 155 signals, 80 on ES and 75 on NQ. Median ATR at entry was 69.43 points on ES and 289.04 points on NQ.
Two adjustments keep the test honest. First, futures contracts expire every quarter, and a continuous chart jumps when it switches to the next contract. The price history before each switch was shifted by the size of that jump, measured against the cash index, and expiry-day bars were removed, so the roll does not show up as a fake rally. Second, if a session opened beyond the stop or target, the fill is the open, not the level. If one session touched both, the stop was assumed to hit first.
What the test leaves out matters too. No commissions, slippage or position sizing were modelled, and the sample is two closely related US stock index futures, long only, in a period when both rose. Treat it as an illustrative study of how stop, target and hold time interact, not as a strategy result.
What 155 Swing Trading Signals Did After Entry
Before choosing any stop, it helps to see what swing trading signals do on their own. The table below exits all 155 signals at the close of the hold window with no stop and no target. Heat is the deepest move against the entry, and peak is the best move in favor, both as medians in ATR.
| Hold window | Median heat (ATR) | Median peak (ATR) | Mean result (ATR) | Win rate |
|---|---|---|---|---|
| 1 session | 0.27 | 0.35 | +0.094 | 54.2% |
| 2 sessions | 0.43 | 0.51 | +0.027 | 55.5% |
| 5 sessions | 0.70 | 0.85 | +0.126 | 56.1% |
| 10 sessions | 1.15 | 1.27 | +0.313 | 63.9% |
| 20 sessions | 1.70 | 2.25 | +0.465 | 61.9% |
Two things stand out. Heat grows almost as fast as peak. Over 20 sessions the typical signal went 1.70 ATR against the entry at some point and 2.25 ATR in favor. A longer hold buys a bigger move, and it demands a bigger stop to stay in it.
The second point is less comfortable. In the same Yahoo Finance ES and NQ data, buying at the close of every session in the same period and holding for 20 sessions returned +0.48 ATR on average with a 61.0% win rate, across 2,376 entries. The breakout signals returned +0.465. Over these five years, the entry signal alone added nothing over simply being long a rising market.
That is not a reason to throw the rule out. It is a reason to be precise about where any edge comes from. With a 2 ATR stop and a 2 ATR target, the signals returned +0.330 ATR per trade against +0.138 for the every-session baseline. The edge, if there is one, came from how the trades were managed, not from the entry. Without the baseline comparison, it would be easy to credit the breakout for what the market's drift did.
How Stop Width Changes a Swing Trading Result
Stop width is the variable that decided most of the 155-signal ES and NQ breakout test in this guide (a long entry on a close above the prior 20-session high, December 2021 to October 2026). The table holds the rule fixed and changes only the stop and the target, all with a 20-session time stop. Each cell reads mean result in ATR, win rate, profit factor.
| Stop | Target 1.0 ATR | Target 2.0 ATR | Target 3.0 ATR |
|---|---|---|---|
| 0.5 ATR | -0.007, 32.9%, 0.98 | +0.015, 20.6%, 1.04 | +0.040, 16.8%, 1.10 |
| 1.0 ATR | +0.133, 56.8%, 1.31 | +0.154, 39.4%, 1.26 | +0.136, 32.3%, 1.20 |
| 1.5 ATR | +0.122, 64.5%, 1.24 | +0.117, 47.1%, 1.15 | +0.055, 38.7%, 1.06 |
| 2.0 ATR | +0.226, 73.5%, 1.46 | +0.330, 58.7%, 1.43 | +0.330, 51.6%, 1.39 |
Why a tight swing trading stop fails
Start with the 0.5 ATR stop row. In this guide's test, with a 0.5 ATR stop, 100 of the 155 breakout signals were stopped out within 5 sessions and 128 within 20. Of those 128 losers, 28 went on to rally 3 ATR above the entry inside the same 20 sessions. A half-ATR stop sits inside the ordinary daily range, so it loses to normal movement rather than to being wrong.
The same point shows up in the winners of this guide's test. Of the 87 breakout signals that eventually reached +2 ATR, the median heat taken on the way was 0.71 ATR, and 34 of them (39%) went more than 1 ATR against the entry first. A 1 ATR stop would have cut all 34 before they paid.
Heat early in the trade is a weak warning, not a verdict. In this guide's ES and NQ breakout test, signals that went more than 1 ATR against the entry in the first 5 sessions reached +2 ATR 45% of the time, against 63% for those that stayed within 1 ATR. That is a difference worth journaling, not a reason to bail on every trade that starts badly.
Why the best swing trading stop changes from year to year
In this guide's 155-signal ES and NQ breakout test, the 2 ATR stop looked best over five years, but the year-by-year split says to be careful. Here is that setting next to a 1 ATR stop with a 3 ATR target, by signal year:
| Signal year | Signals | 2.0 stop, 2.0 target | 1.0 stop, 3.0 target |
|---|---|---|---|
| 2022 | 22 | -0.619 | -0.323 |
| 2023 | 34 | +1.089 | +0.686 |
| 2024 | 42 | +0.583 | -0.079 |
| 2025 | 34 | +0.130 | -0.151 |
| 2026 | 23 | -0.050 | +0.576 |
The 2022 row includes one December 2021 signal, and 2026 covers signals through October 6. In the 2022 bear market, both settings lost. In 2026, the ranking flipped. Looking only at the last 12 months (24 signals from November 4, 2025), the 1 ATR stop with a 3 ATR target returned +0.51 ATR per trade with a 1.87 profit factor, while the 2 ATR stop and target lost -0.131.
A trader who tested this rule on one recent year would have picked the setting that the five-year sample ranks near the middle. A year of swing trading signals per market is often 20 trades or fewer, which is not enough to tell a good setting from a lucky one.
Related lesson: Win rate vs payoff ratio
Three Swing Trades Read Session by Session
Averages hide what a swing trade feels like while it is open. Here are three real signals from the ES sample, all using the 2 ATR stop, the 2 ATR target and the 20-session time stop. Prices are the actual front-month contract prices at the time.
| Detail | Trade A | Trade B | Trade C |
|---|---|---|---|
| Entry date | April 24, 2026 | October 1, 2025 | August 13, 2025 |
| Entry (close) | 7,194.75 | 6,761.50 | 6,488.75 |
| Prior 20-session high | 7,185.75 | 6,756.75 | 6,470.00 |
| ATR at entry | 102.87 | 58.99 | 65.95 |
| Stop (2 ATR) | 6,989.01 | 6,643.52 | 6,356.86 |
| Target (2 ATR) | 7,400.49 | 6,879.48 | 6,620.64 |
| Exit | Target, session 9 | Stop, session 7 | Time stop, session 20 |
| Result | +2.00 ATR | -2.00 ATR | +1.57 ATR |
Trade A, a swing trade that worked
Trade A, the ES breakout bought at 7,194.75 on April 24, 2026 with a 2 ATR stop at 6,989.01 and a target at 7,400.49, is the version most traders imagine when they start swing trading. The deepest dip was 7,131.25 on April 29, only 0.62 ATR against the entry, and the target filled on May 7 when ES traded up to 7,410.50. Price kept going to 7,540.00 by May 14, 3.36 ATR above the entry, so the fixed target left a good part of the move behind. That is the cost of a rule that does not make a fresh decision every session. On one ES contract, the 205.74-point gain was worth $10,287; on one MES, $1,028.70.
Trade B, stopped out before the move
Trade B, the ES breakout bought at 6,761.50 on October 1, 2025 with a 2 ATR stop at 6,643.52 and a target at 6,879.48, is the one that tests discipline. It drifted sideways for six sessions, then ES fell from a 6,779.25 close to a 6,540.25 low on October 10, through the 6,643.52 stop. The loss was 117.98 points, $589.90 on one MES. Then the market turned. By October 27 it had traded above the old target, and by October 29 it reached 6,952.00, 3.23 ATR above the entry. The stop did its job, and the idea still worked. Both things are true. Watching a stopped trade hit your old target is part of swing trading, and the urge to re-enter late or skip the next stop is the thing to plan for.
Trade C, closed by the clock
Trade C, the ES breakout bought at 6,488.75 on August 13, 2025 with a 2 ATR stop at 6,356.86, a target at 6,620.64 and a 20-session time stop, never reached either level. On August 20 it fell to 6,362.75, just 5.89 points above the stop, and then spent the next three weeks grinding back. The time stop closed it at 6,592.50 on September 11, a gain of 103.75 points or 1.57 ATR, $518.75 on one MES. A trader watching that near-miss on August 20 would have been tempted to move the stop lower or take the loss early. The rule did neither, and that was the profitable choice this time, not a guaranteed one.
Related lesson: Trailing stops
Swing Trading Risk Management and Position Sizing
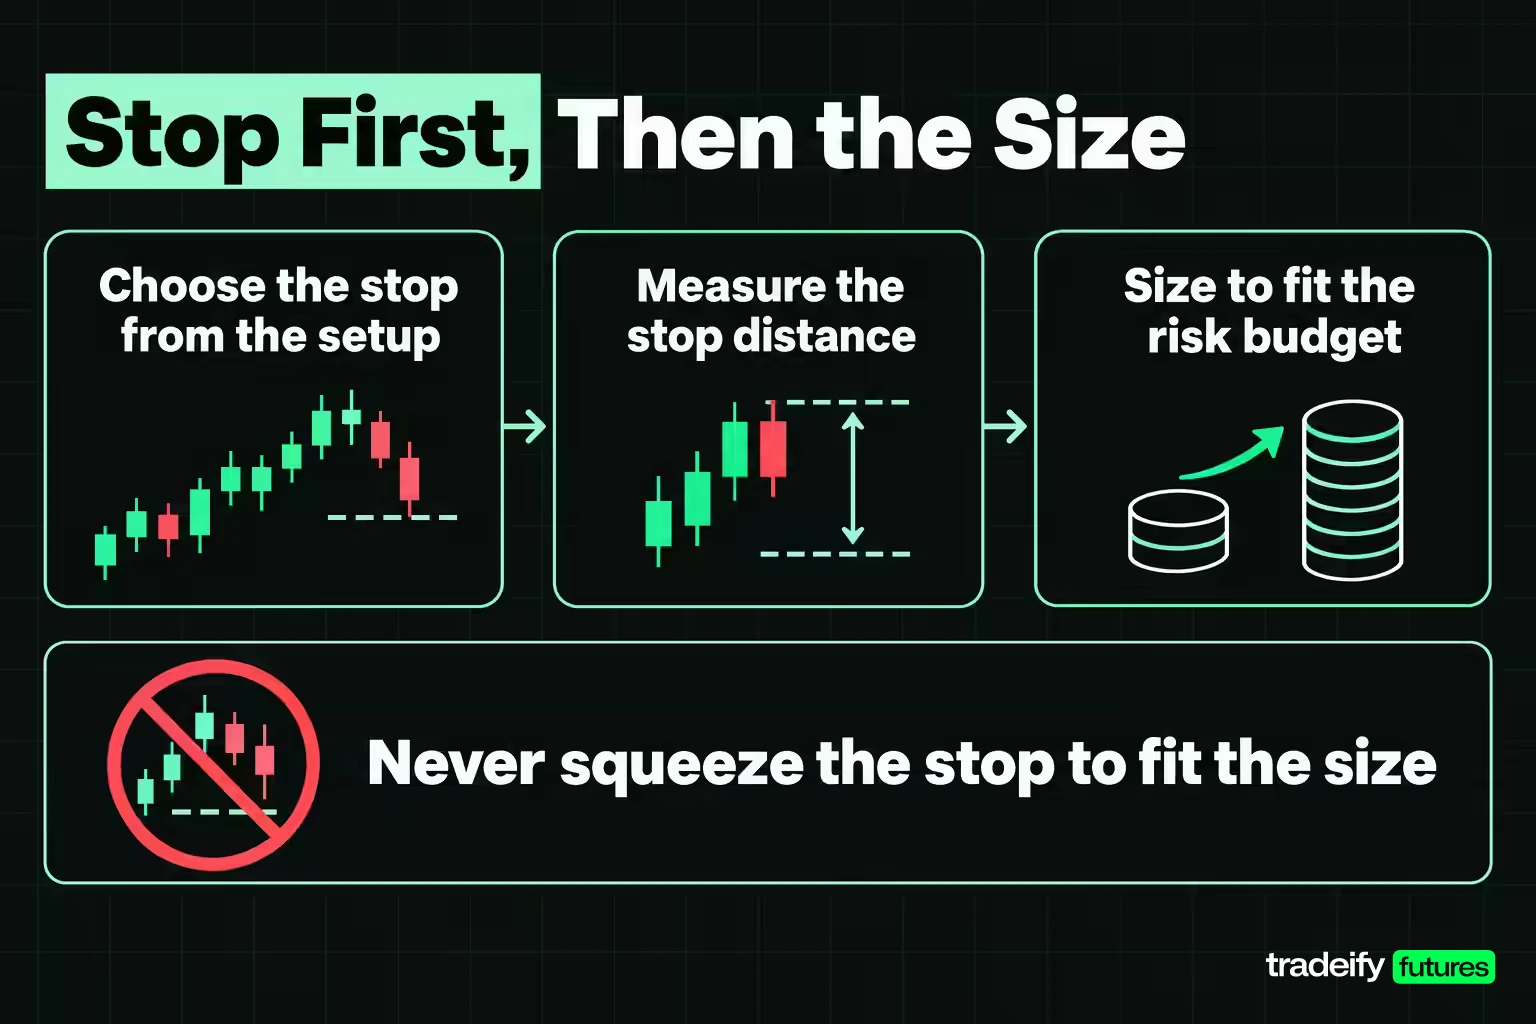
Swing trading risk management starts with the stop and works backward to the size. Choose the stop from the setup (the level that proves the idea wrong, or a multiple of ATR that clears normal noise), then calculate how many contracts or shares fit your risk budget at that distance. Picking the size first and squeezing the stop to fit is how one swing trade turns into a large loss.
The 2% rule in swing trading
The 2% rule says never risk more than 2% of account equity on one trade. CME Group's education course gives the example of a $50,000 account risking up to $1,000 per trade, and also calls the 2% threshold completely arbitrary. Many traders use 1% or less. The rule caps the loss on a single trade; it does not cap what an overnight move can do to an open position, so treat it as a ceiling.
For a stock, the math is simple. With an illustrative $25,000 account, 2% is $500. A $100 stock with an $8 stop allows 62 shares, $496 of risk, in a position worth $6,200.
Swing trading futures position size
Futures contracts carry fixed point values, so the stop converts straight into dollars. ES is $50 per index point and MES is $5. NQ is $20 per point and MNQ is $2. Over the last 12 months, median daily ATR was 89.71 points on ES and 499.36 points on NQ. A 2 ATR swing stop at those levels works out like this:
| Contract | Stop in points | Risk per contract | Account for 2% risk |
|---|---|---|---|
| ES | 179.42 | $8,971 | $448,550 |
| MES | 179.42 | $897.10 | $44,855 |
| NQ | 998.72 | $19,974.40 | $998,720 |
| MNQ | 998.72 | $1,997.44 | $99,872 |
That is the honest answer to how much money swing trading needs. It depends entirely on the stop. With a stop wide enough to survive multi-day noise, one micro S&P contract needs about $44,855 at 2% risk and about $89,710 at 1%. In the April 24, 2026 ES breakout example, the 2 ATR stop alone was $1,028.70 on one MES, more than the $1,000 a $50,000 account allows at 2%. Volatility also moves: as of November 4, 2026, ES ATR was 101.92 points, above its 12-month median, so the same stop in ATR terms was wider in dollars.
Overnight gaps and swing trading stops
A stop order cannot protect you from a market that opens past it. In this guide's measurement of roll-adjusted Yahoo Finance futures data across 1,188 sessions from December 2021 to November 2026, the median ES opening gap was 3.75 points and the 90th percentile was 17 points, small against a swing stop. The largest was 161.75 points on April 3, 2025, 1.46 times the prior ATR and $808.75 on one MES. NQ's largest, on the same day, was 738 points. Only 2 sessions per market opened more than 1 ATR from the prior close, but those are the sessions that decide whether a stop fills where you planned. Size so that a gap through the stop is a bad day, not a broken account.
Related lesson: Position sizing futures contracts
Advantages and Downsides of Swing Trading
Swing trading suits people who cannot watch a screen all day, but it trades one set of problems for another.
Advantages
- Less screen time. Decisions happen around the daily close, not every few minutes.
- Larger moves per trade. Commissions and spreads are a small share of a multi-day target.
- Room to be early. A trade does not have to work in the first hour.
- Easier to follow written rules. Fewer decisions means fewer impulsive ones.
Downsides
- Overnight and weekend exposure. News between sessions can move price past your stop.
- Wider stops and smaller size. The stop has to clear several days of noise, so the position is smaller for the same dollar risk.
- Higher margin in futures. Brokers that offer reduced day-trading margin require more to carry a position between sessions; NinjaTrader describes the overnight requirement as significantly greater.
- Few trades, slow feedback. At a handful of signals a month, a year of results is a small sample.
- Patience cost. Most days you do nothing, and sitting through a trade that comes within a few points of its stop is harder than it looks on paper.
For US stock traders, the pattern day trader rule never counted positions held overnight as day trades, and FINRA Regulatory Notice 26-10 is replacing the day-trading margin rules, including the $25,000 minimum, with new intraday margin standards that took effect June 4, 2026 and phase in through October 20, 2027. Futures were never subject to the PDT rule.
Common Swing Trading Mistakes
Most swing trading mistakes come from treating a multi-day trade like an intraday one:
- A stop inside the noise. In this guide's five-year ES and NQ breakout test, a 0.5 ATR stop was hit within 20 sessions on 128 of 155 signals.
- Choosing size before the stop. The stop sets the size, never the other way round.
- Judging a rule on one year. The best setting changed from one year to the next.
- Skipping the baseline. If a rule does no better than being long every day, the entry is not the edge.
- Moving the stop after entry. Widening a stop on a trade that is close to it turns a defined risk into an open one.
- Ignoring the account's rules. Some accounts do not allow positions to be held past the daily close at all.
Swing Trading and Overnight Rules in Funded Futures Accounts
Swing trading and funded futures accounts often do not mix. Many prop firm accounts require traders to be flat by a set time each day, so a strategy that depends on holding through the close cannot be run there. Before testing a swing rule for a specific account, check whether it allows overnight and weekend holds at all.
On our accounts, every position has to be closed by 4:45 PM ET (12:59 PM ET on holiday early closes), and no account type, Live included, allows overnight, weekend or swing holds. Our trading day runs from 6:00 PM to 5:00 PM ET, so a position opened at 8:00 PM and closed at 2:00 PM the next afternoon stays inside one session and is allowed. Anything still open at the cutoff is closed for you without failing the account, though the fill can slip. The testing method in this guide carries over to a single session; a multi-day swing position does not.
Swing Trading FAQ
Is swing trading still profitable?
It can be, for traders whose rules hold up over a large sample after costs, but no style is profitable by default. In this guide's five-year test, a plain breakout rule did no better than buying any day until the stop and target were set sensibly, and its best setting changed from year to year.
What is the downside of swing trading?
The main downside is exposure to price moves while you are away from the market, including overnight and weekend gaps that can open beyond a stop. Swing trading also needs wider stops, which means smaller positions, and in futures it usually needs more margin than day trading.
What is the 2% rule in swing trading?
The 2% rule caps the risk on any one trade at 2% of account equity, so a $50,000 account risks at most $1,000. You set the stop first, then size the position so a stop-out costs no more than that amount. Many traders use 1% instead.
How much money is needed for swing trading?
The amount depends on your stop and your risk percentage, not on a fixed minimum. In stocks, a small account can swing trade a few shares. In futures, one micro E-mini S&P contract with a 2 ATR stop needed about $44,855 at 2% risk over the last 12 months.
Can you swing trade futures?
Yes, in a standard futures brokerage account, as long as you hold the full overnight margin your broker requires. Many prop firm accounts do not allow it, because they require every position to be closed before the daily cutoff.
This guide is educational, not investment advice, and its study figures are an illustrative measurement on historical data with no costs or slippage, not trading results. Futures and other leveraged products can lose more than expected, including more than the stop when a market gaps, and funded and evaluation accounts are simulated.


