



TL;DR: Cumulative delta is a running total of aggressive buy volume minus aggressive sell volume, so it shows who kept paying the spread. Most charts estimate it from candles, and the rule and bar width you pick can flip its sign. Across 589 hourly ES and NQ sessions, delta and price disagreed about one day in five. Divergence beat its base rate on short pullbacks, but it was no reliable reversal call.
Cumulative delta tracks one thing: which side of the market was willing to cross the spread, trade after trade, and how that imbalance added up over a session. It is one of the most popular order flow lines on futures charts, and one of the easiest to over-read.
The usual moment goes like this. Price pushes to a new high, the delta line does not follow, and the chart seems to be telling you to fade it. Whether that read is worth acting on depends on how the line was built and how often that setup has actually paid. Those are the two questions this guide answers.
It builds cumulative delta from the ground up, rebuilds a real E-mini S&P 500 session bar by bar, shows how the same session gives very different readings at different settings, and then tests the two claims traders make about the line most often: that it confirms trends and that its divergences call reversals. Every study states its data and method, so you can rerun it on the market you trade.
What Cumulative Delta Measures
Cumulative delta starts with a simple split. Every trade has a buyer and a seller, but only one of them arrived as the aggressor, the side that crossed the spread with a market order or a marketable limit order. A buyer who lifts the offer adds buying pressure. A seller who hits the bid adds selling pressure.
Delta is the difference for one bar: volume traded at the offer minus volume traded at the bid. Cumulative delta adds each bar's delta to a running total, so the line carries memory across the session, the week or whatever period you anchor it to.
That makes it different from two tools it gets confused with:
- Volume counts every contract that traded and says nothing about which side initiated it.
- Bar delta (often just called delta or volume delta) resets every bar, so it shows the imbalance inside one candle but not the build-up across many.
- Cumulative delta keeps the running sum, so a long stretch of small imbalances can show up as a clear trend in the line even when no single bar looks dramatic.
Cumulative delta is narrower than most chart commentary suggests. It does not measure who is right, who is larger or what happens next. Aggressive does not mean informed: a stop-loss being triggered is aggressive flow too. Passive limit orders resting on the book are not in it at all; they only show up when an aggressor trades against them. It is a record of who was impatient enough to pay the spread.
Cumulative delta anchors and data sources
Two settings decide what cumulative delta number you are looking at before the market does anything. The first is the anchor. TradingView's Cumulative Volume Delta resets its running total at the start of each anchor period, and NinjaTrader's Order Flow Cumulative Delta accumulates over either a Session or a single Bar. The second is the data. On CME Globex, the exchange's own trade message carries an AggressorSide field (tag 5797) that marks a match as buyer-initiated, seller-initiated or no aggressor, but most chart histories never pass that field through. Two traders looking at "the cumulative delta" on the same contract can be looking at different numbers for either reason.
Related lesson: Order flow analysis
How to Calculate Cumulative Delta
The cumulative delta formula has two steps.
- For each bar, delta = ask volume (trades at the offer or higher) minus bid volume (trades at the bid or lower).
- Cumulative delta at bar n = cumulative delta at bar n minus 1 + delta of bar n, starting from zero at the anchor.
Here is an illustrative five-print sequence on an ES-style contract, with the bid at 7,000.00 and the offer at 7,000.25 to start. The prices are round, illustrative numbers, not market data.
| Price | Size | Side that crossed | Delta | Running total | |
|---|---|---|---|---|---|
| 1 | 7,000.25 | 12 | Buyer lifted the offer | +12 | +12 |
| 2 | 7,000.00 | 5 | Seller hit the bid | -5 | +7 |
| 3 | 7,000.00 | 20 | Seller hit the bid | -20 | -13 |
| 4 | 7,000.25 | 8 | Buyer lifted the offer | +8 | -5 |
| 5 | 7,000.50 | 30 | Buyer lifted the new offer | +30 | +25 |
The bar traded 75 contracts. Ask volume was 50, bid volume was 25, so bar delta is +25. Notice the path: the running total dipped to -13 before finishing at +25. Platforms that draw cumulative delta as candles keep that path. TradingView's candle opens at the previous candle's close (or at 0 on the first bar of a period), closes at the new running total, and its high and low are the highest and lowest cumulative values reached inside the bar. Here that is an open of 0, a high of +25, a low of -13 and a close of +25.
A trade that prints between the bid and the offer needs a tiebreak. Sierra Chart's documentation, for example, assigns those trades by whether the trade was an uptick or a downtick. Different tiebreaks are one more reason two platforms can disagree on the same tape.
Cumulative Delta Data Feeds and Inference Rules
Accurate delta needs a trade-by-trade tape matched to the best bid and offer at the moment of each trade, or an exchange aggressor flag. CME's market data feed sends a Trade Summary message for each match, and that message carries the AggressorSide value. Sierra Chart builds its Cumulative Delta Bars - Volume study from ask volume (trades at the best ask or higher) and bid volume (trades at the best bid or lower), and NinjaTrader's Order Flow Cumulative Delta needs a 1-tick data series added to the chart because it runs off tick data.
How charts estimate delta without a trade tape
Plain candle histories carry open, high, low, close and volume. The side that initiated each trade is gone. When that is all a tool has, it infers delta from price, and four inference methods show up again and again:
- Tick rule. Compare each bar's close with the previous bar's close. A higher close counts the bar's whole volume as buying, a lower close as selling, and an unchanged close carries the previous sign.
- Bar direction. Compare each bar's close with its own open. It is the crudest version, because a bar that closed up counts as all buying even if the volume inside it was mixed.
- Close location value. Weight the volume by where the close sat in the bar's range, from -1 at the low to +1 at the high, so a bar gives a partial reading instead of all or nothing.
- Intrabar classification. TradingView's built-in Cumulative Volume Delta reads a lower timeframe than the chart and classifies each intrabar as positive or negative by its close versus its open, falling back to the previous intrabar's close (and then the previous classification) when open and close match. By default it uses 1-minute intrabars on minute and hour charts, 1-second intrabars on seconds charts and 5-minute intrabars on daily charts.
All four are transformations of price. That matters for the most popular use of the line: when delta is derived from the candles, a "divergence" between price and delta is partly a relationship between price and a function of price. It can still be useful, as the tests later in this guide show, but it is a weaker claim than a divergence measured on true aggressor volume.
Related lesson: Time and sales
Cumulative Delta on One ES Session, Bar by Bar
To see what the line does on a real day, here is the E-mini S&P 500 front contract on September 15, 2026, regular session 9:30 AM to 4:00 PM ET. The data are 5-minute bars from the Yahoo Finance chart service. Delta uses the tick rule at 5-minute resolution, with the session's first bar compared to the 9:25 AM bar's close, then summed into thirteen 30-minute periods. The session traded 1,288,447 contracts.
| Period (ET) | Open | High | Low | Close | Volume | Delta | Cumulative |
|---|---|---|---|---|---|---|---|
| 9:30 AM | 7684.25 | 7687.00 | 7670.25 | 7678.25 | 167,452 | -13,788 | -13,788 |
| 10:00 AM | 7678.50 | 7678.50 | 7654.00 | 7657.00 | 151,485 | -97,563 | -111,351 |
| 10:30 AM | 7657.25 | 7658.75 | 7643.50 | 7646.25 | 151,434 | -110,920 | -222,271 |
| 11:00 AM | 7646.50 | 7657.25 | 7646.25 | 7656.75 | 111,811 | +75,251 | -147,020 |
| 11:30 AM | 7657.00 | 7659.75 | 7651.00 | 7653.00 | 108,760 | +11,378 | -135,642 |
| 12:00 PM | 7653.00 | 7661.00 | 7648.00 | 7658.00 | 71,293 | +21,349 | -114,293 |
| 12:30 PM | 7657.75 | 7662.75 | 7655.00 | 7659.25 | 68,811 | +3,355 | -110,938 |
| 1:00 PM | 7659.00 | 7660.25 | 7648.00 | 7650.75 | 67,646 | -21,314 | -132,252 |
| 1:30 PM | 7650.75 | 7656.25 | 7650.25 | 7655.25 | 58,122 | +37,564 | -94,688 |
| 2:00 PM | 7655.25 | 7662.00 | 7653.50 | 7659.25 | 60,365 | +17,683 | -77,005 |
| 2:30 PM | 7659.25 | 7659.25 | 7649.50 | 7657.00 | 59,942 | -7,808 | -84,813 |
| 3:00 PM | 7657.25 | 7658.75 | 7651.75 | 7652.50 | 50,111 | -33,071 | -117,884 |
| 3:30 PM | 7652.50 | 7657.75 | 7648.00 | 7656.75 | 161,215 | +117,319 | -565 |
The arithmetic reconciles. The thirteen period volumes sum to 1,288,447 and the thirteen deltas sum to -565, which is the session's net delta, about -0.04% of the day's volume.
Reading the ES session's cumulative delta sequence
The endpoint says almost nothing. The sequence says a lot.
Price fell from 7684.25 to the session low of 7643.50 (printed in the 10:50 AM bar) while cumulative delta ran down to -222,271 by 10:55 AM, its lowest reading. Flow and price agreed: sellers were paying the spread and price was giving way.
From 11:00 AM the market bought back the spread for four straight periods and price recovered to 7659.25. That is the textbook bullish divergence: price well off its low while cumulative delta stayed deeply negative. A trader watching the line could reasonably read "sellers are done."
It did not resolve that way. Cumulative delta never got back to zero during the day. It climbed to -77,005 by the end of the 2:00 PM period, slipped again, and price closed at 7656.75, 27.50 points below its open. Then the final half hour printed +117,319 of tick-rule delta on 161,215 contracts while price moved only 4.25 points, which pulled the session total to -565.
Two lessons sit in that one day. A divergence can be accurate about who is paying the spread and still be useless as a direction call. Reading the flow correctly and having a trade are two different things, and buying that never outweighs the selling already done does not turn the session. And a heavy final-half-hour reading on large closing volume can rewrite the session total without saying much about the session itself.
How Bar Width and Settings Change the Delta Reading
Take the same September 15 session and change only the bar width the delta is built on. Same instrument, same day, same data, three rules. Each share is the session delta divided by session volume.
| Bar width | Bars | Tick rule delta | Tick rule share | Bar direction share | Close location share |
|---|---|---|---|---|---|
| 5 minutes | 78 | -565 | -0.04% | -3.85% | +0.79% |
| 10 minutes | 39 | -287,897 | -22.34% | -22.34% | -4.18% |
| 15 minutes | 26 | -253,529 | -19.68% | -19.68% | +2.09% |
| 30 minutes | 13 | -225,213 | -17.48% | -17.48% | +0.99% |
| 60 minutes | 7 | -368,937 | -28.63% | -28.63% | +7.25% |
Price fell 27.50 points. At 5 minutes the tick rule calls the day flat. At 10 minutes it calls heavy selling, more than a fifth of all volume. Close location value calls it net buying at four of the five widths. Nothing about the market changed between those rows. Only the ruler did.
The cause is mechanical. The tick rule and bar direction assign each bar's entire volume to one side, so wider bars pool more internal back-and-forth under a single sign, and one big bar can swing the total. On the E-mini Nasdaq-100 the same day, price fell 168.75 points and the tick rule read -15.45% of volume at 5 minutes, -1.16% at 30 minutes and -63.12% at 60 minutes, while close location value read +1.29% at 5 minutes.
How often delta inference rules agree on sign
One day could be a fluke, so for this guide the three delta inference rules (tick rule, bar direction, close location value) were compared on Yahoo Finance 5-minute data for every complete regular session from August 27 to November 4, 2026, on 5-minute bars, 48 sessions each for ES and NQ.
| Comparison | ES sessions agreeing on sign | NQ sessions agreeing on sign |
|---|---|---|
| All three rules | 31 of 48 | 35 of 48 |
| Tick rule and bar direction | 45 of 48 | 46 of 48 |
| Tick rule and close location value | 32 of 48 | 36 of 48 |
The tick rule and bar direction are near-duplicates. Close location value often disagrees with both, on roughly one ES session in three. If your platform uses one rule and the chart you are comparing against uses another, a meaningful share of your readings are not comparable.
Choosing cumulative delta settings
Settings are a decision, not a default to accept. Four of them change the number on screen:
- Anchor or reset period. Session resets suit day traders who want each day's flow on its own. Weekly or longer anchors show bigger swings in positioning but mix several sessions' flow together.
- Data source and intrabar timeframe. A true bid/ask tape beats any inference. If you must infer, a finer intrabar timeframe is closer to the trades; TradingView's documentation notes that lower intrabar timeframes give more precision but cover less chart history.
- Size filter. NinjaTrader's cumulative delta has a size filter that excludes trades below a chosen size. Filtering changes the reading from "all aggressive flow" to "aggressive flow from larger orders," which is a different question.
- Chart bar width. On inferred delta, the width is part of the measurement. Pick one, write it down and keep it when you compare days.
The practical rule: before you read the line, write down the anchor, data source, rule and bar width. If two charts disagree about a session, the settings are the first suspect, not the market.
Cumulative Delta for Trend Confirmation Across 589 Sessions
The most common use of cumulative delta is confirmation: a rising line under a rising price says buyers are paying up to push it, and a falling line under a falling price says the same for sellers. The useful question is how often the two actually agree.
To get past single days, the tick rule was applied to hourly bars from 9:00 AM to 3:59 PM ET (seven bars per session) on the E-mini S&P 500 and E-mini Nasdaq-100 front contracts, for 589 sessions each from April 24, 2024 to September 15, 2026, using Yahoo Finance chart data. The final cumulative value is each session's delta, compared with the session's price change.
| Instrument | Price up, delta positive | Price down, delta negative | Price down, delta positive | Price up, delta negative |
|---|---|---|---|---|
| ES | 256 | 224 | 53 | 56 |
| NQ | 256 | 224 | 47 | 62 |
Session delta and price change agreed on 480 of 589 sessions for each instrument, or 81.49%, and disagreed on 109, or 18.51%. Roughly one session in five ends with the flow line and the price line telling different stories.
This guide reran that study on 2026-11-04 using the hourly Yahoo Finance history still available, June 14, 2024 to September 15, 2026. Agreement came out at 445 of 550 ES sessions (80.91%) and 442 of 551 NQ sessions (80.22%), so the one-in-five disagreement rate held.
Typical cumulative delta size in ES and NQ sessions
How big is a normal cumulative delta reading? This guide's own measurements on Yahoo Finance ES and NQ futures data give a reference, and the answer depends on bar width.
On hourly bars, session delta is usually large relative to volume. The median absolute session delta was 30.68% of volume on ES and 30.85% on NQ in the 589-session hourly sample (April 24, 2024 to September 15, 2026), and 29.66% and 31.88% in the 550-session rerun. On 5-minute bars across 48 sessions from August 27 to November 4, 2026, the medians were only 8.56% and 8.59%. A "big" cumulative delta reading only means something against the same bar width, which ties straight back to settings.
ES and NQ flow are related, not identical. In the same 589-session hourly sample their session delta signs agreed on 457 of 589 sessions (77.59%), with a correlation of 0.736 between their normalized session deltas. In the rerun, signs agreed on 420 of 550 sessions (76.36%). One index's reading is not a stand-in for the other's.
Using cumulative delta to confirm a trend
Agreement about 80% of the time in these Yahoo Finance hourly studies makes cumulative delta a reasonable confirmation tool and a poor standalone signal. A practical way to use it:
- Confirmed trend. Price makes higher highs and higher lows, and cumulative delta makes higher highs on the pushes. Pullbacks come on flat or shallow delta. This is the 80% case, and the line adds confidence rather than new information.
- Unconfirmed trend. Price grinds higher while the line goes flat or slopes down. That does not mean "short it." It means the move is running on less aggressive buying, so a trader may tighten expectations, take partial profits sooner or skip adding size. The temptation is to turn a caution flag into an entry; those are different decisions.
- What would change the read. A clean break of the trend's last higher low, with delta turning down through its own recent low, is a structure change, not a flow wobble.
Slope matters more than level. A cumulative delta line sitting at -100,000 but rising steadily says buyers have been the aggressors recently, whatever happened in the morning.
Cumulative Delta Divergence Tested Against a Base Rate
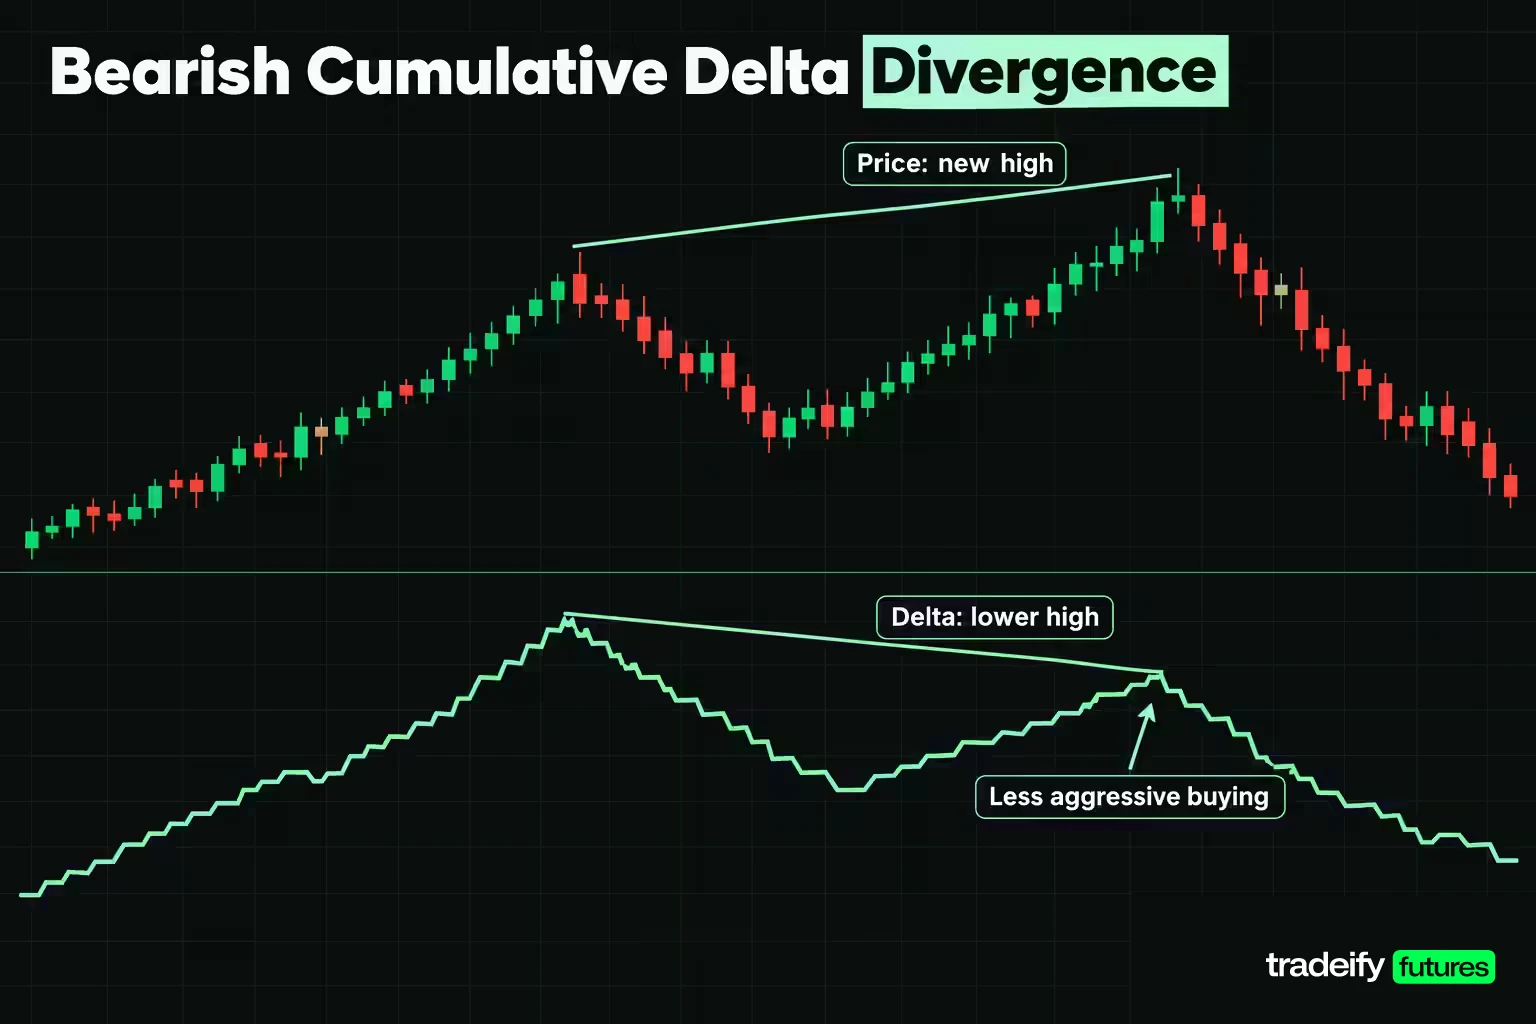
Divergence is the reason most traders load a cumulative delta line. The three patterns traders talk about:
- Bearish divergence. Price makes a new high but cumulative delta does not exceed its reading at the prior high. The push is happening on less aggressive buying.
- Bullish divergence. Price makes a new low but cumulative delta stays above its reading at the prior low. Selling pressure is fading into the low.
- Hidden divergence. In a trend, price makes a higher low (or lower high) while delta makes a lower low (or higher high). It is read as a continuation sign: the pullback drew aggressive counter-trend flow that failed to move price.
The claim behind the first two is that the move is running out of participation and likely to reverse. That claim needs a base rate, because new session highs and lows pull back often anyway.
How the divergence test was run
The test used 5-minute bars, 9:30 AM to 3:55 PM ET, tick-rule cumulative delta reset each session, on the 48 complete ES and NQ sessions from August 27 to November 4, 2026. Every bar that set a new session high or low was an event. It counted as a divergence when cumulative delta at that bar was weaker than its reading at the previous session extreme on the same side.
Each event was scored two ways. Pullback: did price move back by a threshold within the next 30 minutes (six bars)? Close failure: did the session close at least that threshold away from the extreme? The threshold was a quarter of the median initial balance (the range of the first 60 minutes), which scales it to how much each market moves: 7.41 points on ES (median initial balance 29.62) and 51.12 points on NQ (median 204.50). Every new extreme, divergence or not, was scored the same way to give the base rate.
| Instrument | Setup | Divergence events | Pullback rate | All extremes (base) | Base pullback rate |
|---|---|---|---|---|---|
| ES | Bearish divergence | 109 | 71.6% | 355 | 54.6% |
| ES | Bullish divergence | 94 | 73.4% | 299 | 66.6% |
| NQ | Bearish divergence | 104 | 55.8% | 374 | 47.6% |
| NQ | Bullish divergence | 86 | 81.4% | 244 | 66.8% |
Divergence carried information in this guide's sample. A new ES high without flow confirmation pulled back at least 7.41 points within 30 minutes 71.6% of the time, against 54.6% for new highs in general. All four rows beat their base rate. The edge is real here and it is not huge, and events overlap because a strong trend prints several new extremes in a row.
Does cumulative delta divergence call reversals at the close
Short pullbacks are not reversals. The reversal question is whether a new session extreme made with cumulative delta divergence fails by the close, meaning the session closes at least a quarter of the median initial balance (the first hour's range) away from it. This guide's tests on Yahoo Finance 5-minute ES and NQ futures data scored that for every divergence and for every new extreme as the base rate.
- In this guide's 48-session test (August 27 to November 4, 2026), ES bearish divergences ended with the close at least 7.41 points below the high 51.4% of the time, against 45.9% for all new highs. NQ bearish divergences did 39.4% against a 39.6% base, no better than chance. Bullish divergences did better: 57.4% against 48.8% on ES and 57.0% against 46.7% on NQ.
- An earlier run of the same test by this guide's authors, on 49 sessions of Yahoo Finance 5-minute data from July 8 to September 15, 2026 (a quarter of the median initial balance there was 6.00 ES points) found ES bearish divergences pulled back 78.2% of the time against a 62.6% base, but closed below the high only 47.3% of the time against a 55.4% base, worse than ordinary new highs.
Two windows that overlap by about three weeks gave opposite answers on the close-failure question and the same answer on the short pullback. That is the honest summary. Divergence has looked like a pullback signal in both samples. It has not been a dependable "the high is in" signal, which is the trade most people take it for.
The threshold also shapes the result. On the ES bearish case in this guide's 48-session test, a threshold of an eighth of the initial balance (3.70 points) gave 91.7% against 81.1%, and half of it (14.81 points) gave 43.1% against 30.4%. Bigger targets are hit less often by everything.
One caution stands over all of it. These samples are 48 and 49 sessions on inferred delta from candle data, one contract each. The direction of the result is worth having. The decimals are not.
Absorption and Reversals in the Delta Line
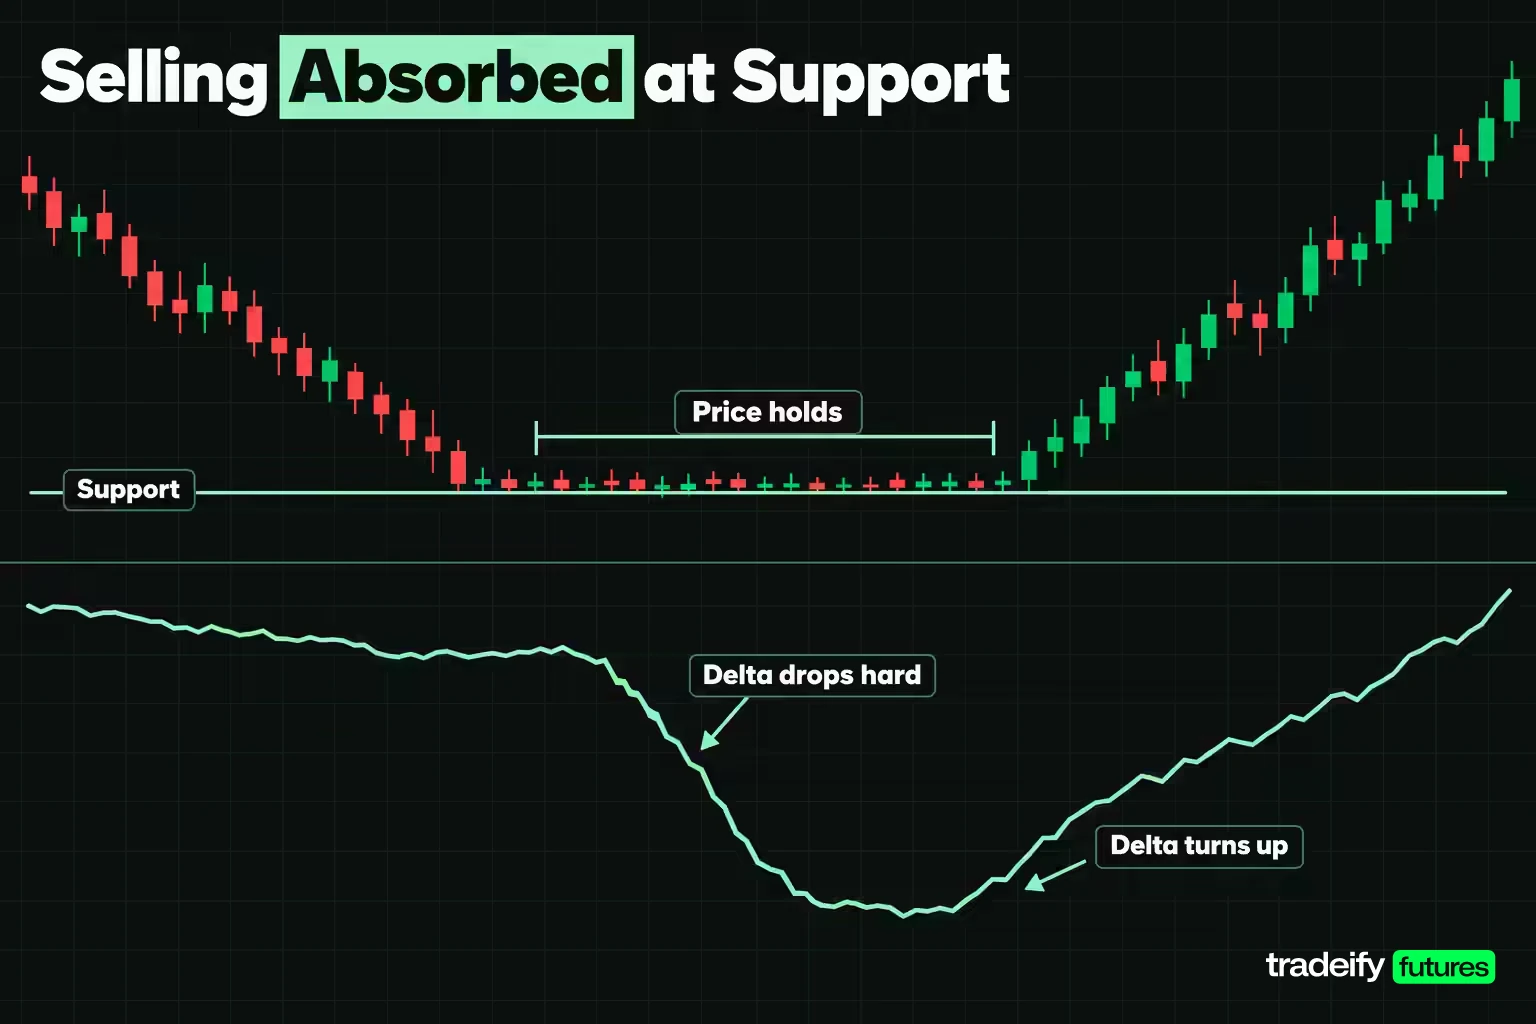
Absorption is the cumulative delta pattern traders mean when they talk about "someone big defending a level." Aggressive flow pours in on one side, the line moves sharply, and price barely moves because passive limit orders on the other side soak it up.
How absorption tends to look:
- Selling absorbed at support. Cumulative delta drops hard at or near a known level while price holds or makes only a marginal new low. Sellers are paying the spread and getting nowhere.
- Buying absorbed at resistance. The line climbs sharply while price stalls under the level.
- Exhaustion, the cousin. The aggressive flow simply dries up near the extreme. The line flattens as price pokes to a new high or low, with less and less pushing it.
The September 15 ES session's final half hour shows why absorption needs context. Tick-rule delta for that period was +117,319 on 161,215 contracts while price rose 4.25 points. On a chart that could look like buying absorbed by sellers. It was also the closing auction window with the day's heaviest volume, which is when large balancing flow lands. A heavy delta reading with little price movement is an observation; calling it absorption needs a location and a follow-up.
Confirming an absorption reversal
Treat absorption as a reason to watch, not a reason to enter. Spotting it early feels like an edge, and that feeling is exactly what pulls traders in before the level has done anything:
- Location first. Absorption matters at a level you named before the session, such as the prior day's high or low, the overnight range or a volume profile node. In the middle of nowhere it is just a busy few minutes.
- Then the failure. The reversal case needs price to stop making progress in the absorbed direction, then reclaim the level.
- Then the flip. The cleaner confirmation is cumulative delta turning with price, the side that was being absorbed stepping back and the other side starting to pay the spread.
- Invalidation. If price breaks through the level with the same heavy flow, the passive side gave way. The absorption read is wrong, and the move may extend.
Related lesson: Support and resistance
Cumulative Delta Around Breakouts and Breakdowns
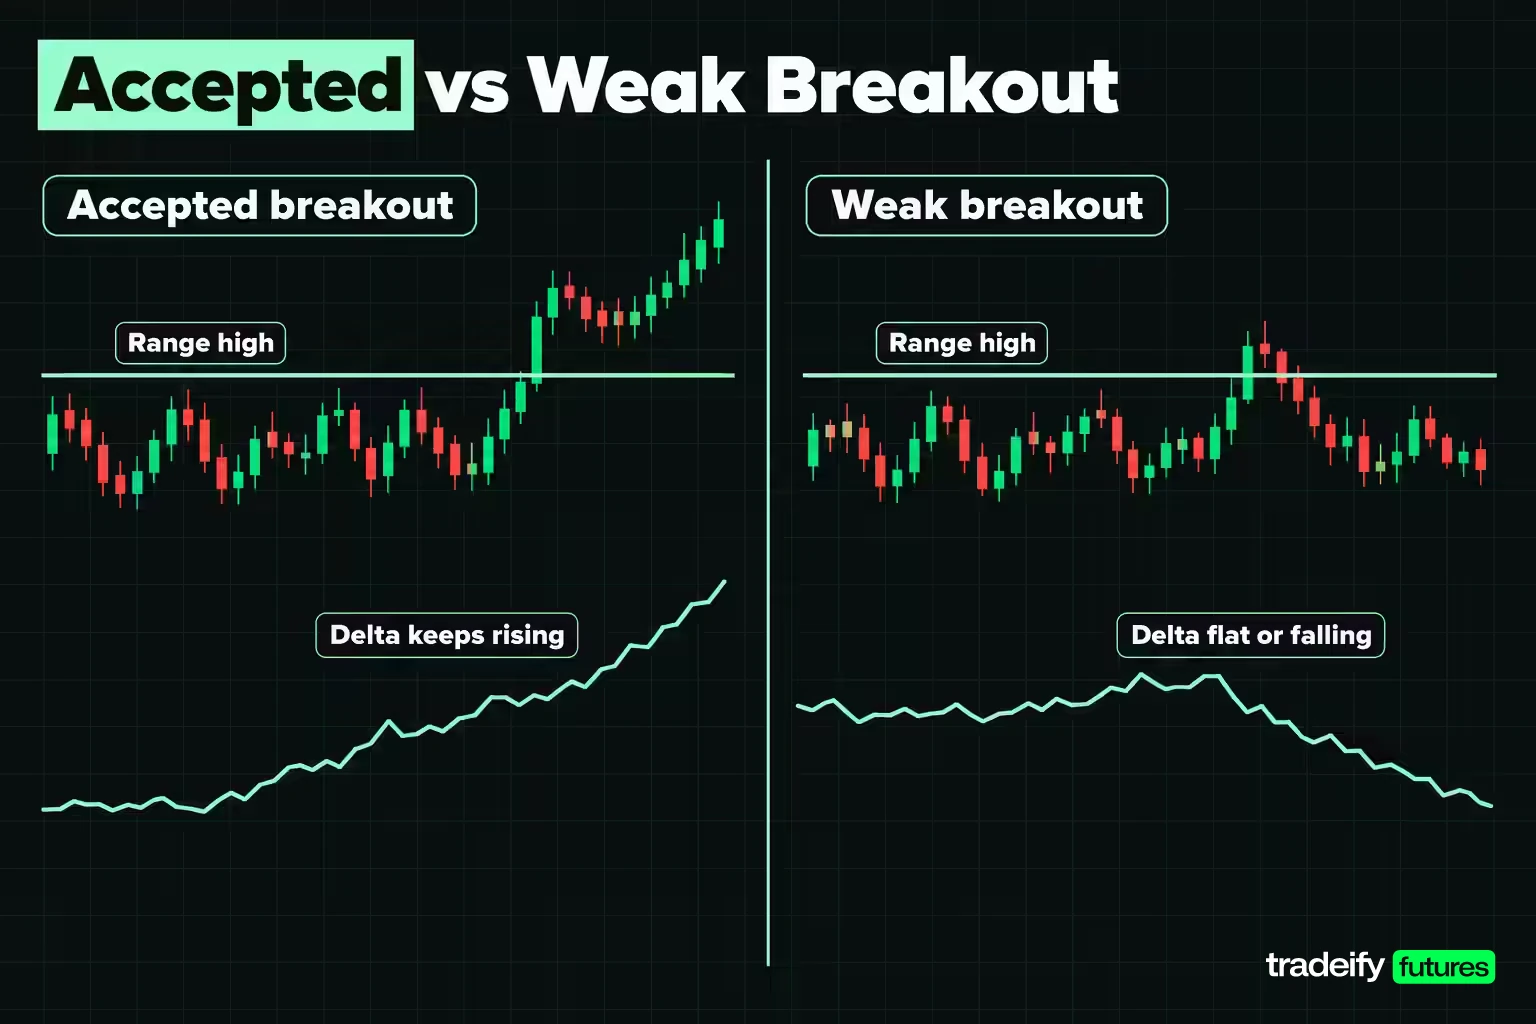
A breakout is a test of whether one side will keep paying higher (or lower) prices once price leaves a range. Cumulative delta is useful here because it shows whether the break is being driven or merely drifting.
What strong and weak breaks tend to look like on the line:
- Accepted breakout. Cumulative delta rises into and through the range high, keeps rising after the break, and the first pullback toward the old high comes on shallow negative delta. Aggressive buyers stayed active after price left the range.
- Weak breakout. Price pops over the range high while the line is flat or falling. The move may be stop orders being run rather than new buyers arriving, and it often slides back into the range.
- Breakdown. The same logic in reverse: delta falling through the range low and staying weak on the first retest supports the break.
The trap is reading the line on the breakout bar alone. A single burst of aggressive buying at the break is common in both real and failed breakouts. The more useful window is the next several bars: does flow keep coming in the breakout direction, and does price hold outside the range when it pulls back?
What would change the conclusion: if price returns inside the range and cumulative delta turns against the break, treat it as failed, whatever the breakout bar looked like.
Related lesson: Breakout trading
Reading Delta in Trending, Ranging and Volatile Markets
The same cumulative delta reading means different things in different conditions.
Trending markets. Delta and price tend to move together. In this guide's 589-session hourly study of ES and NQ futures (Yahoo Finance data), session delta and price agreed on about 80% of days, and trend days make up much of that. Divergences against a strong trend appear often and resolve as shallow pullbacks more often than reversals, so fading every one is an expensive habit.
Ranging markets. The line chops around zero and swings with each edge test. This is where absorption at the range edges is most readable, because there are clear levels where one side keeps paying the spread without getting through. A cumulative delta trend inside a range can also hint at which edge eventually breaks, but only as a lean.
Volatile and news-driven markets. Around scheduled releases such as CPI, volume and delta spike together and the line can move more in two minutes than in the previous two hours. Those readings are dominated by one burst. A trader may treat the post-release reading as a new starting point rather than a continuation of the morning's flow.
Cumulative delta in crypto and spot forex
Crypto spot and perpetual futures. Crypto venues publish trade-by-trade tapes, so delta can be built from real prints rather than inferred, though conventions vary. Coinbase's public trades feed, for example, labels each trade with the maker order's side, which is the opposite of the aggressor, so a tool that reads that field the wrong way round flips the sign. Spot and perpetual markets on the same coin can also show different cumulative delta at the same moment, because they draw different participants. Each line describes its own venue; neither is "the" flow for the coin.
Spot forex. Trading is spread across many dealers and venues, so there is no single exchange tape to build a true delta from. Charts that show delta on spot pairs are estimating it, usually from price changes. CME currency futures, which trade on one exchange, are where a real aggressor-based delta exists for FX.
Cumulative Delta Trading Strategies With Defined Risk
Cumulative delta works best inside a plan where price structure defines the trade and flow decides whether to take it. Three common structures, each with a trigger, a stop and an invalidation:
Pullback continuation with delta confirmation
- Context. A trend confirmed by both price and cumulative delta.
- Trigger. Price pulls back to a level (prior breakout point, VWAP or a higher low), cumulative delta dips only shallowly on the pullback, then turns back in the trend direction.
- Stop. Beyond the pullback low (or high), where the structure would be broken.
- Invalidation. Delta falls through its own prior low during the pullback. The pullback is now drawing real counter-trend aggression.
Failed-extreme fade toward a pullback target
- Context. A new session extreme at a known level, with bearish or bullish divergence.
- Trigger. Price fails to extend and cumulative delta starts turning against the extreme.
- Target. The divergence tests support a pullback, not a full reversal, so a target sized to the market's own range (such as a quarter of the median initial balance, about 7.41 ES points in the 48-session test) fits the evidence better than "the other side of the range."
- Stop. Beyond the extreme. A new extreme with delta confirming kills the trade.
Breakout acceptance with cumulative delta
- Context. A defined range with a clear high or low, watched with session cumulative delta.
- Trigger. Price closes outside the range, cumulative delta keeps building in the breakout direction, and the first retest of the range edge holds on weak counter-flow.
- Stop. Back inside the range past the retest low (or high).
- Invalidation. Price re-enters the range and delta turns against the break.
Risk rules for delta-based trades
Delta is a reading of what already happened, so the risk plan has to assume the next trade can lose even when the read was right.
- Size from the stop, not the signal. Decide the dollar risk per trade first, then derive contracts from the distance to the structural stop. A strong-looking delta reading is not a reason to size up.
- Put the stop where the idea is wrong. That is a price level, not a delta level. Cumulative delta can stay weak for an hour while price grinds against you.
- Cap the number of fades. Divergence appears repeatedly in a strong trend. Limit fade attempts per session, because the base-rate tests show plenty of extremes keep extending. The third fade of the day is usually about being right, not about the setup.
- Keep a journal by setting. Record the bar width, rule and anchor next to each trade, so you can tell whether a losing streak came from the market or from comparing readings built differently.
Related lesson: Position sizing
Combining Delta With Price Structure and Other Tools
Cumulative delta is a participation reading. It pairs best with tools that supply location and context, not with more oscillators.
- Price structure. Levels you can name in advance, swing highs and lows, range edges, give the delta reading a place to matter.
- VWAP. Price above VWAP with rising cumulative delta is agreement; price above VWAP with falling delta says the move is drifting on less aggressive buying.
- Volume profile. High-volume nodes are where absorption is most likely; low-volume areas are where a breakout with strong delta tends to travel quickly.
- Footprint charts. A footprint shows where inside the bar the aggressive volume traded, which explains a delta spike that the line alone can only report.
- Time and sales. The raw tape shows whether a delta burst was one large order or many small ones.
Stacking momentum oscillators (RSI, MACD, stochastics) on top of an inferred delta line adds little, because all of them are built from the same price series. If delta is inferred from candles, a second price-derived signal is mostly the same information twice.
Related lesson: Volume profile
Cumulative Delta Platforms and Software
How a platform computes cumulative delta matters as much as how it draws it.
| Platform | Cumulative delta tool | How delta is computed | Reset options |
|---|---|---|---|
| TradingView | Built-in Cumulative Volume Delta | Estimated from lower-timeframe intrabars classified by close versus open | Anchor period, resets to 0 each period |
| NinjaTrader 8 | Order Flow Cumulative Delta | Bid/ask volume or up/down ticks from tick data, with a size filter | Session or Bar |
| Sierra Chart | Cumulative Delta Bars - Volume | Ask volume minus bid volume, uptick/downtick tiebreak for in-between trades | Optional reset at the start of the trading day |
| Quantower | Cumulative Delta data type in volume analysis tools | Running sum of buy minus sell volume | Set period of time or number of bars |
Which cumulative delta indicator is best on TradingView? The built-in Cumulative Volume Delta is a solid default because its method and settings are documented, including the anchor period and the intrabar timeframe. It is still an estimate built from intrabar candles, so treat it as inferred delta.
What does cumulative delta do in NinjaTrader? It accumulates volume filled at the bid and at the ask (or on up and down ticks) and compares them to show buy and sell pressure, drawn as delta candles with open, high, low and close values. Session mode carries the total across the session; Bar mode restarts every bar.
Cumulative delta in automated trading systems
Cumulative delta can feed an automated strategy, but code removes the judgment that keeps the line honest on a chart. Keep it short and strict:
- Use delta as a filter on a price-based entry (for example "only take the breakout if session delta is rising over the last N bars"), not as the entry trigger itself.
- Fix the data source, rule, bar width and reset in code, and backtest on the same data the live system will see. A backtest on inferred delta from candles will not match a live system reading a true bid/ask tape.
- Test against a base rate. If the delta filter does not improve the result over the same entries without it, it is decoration.
Level 1 data and cumulative delta tools
Trade-side cumulative delta needs the trade tape plus the best bid and offer at each trade, which is Level 1 data. Level 2 depth adds the resting orders behind the best prices; it feeds heatmaps and order book tools, not the delta line itself.
On our accounts, the supported platforms with order flow tools are NinjaTrader and TradingView through a Tradovate connection, Quantower and Sierra Chart through Rithmic (Sierra Chart needs its own paid subscription), and Tradovate's own Time and Sales module, which prints each trade with green buys and red sells. Accounts include Level 1 CME data, which carries the trades and the best bid and offer that trade-side delta is built from; Level 2 depth is a paid Tradovate add-on and is not available on Rithmic accounts, so depth-based tools run on Level 1 only there. Bookmap, ATAS and similar tools are not on our supported platform list. Algorithmic trading is allowed only if you own the strategy exclusively and it is not high-frequency trading.
Related lesson: Footprint charts
Common Cumulative Delta Mistakes
Most cumulative delta mistakes come from treating an estimate built on settings as a fact about the market. The fix is rarely a better indicator. It is knowing what yours is doing.
| Mistake | What the measurement shows | What to do instead |
|---|---|---|
| Treating the line as a forecast | In this guide's 589-session ES and NQ study, session delta and price disagreed on 18.51% of sessions | Read it as a record of which side already paid the spread |
| Comparing charts built with different rules | In this guide's 48-session ES test, tick rule and close location value agreed on sign in only 32 of 48 sessions | Confirm the rule and data source before comparing readings |
| Changing bar width between comparisons | One ES session read -0.04%, -22.34% and -28.63% of volume at three widths | Fix the width, write it down and keep it |
| Fading every divergence as a reversal | Divergence beat its base rate on short pullbacks but not reliably on closing beyond the extreme | Use it to size a pullback target, not to call the top |
| Treating ES and NQ flow as one market | Their session delta signs agreed on 77.59% of 589 sessions | Read the instrument you actually trade |
| Reading the closing half hour like the rest of the day | One closing period added +117,319 of delta while price moved 4.25 points | Judge the session's flow before the close and treat the closing window separately |
A short routine for reading cumulative delta
- Write down the settings: anchor, data source, inference rule if any, and bar width.
- Judge the size of a reading against volume at that bar width, not against zero.
- Read the sequence and slope of the line, not only its endpoint.
- Check whether flow and price agree. Disagreement is common (about one session in five in this guide's ES and NQ studies), so it is a prompt to look closer, not an alert.
- Only act on a delta reading at a level you named before the session.
- Treat divergence as a pullback signal and size targets to the market's own range.
Related lesson: How to keep a trading journal
Cumulative Delta FAQ
Is cumulative delta a good indicator?
It is a good description of who was paying the spread and a weak forecast. In this guide's 589-session hourly study of ES and NQ futures, it agreed with session price direction 81.49% of the time on ES and NQ. Its divergences beat their base rate on short pullbacks in the tests, but not reliably on reversals.
How do you read cumulative delta?
Read the line's slope and sequence against price, at fixed settings. Rising price with rising delta is agreement, and rising price with flat or falling delta is divergence. Judge the size of a reading against volume at the same bar width.
What is the difference between delta and cumulative delta?
Delta is the aggressive buy volume minus aggressive sell volume for one bar. Cumulative delta adds each bar's delta to a running total from a reset point, usually the session open. Delta shows one bar's imbalance, while cumulative delta shows the build-up.
Why does cumulative delta differ from one chart to the next?
The data source, the inference rule, the bar width and the reset period can all differ. In this guide's 48-session test on ES futures, the tick rule and close location value disagreed on sign in 16 of 48 sessions. One ES session (September 15, 2026) read anywhere from -0.04% to -28.63% of volume as the bar width changed.
Does cumulative delta work on spot forex?
Only as an estimate. Spot forex has no single exchange tape showing which side crossed the spread, so platforms infer delta from price changes. CME currency futures trade on one exchange and carry true aggressor data.
Cumulative delta describes past trading activity and does not predict prices. The studies in this guide use inferred delta from Yahoo Finance candle data over stated windows, and their results are illustrative, not forecasts. Futures and other leveraged products can lose money quickly, sometimes more than expected. Prop firm evaluation and funded accounts are simulated trading environments. Nothing here is investment advice.


