



TL;DR: Trading chart types redraw the same trades, so pick the one that makes your next decision easiest to repeat. Line, bar and candlestick charts run on the clock, while Renko, point and figure and range bars run on price movement. On one five bar ES sequence, a Renko brick size alone moves the chart from 34 bricks to none. Use smoothed or price-based charts for context and place orders from a chart that prints real traded prices.
Every chart you open has already decided what to show you and what to throw away. Trading chart types differ in two ways: which prices from each period get plotted, and what moves the chart one step to the right. Get those two answers straight and most of the "which chart is best" debate goes away, because you can see what each one is trading off.
This guide runs one illustrative five bar sequence on the E-mini S&P 500 through six chart types, prices the settings that change what you see, and then shows how chart patterns look different depending on the chart underneath them.
What Every Chart Type Decides About Price and Time
A chart type makes two decisions before you draw a single line on it.
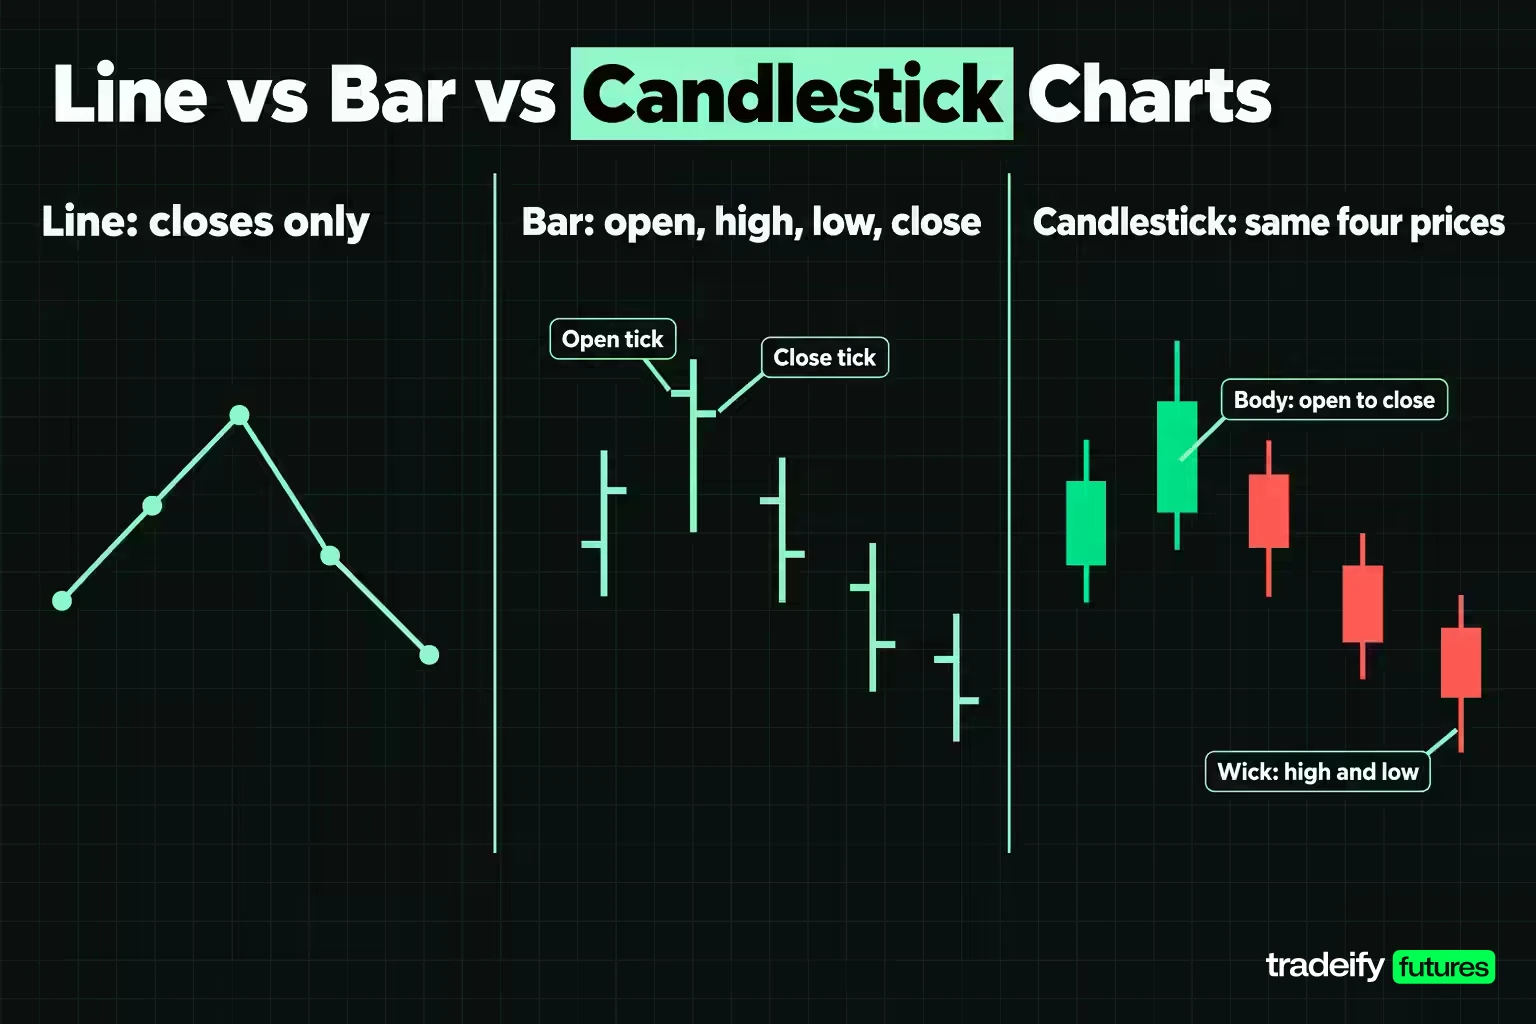
The first is which prices get drawn. A line chart keeps one price per period, usually the close. Bar and candlestick charts keep four: the open, high, low and close. Heikin Ashi recalculates those four into averages, so the numbers on screen are no longer prices anyone traded.
The second is what earns a new step on the horizontal axis. On a time-based chart, the clock decides. A 5-minute chart prints a new bar every five minutes whether the market moved twenty points or two ticks. On a trade-based tick chart, a set number of trades decides. On Renko, point and figure and range bar charts, price movement decides, so a quiet hour can print nothing at all.
That second choice is the one traders underrate. Once the clock stops driving a chart, a setting you picked starts driving it. A brick size, a box size or a range value now decides whether a move is visible, which makes that setting part of your trading plan rather than a cosmetic preference.
The Main Trading Chart Types at a Glance
Most charting platforms offer the same short list. CME Group's own technical analysis course names candlestick, bar and line charts as the most common, and most platforms add a handful of price-based options on top.
Time-based chart types:
- Line chart. One closing price per period, joined by a line.
- Bar chart, also called OHLC or HLOC. A vertical line from high to low, with a small tick on the left for the open and on the right for the close.
- Candlestick chart. The same four prices, drawn as a body between the open and close plus wicks to the high and low.
- Heikin Ashi chart. Candles built from averaged values instead of raw prices.
Activity-based and price-based chart types:
- Tick chart. A new bar after a set number of trades, such as every 512 trades.
- Range bar chart. A new bar once price has covered a set range, measured in ticks.
- Renko chart. Equal bricks that appear only after price moves a fixed distance.
- Point and figure chart. Columns of X for rising prices and O for falling prices on a fixed box size, with a column reversing only after a set number of boxes.
A practical setup usually pairs two of these: a higher timeframe line or bar chart to tell you what kind of market you are in, and a working chart to tell you where the entry and stop would go.
Related lesson: Multiple timeframe analysis
One Five Bar Sequence on Six Chart Types
Chart type comparisons stay abstract until you run the same data through each one. Here are five illustrative 5-minute bars on the E-mini S&P 500 (ES), using round prices so you can check the arithmetic by hand:
| Bar | Open | High | Low | Close |
|---|---|---|---|---|
| 1 | 4,996.00 | 5,001.25 | 4,995.50 | 5,000.75 |
| 2 | 5,000.75 | 5,005.50 | 4,999.75 | 5,004.75 |
| 3 | 5,004.75 | 5,006.25 | 5,002.00 | 5,002.75 |
| 4 | 5,002.75 | 5,003.50 | 4,998.25 | 4,999.00 |
| 5 | 4,999.00 | 5,000.25 | 4,994.75 | 4,995.50 |
From the high of 5,006.25 to the low of 4,994.75 the sequence covers 11.50 points. ES moves in 0.25 point ticks worth $12.50, with $50 per index point, so that range is 46 ticks, or $575.00 per ES contract and $57.50 per Micro E-mini S&P 500 (MES) contract at $5 per point. From the high to the final close is 10.75 points, or 43 ticks, worth $537.50 per ES contract.
The Same Five Bars Drawn Six Ways
The illustrative five bar ES sequence (closes of 5,000.75, 5,004.75, 5,002.75, 4,999.00 and 4,995.50) looks very different depending on the chart type that draws it:
| Chart type | What gets plotted | Objects drawn from these five bars | What it hides |
|---|---|---|---|
| Line | One close per bar | 5 points spanning 9.25 points of closes | The highs, lows and opens, which is 2.25 points of range the closes never touch |
| Bar (OHLC) | Open, high, low and close | 5 bars, 20 prices | Nothing, though the open and close ticks are slow to read |
| Candlestick | The same 20 prices as bodies and wicks | 5 candles, 20 prices | Nothing extra, since it is the bar chart redrawn |
| Heikin Ashi | Averaged values chained from the prior candle | 5 candles, none at a real close | Real closes, gaps and true candle direction |
| Renko, 2.00 point brick | A brick for each 2.00 points of closing movement | 7 bricks, 4 up and 3 down | Every move under one brick and all elapsed time |
| Point and figure, 1.00 point box, 3-box reversal | X and O columns from highs and lows | 2 columns, one rising and one falling | Every move under the 3.00 point reversal and all elapsed time |
The line chart says price went up and came back. The candles say the same thing with the range attached. The Renko and point and figure versions say mostly what your settings allowed them to say, and that part rarely gets mentioned next to the chart's name. No chart type here added a single trade.
How to Read Line, Bar, Candlestick and Other Chart Types
Each chart type below is read on the same five bar ES sequence, with bar 1 opening at 4,996.00 and bar 5 closing at 4,995.50.
Line Charts
A line chart joins one price per period, and on almost every platform that price is the close. On the five bar sequence it draws five points between 4,995.50 and 5,004.75, a 9.25 point span, while the bars themselves covered 11.50 points.
That missing range is the whole tradeoff. A line chart is the cleanest way to see direction over weeks or months, which is why CME describes it as a quick way to view a longer-term trend. It cannot tell you whether a level was tested intraday, so it cannot place a stop. Use it to decide where to look, then switch to bars or candles to plan the trade.
Bar Charts
A bar chart, also called an OHLC or HLOC chart, shows four prices per period. The vertical line spans the high to the low, a short tick on the left marks the open and a short tick on the right marks the close.
Reading a bar comes down to where the close tick sits inside the range. On the five bar ES sequence, bar 2 closed at 5,004.75, just 0.75 points under its 5,005.50 high, so buyers held most of the move. Bar 5 closed at 4,995.50, 0.75 points above its 4,994.75 low, so sellers did. A close tick near the middle of a wide bar says neither side finished in control.
The advantage over candles is visual weight. A screen of single-colour bars draws your eye to the shape of the ranges rather than the colour of the bodies, which some traders find easier on long studies. The cost is reading speed, because you have to find the two small ticks on every bar.
Candlestick Charts
A candlestick carries exactly the same four prices as a bar. The body spans the open to the close, the wicks reach the high and the low, and the colour shows whether the close finished above or below the open.
CME's lesson reads a long body as strong movement over the period and long wicks as a wide range where neither side held control. That reading is useful, but it is worth being blunt about where it comes from: a candle holds no information the bar does not. It is faster to scan, and that speed is the whole benefit. Every candlestick pattern is arithmetic on the open, high, low and close.
Heikin Ashi Charts
Heikin Ashi (Japanese for average pace) replaces each candle's prices with calculated values. StockCharts gives the standard formula:
- Heikin Ashi close is the average of the bar's open, high, low and close.
- Heikin Ashi open is the midpoint of the previous Heikin Ashi open and close. The first candle uses the average of the real open and close.
- Heikin Ashi high is the highest of the real high, the Heikin Ashi open and the Heikin Ashi close.
- Heikin Ashi low is the lowest of the real low, the Heikin Ashi open and the Heikin Ashi close.
Run on the five bar sequence, it produces this:
| Bar | Real close | Real direction | Heikin Ashi open | Heikin Ashi close | Heikin Ashi direction |
|---|---|---|---|---|---|
| 1 | 5,000.75 | Up | 4,998.375 | 4,998.375 | Flat |
| 2 | 5,004.75 | Up | 4,998.375 | 5,002.6875 | Up |
| 3 | 5,002.75 | Down | 5,000.53125 | 5,003.9375 | Up |
| 4 | 4,999.00 | Down | 5,002.234375 | 5,000.875 | Down |
| 5 | 4,995.50 | Down | 5,001.5546875 | 4,997.375 | Down |
Look at bar 3. The real bar fell from 5,004.75 to 5,002.75, and the Heikin Ashi candle printed up. Bar 1 rose in reality and printed flat. And on bar 5 the Heikin Ashi close sits 1.875 points above the real close, which is 7.5 ticks, $93.75 per ES contract or $9.375 per MES contract.
Heikin Ashi is good at what it was built for. Runs of same-coloured candles are easier to count than raw bars, which makes it harder to talk yourself out of a trend on one red candle. It is poor for order placement. None of those Heikin Ashi opens or closes is a price that traded, and a stop has to sit at a price that can print.
Renko Charts
A Renko chart replaces the clock with a fixed brick size. TradingView's help page gives the rule: with a 2-point brick covering $52 to $54, the next brick needs a close at or above $56 or at or below $50. Continuing needs one brick of movement, reversing needs two.
On the illustrative five bar ES sequence, using the closes of 5,000.75, 5,004.75, 5,002.75, 4,999.00 and 4,995.50 and starting from bar 1's open at 4,996.00, a 2.00 point brick draws 4 up bricks to 5,004.00, then 3 down bricks back to 4,996.00. Seven bricks, and nothing on the chart tells you whether they took five minutes or five hours.
That is the cost. A brick has no duration, so you cannot timestamp an entry from the Renko chart alone or compare two sessions by counting bricks. The brick size also decides what you see, which is why the brick size deserves its own table and a place in the trading plan.
Point and Figure Charts
Point and figure charts stack X boxes in rising columns and O boxes in falling columns. Each box is a fixed price step, and a column only reverses after price moves a set number of boxes the other way. StockCharts describes the 3-box reversal as the most popular method, so a 1.00 point box needs a 3.00 point move to start a new column.
On the five bar sequence with a 1.00 point box, the chart draws just 2 columns: X boxes from 4,996 up to 5,006, then O boxes from 5,005 down to 4,995. Five bars of back-and-forth collapse into one rise and one fall. That is the filter doing its job, and it is also everything the filter threw away.
Tick and Range Bar Charts
Tick charts and range bar charts keep the bar format but change what finishes a bar.
A tick chart closes a bar after a set number of trades, so bars form quickly when volume is heavy and slowly when it is light. A range bar chart closes a bar once price has covered a set range, so every bar has the same height and a different duration. TradingView defines one range unit as one tick.
The trap is comparison. A busy session prints far more tick bars than a quiet one, so "the last 20 bars" means something different every day. Compare tick charts only against the same tick setting, inside similar sessions.
How a Renko Brick Size Changes the Chart
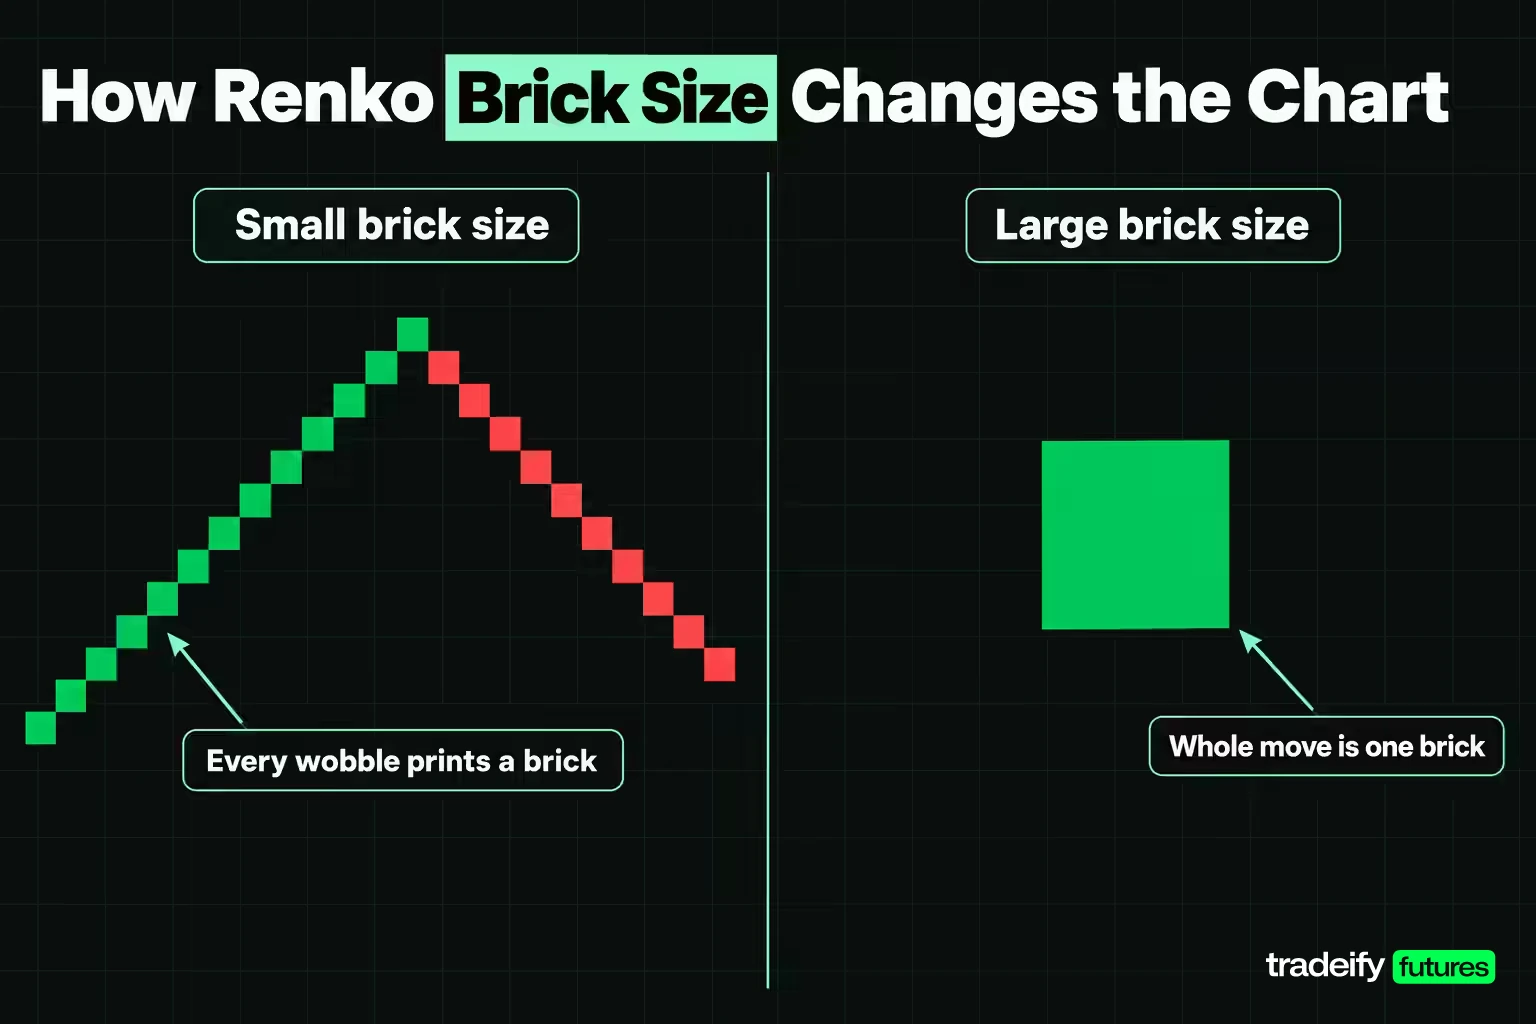
The brick size on a Renko chart is the clearest case of a setting doing the analysis for you. Here are the same five closes, starting from 4,996.00, with the standard two-brick reversal:
| Renko brick size | Bricks drawn | Move needed to reverse | Ticks to reverse | Reversal value per ES | Reversal value per MES |
|---|---|---|---|---|---|
| 0.50 point | 34 | 1.00 point | 4 | $50.00 | $5.00 |
| 1.00 point | 15 | 2.00 points | 8 | $100.00 | $10.00 |
| 2.00 points | 7 | 4.00 points | 16 | $200.00 | $20.00 |
| 3.00 points | 3 | 6.00 points | 24 | $300.00 | $30.00 |
| 4.00 points | 3 | 8.00 points | 32 | $400.00 | $40.00 |
| 6.00 points | 1 | 12.00 points | 48 | $600.00 | $60.00 |
| 12.00 points | 0 | 24.00 points | 96 | $1,200.00 | $120.00 |
At 0.50 points every wobble shows up as a brick. At 6.00 points the whole sequence is one up brick, and at 12.00 points the chart is blank. Same trades, same 11.50 point range.
The reversal column is the number that belongs in your plan. If you exit when the Renko chart changes colour, a 3.00 point brick means you have accepted a 6.00 point move against you before the chart says anything, which is $300.00 per ES contract. Choosing a brick size is choosing that number.
Related lesson: Tick size and tick value
Choosing Between Trading Chart Types
Choosing a chart type is really choosing which decision you want to make easier. Each option below shows something clearly and gives something up.
| If your decision depends on | Chart type that shows it most directly | What that choice costs |
|---|---|---|
| Where price is over days or weeks | Line chart on a higher timeframe | No highs or lows, so no entry or stop can be planned from it |
| How each period opened, closed and ranged | Bar or candlestick chart | A clock ends each bar, and you have to pick the clock in advance |
| Whether a trend is continuing | Renko or point and figure chart | No timestamps, and the brick or box size becomes a strategy input |
| How active the market is at a price | Tick or range bar chart | Bar counts follow activity, so sessions are hard to compare |
| Whether a pullback is noise or a turn | Heikin Ashi read beside a standard chart | Averaged candles lag, and their opens and closes never traded |
| Whether a chart pattern is forming | Bar or candlestick chart on a fixed timeframe | Patterns depend on the timeframe you chose |
Read the third column as the price of the second. A Renko chart really is clearer on trend than a candlestick chart. It is also untimestamped, and its brick size is now something you have to choose deliberately and then leave alone.
Spotting Chart Patterns on Different Chart Types
Chart patterns are repeated shapes in price that traders use to judge whether a move is likely to continue or turn. Identifying them reliably depends on two things: a clear rule for what counts as the pattern, and a chart type that shows the prices the rule uses.
Most pattern definitions are written for bar and candlestick charts on a fixed timeframe, because they rely on highs, lows and closes. TradingView's own help notes that standard time-based bars work better with chart patterns than range bars do.
Reversal Chart Patterns
Reversal patterns suggest a trend may be ending.
- Head and shoulders. Three peaks with the middle one highest. The line through the two troughs is the neckline, and the pattern completes on a close through it.
- Double top and double bottom. Two tests of the same high or low that fail, with the trough or peak between them as the confirmation level.
- Rounding top and bottom. A slow curve in price rather than sharp peaks, often easier to see on a line chart.
Continuation Chart Patterns
Continuation patterns suggest a trend is pausing rather than ending.
- Flags. A sharp move followed by a short, tight channel against it.
- Pennants. A sharp move followed by a small converging range.
- Rectangles. Price bouncing between a flat ceiling and a flat floor before leaving in the earlier direction.
Triangles and Bilateral Chart Patterns
Triangles show price squeezing into a narrower range. An ascending triangle has a flat top and rising lows. A descending triangle has a flat bottom and falling highs. A symmetrical triangle has falling highs and rising lows.
A symmetrical triangle is the classic bilateral pattern, meaning it can break either way. The honest way to trade a bilateral pattern is to plan both breaks in advance, with a trigger, stop and target for each, and let the market pick.
Confirming a Chart Pattern With Support and Resistance
Most chart patterns are built on horizontal levels. A double top's confirmation level is a support level. A rectangle is a support level and a resistance level. Drawing the level first, and only then asking whether a pattern is forming around it, keeps you from tracing shapes into noise.
A pattern is an observation until price closes beyond its level. A wick through the neckline is not confirmation. A close is.
How the Chart Type Changes the Pattern
The same price data can show a pattern on one chart type and not on another.
- A line chart uses closes only, so two intraday highs at the same level can show as one peak or as two peaks at different heights.
- A Heikin Ashi chart smooths the highs and lows, so double tops often look like a single rounded top.
- A Renko chart only shows moves bigger than the brick, so a pattern narrower than two bricks simply does not exist on it.
- A point and figure chart has its own pattern set, such as double top breakouts on X columns, which is not the same as a bar-chart double top.
So identify patterns on the chart type their definition was written for, and keep the timeframe fixed while you collect examples.
Related lesson: Head and shoulders patterns
Trading a Chart Pattern From Entry to Exit
A chart pattern only becomes a trade when it has an entry, a stop, a target and a condition that cancels it. Here is an illustrative double top on a 5-minute ES chart.
Price makes a first peak at 5,020.00, pulls back to 5,005.00, then rallies to a second peak at 5,019.50 and fails. The 5,005.00 low between the peaks is the neckline. The pattern height is 15.00 points, so the usual measured target projects 15.00 points below the neckline, at 4,990.00.
Break Entry Versus Retest Entry
There are two common ways to enter the double top, and the numbers show why traders argue about them.
| Plan | Entry | Stop | Risk per ES | Reward to 4,990.00 per ES | Reward to risk |
|---|---|---|---|---|---|
| Short the break | 5,004.00 on a 5-minute close below the neckline | 5,020.25, one tick above the higher peak | 16.25 points, 65 ticks, $812.50 | 14.00 points, 56 ticks, $700.00 | 0.86 |
| Short the retest | 5,004.75 after a retest fails at 5,008.25 | 5,008.50, one tick above the retest high | 3.75 points, 15 ticks, $187.50 | 14.75 points, 59 ticks, $737.50 | 3.93 |
On MES the same plans risk $81.25 and $18.75 per contract.
The break entry always gets you in if the move happens, but the textbook stop above the peaks makes the risk larger than the measured reward. The retest entry has far better numbers, but it only exists if price comes back to the neckline, and fast breakdowns often do not. Neither is correct for everyone, and the tempting move is to pick whichever one would have worked on the last trade. Choose one before the pattern forms, so you are not deciding while price is moving and the second peak is still fresh.
False Breakouts and Fakeouts
A false breakout is a close through the pattern's level that quickly reverses. In the double top, a 5-minute close below 5,005.00 followed by the next bar closing back above 5,005.00 is the warning sign.
Write the invalidation into the plan before entry. For the break entry, a close back above the neckline is a reason to exit early rather than wait for the full stop. For the retest entry, a close above the retest high means the pattern has failed. False breakouts are a normal part of pattern trading, so the plan has to assume some will happen.
Related lesson: Breakout trading
How Reliable Chart Patterns Are in Research
The most-cited academic test of chart patterns is Lo, Mamaysky and Wang's 2000 paper in the Journal of Finance. They wrote a computer definition of 10 patterns, including head and shoulders, double tops and bottoms, triangles and rectangles, and applied it to U.S. stocks from 1962 to 1996. Over that 31-year sample, they found several patterns "provide incremental information and may have some practical value."
Read that conclusion carefully. "Some practical value" on average is a long way from a reliable signal. The same paper notes that chart shapes are often "in the eyes of the beholder", which is why they needed an algorithm to define them. A pattern that carries some information on average is not a pattern that works on your next trade.
For a trader, the practical takeaways are:
- Define the pattern precisely enough that two people would mark the same one.
- Fix the chart type and timeframe, because changing either changes which patterns appear.
- Track a sample of your own pattern trades before trusting any of them with real risk.
Related lesson: How to keep a trading journal
Common Chart Type Mistakes and the Rules That Catch Them
Most chart reading errors are judgement errors, but a few come straight from the chart type or its setting.
| What it looks like | What is actually happening | The rule that catches it |
|---|---|---|
| The Renko chart says the trend is up | The brick size decided that; the same closes draw one brick at 6.00 points and none at 12.00 | Write the brick size into the plan and leave it alone inside a sample |
| The Heikin Ashi candle is green, so the long stays | An averaged candle can print up on a real down bar | Read signals on Heikin Ashi, place orders from a standard chart |
| The tick chart just printed a huge bar | That bar needed more trades, not more time | Compare tick bars only within one session type and one setting |
| The 5-minute chart is noisy, so switch to hourly | The clock changed, not the market | Change timeframe for a stated reason and then hold it |
| The line chart gives no entry price | It plots one price per period, so the range is missing | Use the line chart for context and a bar chart for entries |
| The pattern is obvious on this chart | It may only exist on this chart type or setting | Confirm patterns on the chart type their rules were written for |
The hardest mistake to spot is choosing the chart after the outcome. A Renko chart with the right brick size makes almost any past move look clean, and the right brick size is only obvious once the move is over. Fix the setting first, apply it to the next sample unchanged, and score the sample rather than your memory of it.
Related lesson: Common beginner trading mistakes
A Five Step Routine for Picking a Chart Type
Picking a chart type works best as a written decision you make once, before the next session, rather than something you revisit every time a trade goes wrong.
- Name the decision the chart has to support, such as trend context over weeks or entries and stops in the next session.
- Pick the fewest charts that cover it, usually one higher timeframe chart for context and one working chart for execution.
- If a chart is price-based or trade-based, write down the brick size, box size, tick count or range, and whether a reversal needs one unit or two.
- Check that the working chart gives you a timestamp and a real traded price for the stop. If it does not, it is a context chart only.
- Hold the setting fixed for a defined sample, then judge whether the chart made the decision easier to repeat or just nicer to look at.
On our accounts, chart type is a platform setting rather than an account rule. WealthCharts offers Candlestick, OHLC, Line, Area, Heikin Ashi, Kagi and Renko bar styles plus Chart Replay for practice on past data, and Quantower, which connects with Rithmic credentials, offers candlestick, bar, line, Heikin Ashi, Renko and Range charts. Whatever you chart, orders fill at real prices and every position has to be closed by 4:45 PM ET.
Trading Chart Types FAQ
What are the four most common chart types in Excel?
The four most common chart types in Excel are column, line, pie and bar charts, the first four in Microsoft's list of Excel chart types. For trading data, Excel also has stock charts, including high-low-close and open-high-low-close versions that work like a basic OHLC bar chart. A line chart in Excel plotted from closing prices is the same thing as a trading line chart.
Which chart type do most traders use?
Candlestick charts are the usual default because the body makes the open and close quick to read. They carry the same four prices as a bar chart, so some traders still prefer bars for long studies. The best choice is the one you read accurately and consistently.
Is a candlestick chart better than a bar chart?
No, because both plot the same open, high, low and close for each period. A candle is faster to read and a bar is quieter on the screen. Pick one and stop switching mid-sample.
What is the 3-5-7 rule in trading and how does it work?
The 3-5-7 rule caps risk at 3% of the account per trade and 5% across all open positions, and aims for winners of at least 7%. It is an informal rule of thumb, not a regulation, and versions differ. It is a risk rule, so it applies the same whichever chart type you use.
What types of trading styles are there?
The main styles are scalping, day trading, swing trading and position trading, sorted by how long trades are held. Shorter styles tend to use tick, range or short time-based charts. Longer styles lean on daily and weekly bar, candlestick or line charts.
Which chart is best for option trading?
Options traders usually chart the underlying market with ordinary candlestick, bar or line charts. The chart type does not change because the trade is an option. What changes is that time to expiry and volatility also affect the option's price, which no price chart shows on its own.
Do Renko and point and figure charts work for futures?
They draw a valid filtered view of futures prices, and many futures platforms support them. Neither has a time axis, and the brick or box size changes the chart a lot. Most traders who use them run them beside a time-based chart rather than instead of one.
This article is general education about how chart types are built and read, not investment advice or a recommendation to trade any product. Futures are leveraged, and losses can exceed what you expect or deposit, and a chart that makes a trend look orderly does not make the next move any safer. Evaluation and funded accounts are simulated, and simulated results do not represent live trading. Every price in the worked examples is illustrative.


