



TL;DR: Head and shoulders patterns are three-peak reversal shapes that only count once price closes beyond a neckline drawn in advance. The target is the head-to-neckline height projected from the break. In Bulkowski's stock sample, 51% of tops reached that full target. Stop placement sets the break-even win rate, and published research on profits is mixed.
What Head and Shoulders Patterns Are
A head and shoulders pattern is a reversal shape built from three swing highs. The middle high (the head) is the tallest, the two outer highs (the shoulders) sit lower and near each other in price, and a line through the two pullback lows between them is the neckline.
The standard version is a top. It forms at the end of an advance and is read as bearish, because it describes a market that tried three times to keep rising and failed on the third try. The inverse version, sometimes called a head and shoulders bottom, flips the shape: three swing lows with the middle one lowest, forming after a decline and read as bullish.
What the pattern claims is narrow. It says the advance has lost buyers and that a close through the neckline marks the point where the old trend is in doubt. It does not say how far price will travel, and it does not say when. Every target and timing rule people attach to it is a separate assumption you can test.
Here is where traders usually get caught. Two conditions separate a real pattern from three bumps on a chart. There has to be a trend to reverse, and the head has to stand clearly above both shoulders. Thomas Bulkowski, whose pattern statistics are some of the most cited, puts the first condition plainly: price must have something to reverse, so a small rise into the pattern should mean a small decline out of it.
Related lesson: Market structure, highs, lows and trends
Why the Head and Shoulders Shape Forms
The head and shoulders shape is a record of buyers losing conviction in stages. Charles Schwab's education team describes the left shoulder as the point where traders pushing price higher temporarily lose enthusiasm, the head as the moment enthusiasm peaks before price drops back toward the earlier low, and the right shoulder as a rally that fails to reach the prior high.
Read it as a sequence of decisions. At the left shoulder, buyers take profits and price dips. At the head, late buyers chase a new high, and when it fails they are trapped above the market. At the right shoulder, buyers try again but run out before the old high, which tells sellers the market can be pushed lower.
The neckline break is where that pressure becomes visible. Traders who bought the head and the right shoulder are now losing money, and their stops sit below the neckline. When those stops are hit, the selling can feed on itself for a while. That is the theory, and it is also why the break can fail: if the trapped buyers already sold, there is no fuel left.
Anatomy of a Head and Shoulders Top
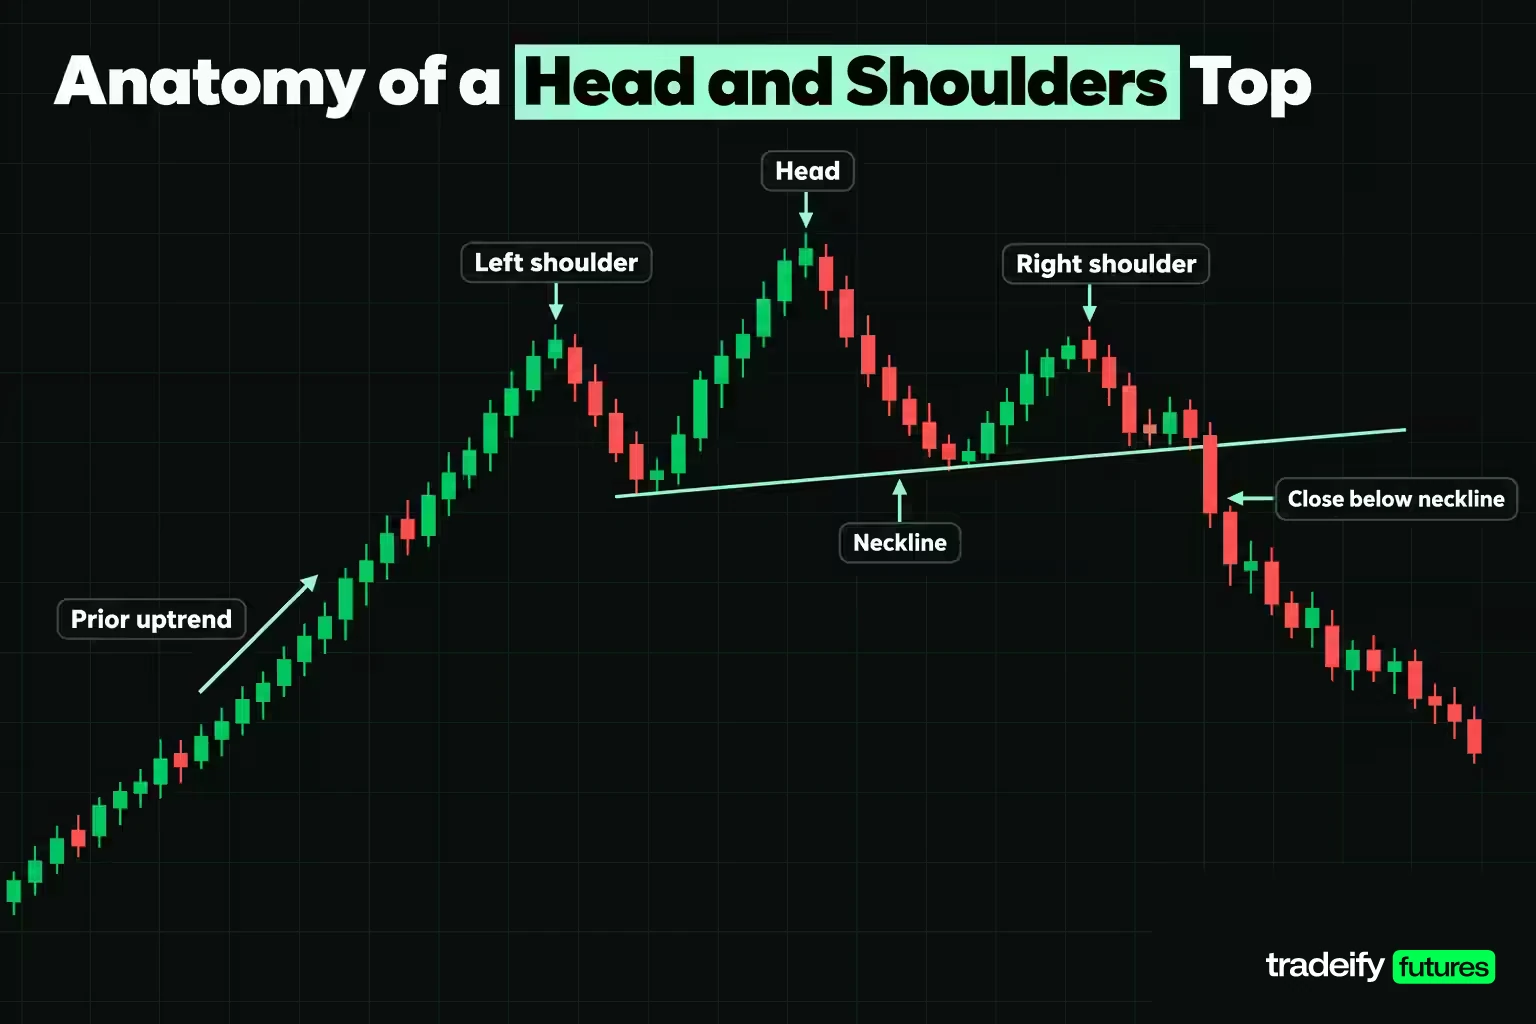
A head and shoulders top has five parts, and each one has a condition that cancels it. Most guides name the parts and skip the cancellations, which is where traders get caught.
| Part | What it is | What stops it counting |
|---|---|---|
| Prior uptrend | The advance the pattern is meant to reverse | A sideways drift with nothing to reverse |
| Left shoulder | A swing high that fails and pulls back | A shoulder that is the highest point, which makes it the head |
| Head | The highest of the three swing highs | A head almost level with the shoulders, which reads as a range |
| Right shoulder | A lower high after the head, usually near the left shoulder in price and time | A right shoulder that rallies above the head |
| Neckline | The line joining the pullback low before the head to the pullback low after it | A line drawn through only one low, borrowing its slope from a trendline |
The neckline answers one of the most searched questions about the pattern. It is the support line under the structure, joining the two troughs (Bulkowski calls them armpits) on either side of the head. It can be flat, rising or falling. Bulkowski confirms a top when price closes below an up-sloping neckline, or below the right armpit low when the neckline slopes down.
Volume is the supporting evidence rather than a part. In Bulkowski's sample of tops, volume was highest on the left shoulder, then the head, and trended downward across the pattern 61% of the time. Schwab describes the same idea from the other end: volume easing into the head and right shoulder, then expanding on the break.
Related lesson: Support and resistance
Head and Shoulders Pattern Types
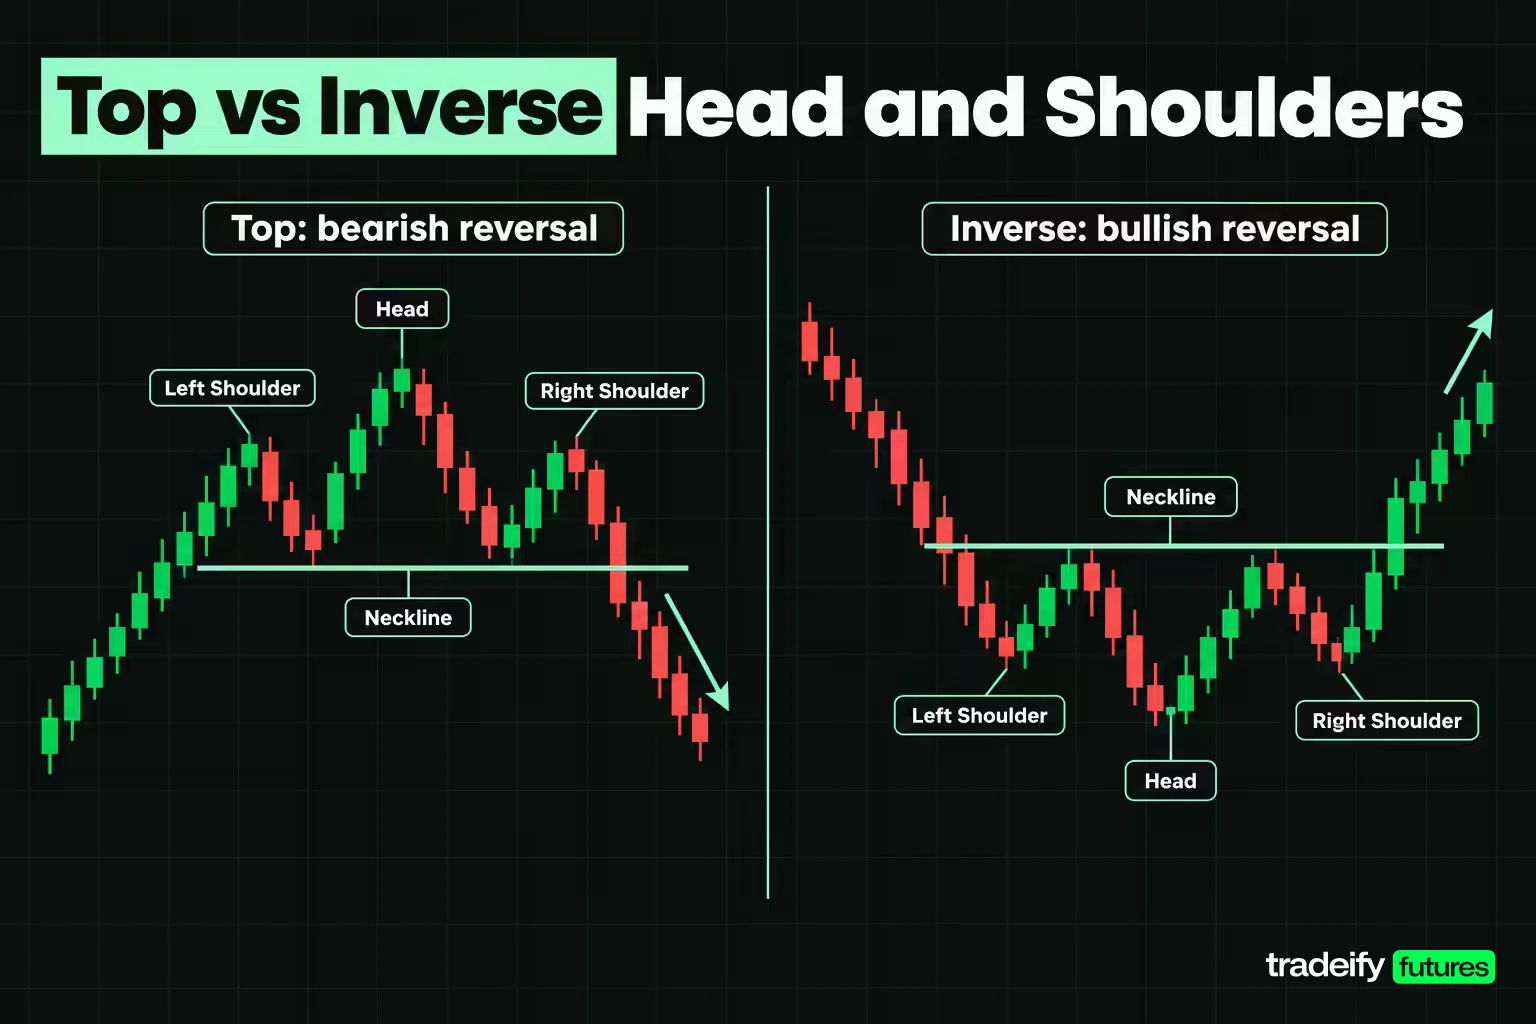
Head and shoulders pattern types differ by direction and by how many peaks they contain. Each version carries its own base rates in Bulkowski's testing on stocks, which give a sense of how the variants behave.
| Pattern type | Where it forms | Read as | Bulkowski base rates |
|---|---|---|---|
| Head and shoulders top | After an advance | Bearish reversal | 19% break even failure, 16% average decline, 51% meeting target |
| Inverse head and shoulders | After a decline | Bullish reversal | 11% break even failure, 45% average rise, 71% meeting target |
| Complex head and shoulders top | After an advance, with extra shoulders or heads | Bearish reversal | 18% break even failure, 17% average decline, 47% meeting target |
| Continuation head and shoulders | Inside an existing trend, pointing with it | Continuation | No base rate published on the pages checked |
The top and the inverse are mirror images in shape but not in behavior. Bulkowski's bottom sample of 3,197 patterns shows a lower failure rate and a higher share meeting the target than his top sample of more than 2,800. Those are stock market numbers from his own definitions, so they describe his sample rather than your instrument.
The complex top has multiple left or right shoulders, or more than one head, but rarely both. Its neckline joins the lowest armpits and is often close to flat. Traders sometimes miss these because the extra shoulder makes the shape look untidy.
A continuation head and shoulders appears when the shape forms in the middle of a trend and breaks in the trend's direction, such as an inverse shape inside an uptrend. Treat it with extra care. It is the same shape doing a different job, and that makes it easy to rename a failed reversal as a continuation after the fact.
How to Identify a Valid Head and Shoulders Pattern
Identifying a valid head and shoulders pattern is mostly about filtering out the shapes that only look right. Run each candidate through a short list of tests before the neckline breaks, and write the answers down.
| Validity test | What to check | Why it matters |
|---|---|---|
| Trend into the pattern | The advance should be at least twice as long as the distance between the shoulders | A short rise gives the pattern little to reverse |
| Head clearance | The head stands clearly above both shoulders | Three peaks of similar height are a range |
| Shoulder symmetry | Shoulders peak near the same price and sit at a similar distance from the head | A lopsided shape is often a different pattern |
| Volume sequence | Volume eases into the right shoulder and expands on the break | Rising volume into the right shoulder suggests buyers are still active |
| Confirmation | A close beyond the projected neckline, not an intraday pierce | Pierces that close back inside are the most common false signal |
The trend test comes from Schwab, which calls it a common rule and says it applies to intraday charts as well as longer ones. It is a time test. If the shoulders are 44 bars apart, you want an advance of at least 88 bars leading into the left shoulder.
Symmetry is a guideline, not a law. Bulkowski asks for shoulders near the same price and a similar distance from the head, but his own study found tops with a higher left shoulder declined 25% on average, against 20% for a higher right shoulder and 19% for even shoulders. A perfect-looking pattern is not automatically the better trade.
Head and shoulders invalidation conditions
A head and shoulders pattern is invalid, or has failed, when any of these happen:
- The right shoulder closes above the head. The structure is gone, and calling it a wider pattern is a way of avoiding the loss.
- Price closes back above the neckline soon after the break and holds there. That is a failed break, and some traders treat it as a signal in the opposite direction.
- The neckline is never closed through. A pattern that never confirms is a sketch, not a setup.
- The move into the pattern turns out to be part of a range, with the trend test failing once you measure it honestly.
Decide which of these ends the idea before you enter. If you only decide afterward, you will usually choose the one that lets you stay in.
Drawing the Neckline in Real Time
The neckline is where most head and shoulders mistakes start, so it is worth working with numbers. The two troughs are rarely level, which means the neckline has a slope, and the slope changes both the trigger and the target.
Take an illustrative top on Micro E-mini S&P 500 futures (MES). The contract is worth $5 per index point, and the minimum tick is 0.25 points, worth $1.25. Every price below is a round illustrative level, not a real market record.
| Bar | Event | Price | Neckline value at that bar |
|---|---|---|---|
| 0 | Advance begins | 6,900.00 | Not yet defined |
| 100 | Left shoulder high | 7,100.00 | Not yet defined |
| 108 | Trough one | 7,040.00 | 7,040.00 |
| 120 | Head high | 7,160.00 | 7,046.00 |
| 132 | Trough two | 7,052.00 | 7,052.00 |
| 144 | Right shoulder high | 7,090.00 | 7,058.00 |
| 152 | Close below the neckline | 7,056.00 | 7,062.00 |
| 172 | Retest of the neckline | 7,072.00 | 7,072.00 |
The two troughs sit at 7,040.00 and 7,052.00, 24 bars apart. That is a rise of 12.00 points, or 0.50 points per bar. Projected forward, the line reads 7,058.00 under the right shoulder and 7,062.00 on bar 152, where price closes at 7,056.00. The close is 6.00 points beyond the line, which is 24 ticks.
Two things follow. First, the neckline does not exist until the second trough prints. Before bar 132 you have a trendline through one low, not a neckline, and treating its first breach as a break is a common premature entry.
Second, the line has to be projected before price gets there. Write down its value for the next few bars when the right shoulder forms. If you draw it after the break, you are free to adjust the slope until the break looks decisive, and every chart you review afterward will look better than the trades you actually took.
Related lesson: Trendlines and channels
Measuring the Head and Shoulders Profit Target
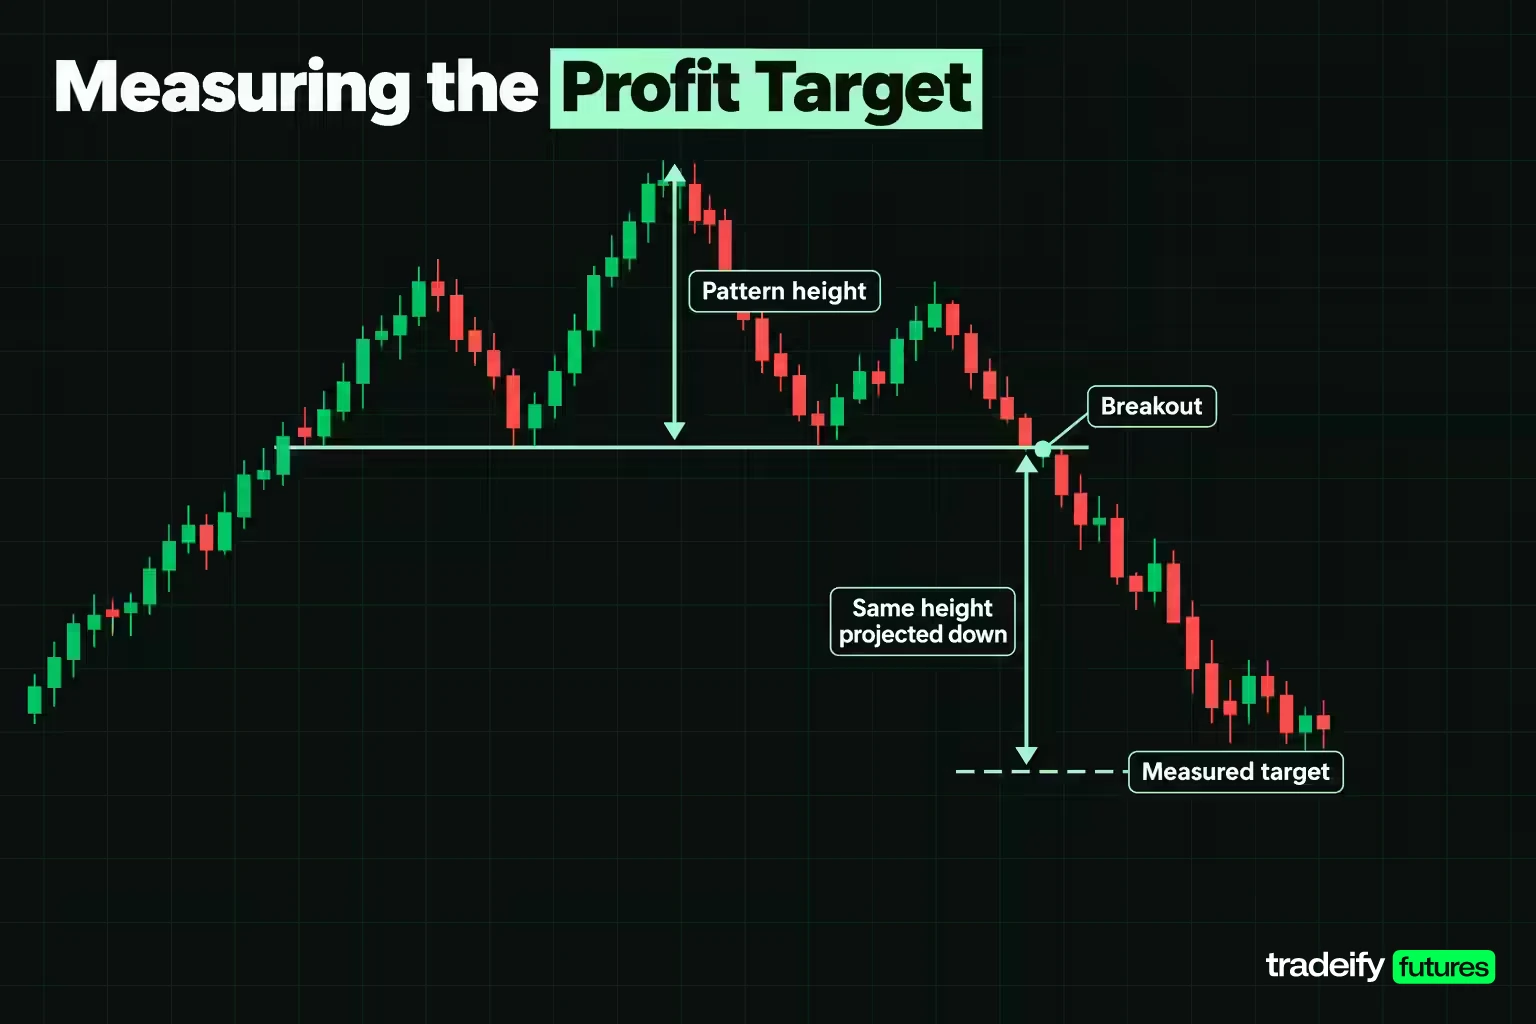
The head and shoulders profit target comes from the measure rule: take the height of the pattern and project it from the breakout. Bulkowski measures the height from the head down to the neckline directly below it, then subtracts it from the breakout price, which on an up-sloping neckline is where price crosses the line.
In the MES example the head is 7,160.00 and the neckline under the head is 7,046.00, so the height is 114.00 points. The neckline at the break is 7,062.00, so the full measured target is 6,948.00.
Now the slope matters. Read the height at trough two instead and it becomes 108.00 points. That 6.00 point difference is $30.00 per MES contract and 5.26% of the height. A target that moves 5% depending on where you hold the ruler is better treated as a zone than a single price.
The head and shoulders hit-rate adjustment
Bulkowski's sample of head and shoulders tops met the full measured move 51% of the time, so his version of the measure rule multiplies the pattern height by that rate before subtracting it from the breakout price. In the illustrative MES top, with a 114.00 point height and a 7,062.00 neckline at the break, that gives 58.14 points and a target of 7,003.86 instead of 6,948.00. The gap between the two targets is 55.86 points, or $279.30 per contract.
Neither is the right answer. The full target describes what the pattern can do. The adjusted one is closer to what a typical pattern in his sample actually did.
Checking the path to the head and shoulders target
Before trusting any measured target, look at what sits in the way. In the illustrative MES top, price closed at 7,056.00 and the full target is 6,948.00. If an earlier support level sits at 6,980.00, it is 76.00 points below the close. That is 70.37% of the 108.00 point move from the close to the full target, and the last 32.00 points lie beyond a level the market has already respected.
That is not a reason to skip the trade. It is a reason to treat 6,980.00 as the realistic first target and the measured move as the optimistic one.
Head and Shoulders Entry Rules
Head and shoulders entry rules come down to three choices, and each one trades a better price against a lower chance of getting filled.
- Break entry. Enter on the close beyond the neckline. You are in every move that runs, but you also take every break that fails, and the entry is usually far from a logical stop.
- Retest entry. Wait for price to return to the projected neckline and enter there. You get a better price and a tighter stop, but strong moves often never come back.
- Confirmation entry. Wait for a second close beyond the neckline, or a close beyond the low of the breakout bar. Fewer false signals, worse price.
The retest is common enough to plan for. Bulkowski's top sample shows a pullback to the breakout price within 30 days 68% of the time, and he notes that pullbacks hurt the average decline that follows. So a retest is normal, but a pattern that retests may also move less afterward.
Pick the entry before the break. Missing the break does not make the next price a good entry. A trader who planned to buy the retest and then chases the break because it looks strong has switched to a different trade with a different stop, usually without noticing.
Where to Put a Head and Shoulders Stop Loss
A head and shoulders stop loss usually goes in one of two places, and the choice changes the trade more than the entry does.
- Above the right shoulder. The tighter structural stop. If price climbs back above the right shoulder, the sequence of lower highs is broken and the pattern is in doubt.
- Above the head. The wider stop. Price above the head cancels the pattern completely, so this stop is hit only when the idea is clearly wrong, but it costs more per contract.
Put the stop a little beyond the level, not on it. In the example the stops sit at 7,091.00 and 7,161.00, one point above the right shoulder and the head. A stop placed exactly at a swing high is where a retest tends to reach before turning.
A stop order is not a guaranteed exit price. Schwab's guide points out that there is no guarantee a stop order will be executed at or near the stop price, and in fast markets a stop becomes a market order that can fill well past the level. For a short, the stop sits above the market, so a sharp squeeze can fill you higher than planned.
Related lesson: Stop-loss orders and placement
Position Sizing and Reward to Risk Priced Four Ways
The same head and shoulders pattern supports very different trades once you price them. The table uses the MES example, the 6,948.00 full target, and an illustrative risk budget of $500 per trade. Break-even win rate is risk divided by risk plus reward, before commissions and slippage.
| Route | Entry | Stop | Risk per contract | Reward to target | Reward to risk | Break-even win rate | Contracts on $500 |
|---|---|---|---|---|---|---|---|
| A break, stop over right shoulder | 7,056.00 | 7,091.00 | $175.00 | $540.00 | 3.09 | 24.48% | 2 |
| B break, stop over head | 7,056.00 | 7,161.00 | $525.00 | $540.00 | 1.03 | 49.30% | 0 |
| C retest, stop over head | 7,072.00 | 7,161.00 | $445.00 | $620.00 | 1.39 | 41.78% | 1 |
| D retest, stop over right shoulder | 7,072.00 | 7,091.00 | $95.00 | $620.00 | 6.53 | 13.29% | 5 |
Read the table as a set of tradeoffs, not a ranking. Route A risks 35.00 points per contract for 108.00 points of reward and needs to win about one trade in four to break even. Two contracts put $350.00 at risk.
Route B is the structurally safest stop and the most expensive. One contract would risk $525.00, more than the $500 budget allows, so the honest answer is that the trade does not fit at this size. Widening the budget to make it fit is how one pattern turns into an oversized loss.
What the head and shoulders retest routes show
In the illustrative MES top, the retest routes (C and D) wait for price to come back to the neckline at 7,072.00 before shorting, which adds 16.00 points to the reward compared with entering on the 7,056.00 break close. Route D looks like the best line in the table, at 6.53 reward to risk and a 13.29% break-even rate, with five contracts putting $475.00 at risk.
It is also the most fragile. The stop is only 19.00 points away, and one tick against five contracts is $6.25, or 1.25% of the budget. A small spike through the right shoulder ends the attempt. A tight stop is not smaller risk. It is the same dollar risk with less room for noise, and it only works if you also accept missing the many breaks that never retest.
Notice that the target never moved. Only the stop and the entry changed, and that is the real decision in a head and shoulders trade. You can read the pattern correctly and still pick a route your account cannot carry.
Related lesson: Risk-reward ratio
Managing a Head and Shoulders Trade After Entry
Managing a head and shoulders trade after entry is about three decisions you should make before the order goes in: where to take partial profit, when to move the stop, and what makes you leave early.
- Partial profit at the first support. In the example, taking part of the position off at 6,980.00 banks the most likely portion of the move and leaves the rest for the measured target.
- Moving the stop. Moving the stop to breakeven too soon is the classic way to get taken out by the retest. A common approach is to wait until price makes a new low beyond the breakout bar, then move the stop to just above the most recent lower high.
- Leaving early. If price returns to the neckline and closes back above it, the break has failed. Exiting there costs less than waiting for the full stop.
The retest is where patience gets tested, and it happens fast. Price climbs back toward the neckline, the open profit shrinks, and the urge to close and lock in something is strong. If the plan allowed for a retest, the retest is not new information. A close back above the neckline is.
Related lesson: Scaling in and scaling out
Head and Shoulders Strategies for Day Trading
Head and shoulders strategies for day trading use the same rules on shorter bars, with a few extra filters because intraday charts produce many more lookalikes.
Check the higher timeframe first
A clean head and shoulders shape on a one-minute chart often sits inside nothing in particular on the 15-minute chart. Before trading it, look at the same window one or two timeframes up. A small top that forms just under a higher-timeframe resistance level has context. One that forms in the middle of a quiet range usually does not.
Respect the trading session for intraday patterns
Intraday head and shoulders patterns form differently across the session. Shapes that build during thin trading hours can break as soon as liquidity returns and volume changes character. Many day traders only take neckline breaks during the main session for the market they trade, when volume is more reliable as confirmation.
Size the head and shoulders target to the time you have
A day trade has to reach its target before you close the position. If the measured move is larger than the instrument's usual remaining range for the session, the first support level is a more honest target than the full projection.
The shoulder-distance trend test on intraday bars
Schwab's head and shoulders rule that the advance should be at least twice as long as the distance between the shoulders applies intraday too. On five-minute bars, a pattern with shoulders 20 bars apart needs a trend of about 40 bars leading into it. That simple count removes many of the small three-peak wiggles that appear every session.
Related lesson: Multiple-timeframe analysis
What Research Says About Head and Shoulders Patterns
Head and shoulders patterns have been tested on real markets more than most chart shapes, and the results disagree. That disagreement is the most useful thing to know.
Studies that found an edge
Carol Osler and Kevin Chang, writing as New York Fed staff in 1995, applied a computer-identified head and shoulders rule to daily exchange rates of the major currencies against the dollar from March 1973 to June 1994. They found the rule generated statistically significant profits, but it was dominated by simple filter rules, so simpler methods did better.
Andrew Lo, Harry Mamaysky and Jiang Wang built an automated pattern recognition method and applied it to a large number of US stocks from 1962 to 1996. They concluded that several technical patterns, head and shoulders among them, provide incremental information and may have some practical value.
Gene Savin, Paul Weller and Janis Zvingelis used a modified version of that method on S&P 500 and Russell 2000 stocks from 1990 to 1999. They found little or no support for a stand-alone trading strategy, but strong evidence that the pattern predicted excess returns, with risk-adjusted excess returns of 5% to 7% a year for a strategy conditioned on the pattern.
Studies that found losses
Osler later studied the pattern in US equities and concluded that head and shoulders traders behaved like noise traders: trading volume was exceptionally high when they were active, their trading was unprofitable, and the price effects disappeared within two weeks.
Michael Dempster and Clifford Jones at Cambridge built head and shoulders formations from British pound against dollar tick data from 1989 to 1997 and tested several trading rules across daily, 480-minute, 240-minute, 60-minute and one-minute bars. Their slippage-adjusted profits were consistently negative, and the losses were larger than the maximum slippage deduction of twenty pips, so the strategy lost money before slippage. Their filters improved results by over twenty pips from worst rule to best, which still started from a loss.
Real market head and shoulders examples
Bulkowski's trading lessons for head and shoulders bottoms name real stock charts, and the failures are the useful part. In CLX, a straight-line run up was followed by a loose, wandering decline into a head and shoulders bottom between June 3 and July 3, 2013, and the trade failed. He lists further failures where price had been falling hard into the pattern and then broke out on one tall bar: CRL from September 22 to October 18, 2011, CMCO from August 25 to October 30, 2015, and CMI from July 17 to August 4, 2015.
Two lessons come out of those charts. A messy, wandering trend into the pattern is a warning, and a single tall breakout bar after a steep move often retraces before anything else happens. Both are things you can check before entry, not after.
How to read the base rates
Bulkowski's base rates sound more encouraging: a 19% break even failure rate for tops and 11% for bottoms. Two cautions apply. His break even failure rate counts patterns that failed to move at least 5% after the breakout, which is a low bar and a different question from whether a set of trading rules made money after costs. And his figures come from stocks, not intraday futures.
The honest summary is that the shape carries some information, and capturing it after costs and execution has defeated many published attempts. Test your own version before trusting it. Confidence without a sample is a story.
Related lesson: Backtesting a trading strategy
Common Head and Shoulders Mistakes
Most head and shoulders mistakes are predictable, which means a written rule can catch most of them.
| Mistake | What it looks like | The rule that catches it |
|---|---|---|
| Trading before confirmation | Shorting the right shoulder because the shape looks finished | No entry until a close beyond the projected neckline |
| Hindsight neckline | A line that only looks right after the break | Write the neckline value down when the right shoulder forms |
| No trend to reverse | Three peaks inside a flat range | Measure the trend against the shoulder distance first |
| Intraday pierce taken as a break | Price trades through the line and closes back inside | Act on closes, not touches |
| Target inside support | The measured move runs straight into a level the market respected | Mark support first and treat it as the first target |
| Stop chosen to fit the size | Moving the stop closer so more contracts fit | Size from the stop, never the stop from the size |
| Renaming a failure | Calling a broken top a complex pattern or a continuation | Decide invalidation before entry and honor it |
The hindsight problem deserves extra attention because it distorts every review you do. Scroll back through a chart and the patterns look obvious, because you can see how each one ended. Schwab notes that newcomers to technical analysis see head and shoulders patterns everywhere. The test is whether the pattern, its neckline and its stop were recorded before the break.
Related lesson: How to keep a trading journal
Head and Shoulders vs Double and Triple Tops
Head and shoulders is one of several reversal patterns built from failed highs, and the differences matter because they change where the stop goes.
| Reversal pattern | What it shows | Usual stop | Main weakness |
|---|---|---|---|
| Head and shoulders top | An advance failing in three steps, the middle one highest | Above the right shoulder or above the head | Easy to see in hindsight, harder to confirm live |
| Inverse head and shoulders | A decline failing in three steps, the middle one lowest | Below the right shoulder or below the head | Bottoms can take longer to complete |
| Double top | A high rejected twice at about the same level | Above the second high | Less structure, so the stop is closer to price |
| Triple top | A level rejected three times | Above the highest peak | Long ranges eat time before any break |
People often ask which pattern is the most powerful. There is no single answer, because performance depends on the market, timeframe and rules used. In Bulkowski's own bull market ranking, the head and shoulders top places 9 out of 36 patterns with downward breakouts on overall performance, and the bottom places 13 out of 39 patterns with upward breakouts. Those ranks are useful context, not a reason to prefer one shape everywhere.
If a chart could be read as either a head and shoulders or a double top, decide which one it is before you choose the stop. Picking the label after you pick the size is a way of choosing your risk backward.
Related lesson: Double top and double bottom
A Head and Shoulders Checklist Before You Trade
Run this checklist on every head and shoulders setup, in order, before the neckline breaks. It splits into two jobs: confirming the pattern is real, then pricing the trade.
Confirming the head and shoulders pattern
- Measure the trend into the pattern and confirm it is at least twice the distance between the shoulders.
- Confirm the head is clearly the highest of the three peaks.
- Confirm the right shoulder has not closed above the head.
- Draw the neckline through both troughs, project it forward, and write down its value for the next few bars.
- Write the invalidation level and confirm you can afford to be stopped there.
Pricing the head and shoulders trade
- Measure the height from the head to the neckline below it, project the target, and note the hit-rate-adjusted version.
- Mark the nearest support in the way and decide whether it is your first target.
- Choose break, retest or confirmation entry in advance.
- Size the position from the stop distance and your risk budget, and skip the route that does not fit.
- Record the setup and its outcome, and judge the method only after a meaningful sample.
Session limits on a head and shoulders trade
On our accounts, every position must be closed by 4:45 PM ET on regular trading days, and overnight or swing holds are not allowed. That means a head and shoulders top on a daily chart can inform your bias, but the trade itself has to be planned and finished inside one session. Size it within your account's contract limit (a 50K account allows 4 minis or 40 micros), and treat funded accounts as the simulated accounts they are. If you use WealthCharts, its Chart Replay lets you practice drawing necklines on historical data bar by bar.
Head and Shoulders Pattern FAQ
Is a head and shoulders pattern bullish?
The standard head and shoulders top is bearish, because it forms after an advance and points to a possible turn lower. The inverse head and shoulders is bullish and forms after a decline. Direction comes from which version you are looking at, and neither is confirmed until price closes through the neckline.
What is the neckline of a head and shoulders pattern?
The neckline is the line joining the pullback low before the head to the pullback low after it. It can be flat or sloped. A close beyond it confirms the pattern, and the distance from the head to the neckline sets the measured target.
What is the most powerful pattern in trading?
No pattern is the most powerful in every market. Performance depends on the instrument, timeframe, rules and costs. Bulkowski's bull market ranking places the head and shoulders top 9 out of 36 patterns with downward breakouts, which is strong but not top of the list.
What are the top 10 trading patterns?
Ten chart patterns that appear on most lists are head and shoulders, inverse head and shoulders, double tops and bottoms, triple tops and bottoms, triangles, flags, pennants, wedges, rectangles, and cup and handle. Rankings vary by source. Learn a few well and test them on your own market instead of memorizing many.
How reliable is the head and shoulders pattern?
The evidence is mixed. Pattern-level base rates from Bulkowski look good, but strategy tests range from significant profits before simpler rules beat them, to consistent losses after slippage. Treat it as one input with a defined stop.
Does the neckline have to be horizontal?
No. Necklines can slope up or down, and Bulkowski found that horizontal necklines on tops performed only slightly better. A sloped neckline means the measured height depends on where you read it, so treat the target as a zone.
Head and Shoulders Trading Risk
This guide is education, not investment advice or a recommendation to trade any instrument. Futures are leveraged, losses can be larger than you expect, and a stop order does not guarantee your exit price in a fast market. Every price, risk budget and position size here is illustrative, not a record of a real trade or a promise of any result. Published pattern statistics come from specific markets and periods and may not carry over to yours. Simulated and funded account results are simulated and do not reflect live trading conditions. Test any rule on your own data before you risk money on it.


