



TL;DR: Day trading mistakes usually start as small edits to the plan after entry, such as a wider stop, a bigger size or one more trade. On a $50,000 practice account, widening an 8-point MES stop to 11 points turns a $480 loss into $660. Price each mistake in dollars and R, then fix the costliest one first. A written plan, a stop placed with the entry and a weekly rule-break log do most of the work.
Most accounts are not emptied by one terrible idea. They are emptied by a plan that made sense before the open and got renegotiated twenty minutes later, then again on Thursday.
If you are searching for day trading mistakes, you have probably read the list already: no plan, no stop, revenge trading. The harder question is which one is costing you money, and how much.
This guide prices every common mistake on the same illustrative account and the same position, so the costs can be compared directly. It also gives you a symptom table for finding your own mistake before you have a full journal.
What Day Trading Mistakes Cost on One Account
Day trading mistakes are easiest to compare when they hit the same account. The example used throughout this guide is an illustrative $50,000 practice account with a rule of risking 1% of the account per trade, so the risk budget is $500.
The instrument is the Micro E-mini S&P 500 futures contract (MES). CME Group's contract specifications set it at $5 times the S&P 500 Index, with a minimum tick of 0.25 index points worth $1.25. That makes every full index point worth $5 per contract.
The plan uses an 8-point stop, which is 32 ticks. Sizing it takes three steps.
- Risk per contract at an 8-point stop is 8 x $5 = $40.
- Contracts that fit a $500 budget are 500 / 40 = 12.5, rounded down to 12.
- Risk taken is 12 x $40 = $480, which is 0.96% of the account.
That $480 is 1R, the planned loss on one trade.
A price list of common day trading mistakes
This price list measures seven common day trading mistakes against the same $480 of planned risk on 12 MES contracts.
| Mistake | Cost on the $50,000 account | How you would catch it |
|---|---|---|
| Moving the stop from 8 to 11 points | $660 loss instead of $480, or 1.375R | Average realized loss above 1R |
| Sizing by feel at 20 contracts | $800 at risk, 1.6% of the account | Losses vary a lot while stop distance in points does not |
| Trading with no stop through a 25-point move | $1,500 loss, 3% of the account | Fills with no resting stop order in the order history |
| Averaging down and widening the stop | $1,260 loss, or 2.625R | Position size rising while the trade is red |
| Doubling size after a loss | $1,440 in two trades, 2.88% of the account | Bigger size within minutes of a loss |
| Chasing an entry 4 points late | Break-even win rate rises from 40% to 60% | Entries far from the planned level |
| Ignoring costs on a 1.5R target | Break-even win rate rises from 40% to 42% | No cost line in the trade log |
None of these rows looks dramatic on a single trade. That is the trap. The damage shows up when the same small edit repeats across a month of trades, and by then it feels like bad luck instead of a habit.
The price levels, account size and costs here are illustrative teaching numbers, not quotes or recommendations. Swap in your own instrument and account and the method still works.
Related lesson: Tick size and tick value
Why Beginners Repeat the Same Trading Mistakes
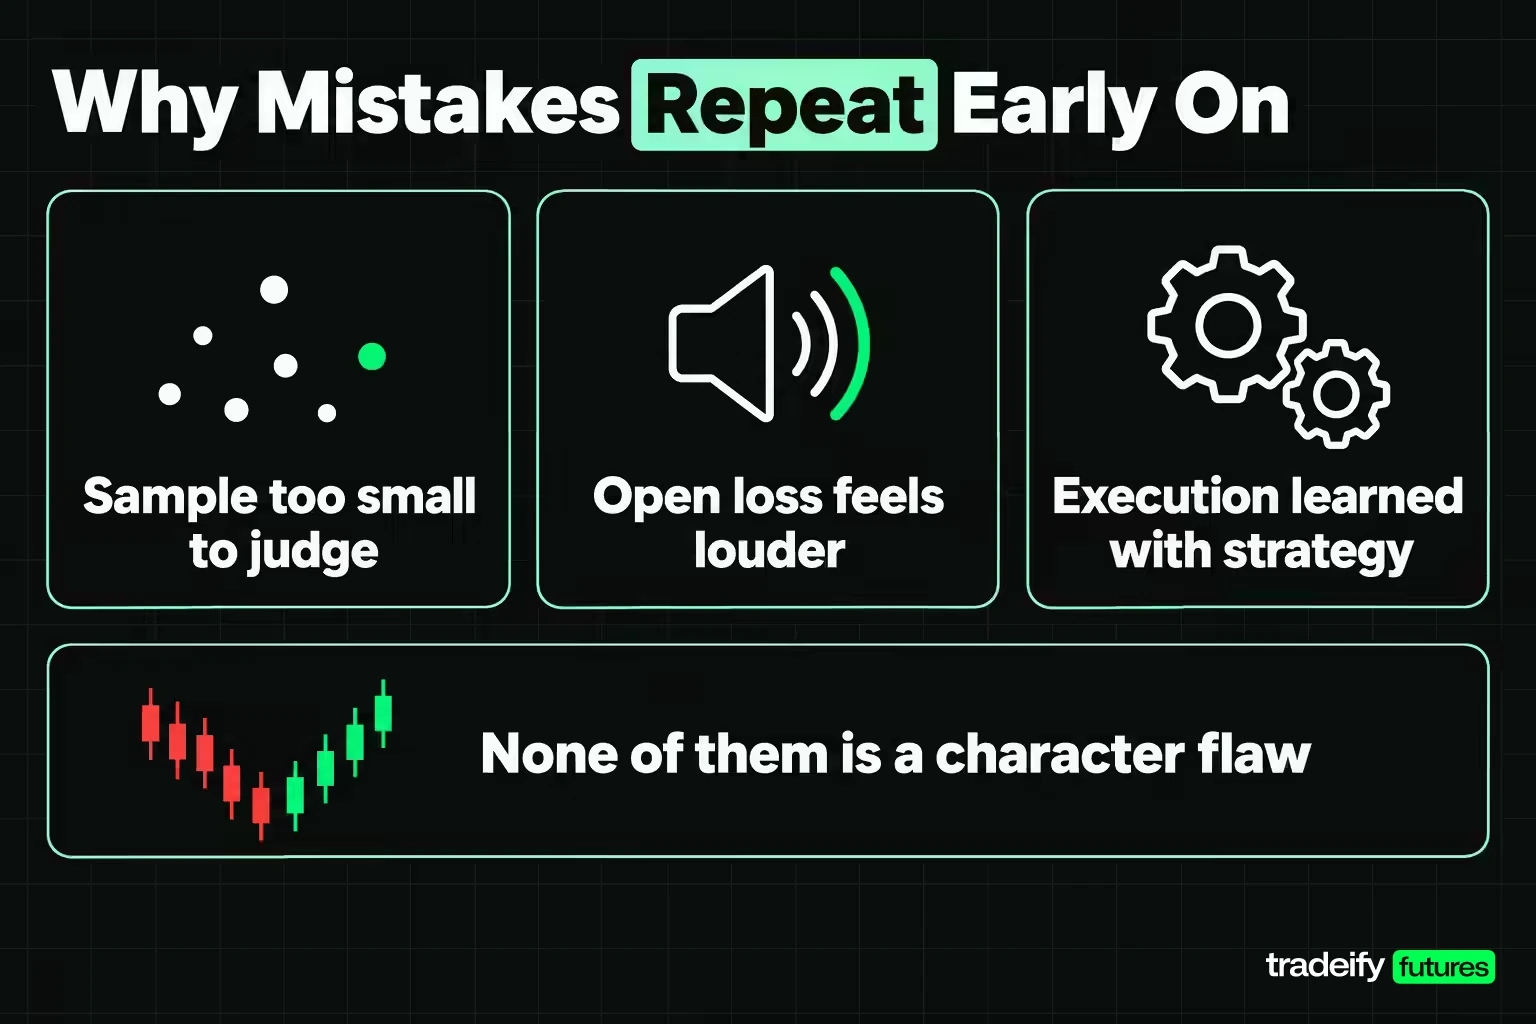
Beginners repeat the same trading mistakes because three things are true early on, and none of them is a character flaw.
The sample is too small to argue with. Ten trades can look like evidence and still be noise, so a trader who is down 3% cannot tell a broken plan from an ordinary losing streak. That uncertainty is exactly what makes an improvised change feel reasonable.
The position is louder than it is large. A $480 loss on a $50,000 account is 0.96% of capital, but it does not feel small while it is open and moving against you. Rules usually get broken not because they are wrong, but because they were written calmly and are being followed with a racing pulse.
Execution is learned at the same time as strategy. A trader can read direction well and still handle size, timing and stops badly for months. That is why the same mistake can show up in an account that is up on the month.
What the research on day trader outcomes shows
Two large studies of day trader outcomes and the SEC's investor site point the same way, and they are worth knowing before a short winning streak convinces you the odds do not apply.
- Chague, De-Losso and Giovannetti studied individuals who began day trading Brazilian equity index futures between 2013 and 2015. Of the 1,551 who kept at it for more than 300 days, 97% lost money net of fees, and only 1.1% earned more than the Brazilian minimum wage.
- Barber, Lee, Liu, Odean and Zhang used complete Taiwan Stock Exchange data from 1992 to 2006. More than 75% of day traders quit within two years, and less than 1% of the day trading population predictably earned profits.
- The SEC's Investor.gov glossary says it plainly: "Day trading is extremely risky and can result in substantial financial losses in a very short period of time."
These studies describe large groups over specific periods, not your next trade. They are still a fair reason to treat protecting capital as the first job and making money as the second.
Related lesson: Trading psychology
The No-Plan Mistake Behind Most Others
Trading without a written plan is the mistake that hides every other mistake. With no plan, there is nothing to compare a decision against, so a moved stop or an extra trade never registers as a break.
A first plan does not need to be long. It needs to answer, in numbers, the questions you would otherwise answer under pressure.
- Which instrument and which session you trade.
- What counts as a valid setup, in words specific enough that someone else could check it.
- Where the stop goes and how far that is in points and dollars.
- How many contracts that stop allows at your risk percentage.
- Where you take profit or how you trail.
- The daily loss number that ends your session.
- The maximum number of trades per day.
- When you review the plan, such as every 40 trades.
The test is simple. Before the order goes live, can you say the entry, the stop and the size out loud? If not, the trade is being planned while it happens.
Changing the rules mid-trade
A plan only works if it holds still long enough to be measured. The most common version of this mistake is editing the setup definition after a few losses, which restarts the sample before it can say anything.
Imagine a trader who changes their entry filter after every three losing trades. After 40 trades, they have tested a dozen strategies on three trades each and learned almost nothing about any of them. Pick a review point, such as every 40 trades, and only change the rules there.
Related lesson: Build your first trading plan
Position Sizing Mistakes and Sizing by Feel
Position sizing mistakes are the fastest way to turn a reasonable strategy into a large drawdown. Sizing by feel means the number of contracts comes from confidence, not from the stop distance and the risk budget.
On the illustrative $50,000 account with an 8-point MES stop, the formula gives 12 contracts and $480 of risk. A strong read tempts more size. At 20 contracts the same 8-point stop risks $800, which is 1.6% of the account. Add a 3-point stop adjustment and that becomes $1,100, or 2.2%.
The difference compounds across a normal losing streak.
| Ten losing trades | Total loss | Share of the account | Gain needed to recover |
|---|---|---|---|
| 12 contracts, 8-point stop | $4,800 | 9.6% | 10.6% |
| 20 contracts, 8-point stop | $8,000 | 16% | 19.0% |
| 20 contracts, stop widened to 11 points | $11,000 | 22% | 28.2% |
The recovery column is the part beginners underestimate. A loss of L% needs a gain of L / (1 - L) to get back to even, so the hole gets deeper faster than the loss itself.
Size comes from the stop, not the other way around. If the chart needs a wider stop, the size gets smaller.
Overleveraging with futures contracts
Overleveraging is a sizing mistake measured in exposure rather than in stop distance. A futures contract controls far more market value than the cash behind it, and the CFTC's Futures Market Basics warns that speculating in futures is rarely suitable for retail customers and that many lose all their money and can owe more than they invested.
At an illustrative S&P 500 level of 7,000, one MES contract controls 7,000 x $5 = $35,000 of index exposure.
- 12 contracts control $420,000, about 8.4 times the $50,000 account. A 1% index move of 70 points is $4,200, or 8.4% of the account.
- 20 contracts control $700,000, about 14 times the account. The same 1% move is $7,000, or 14%.
A stop limits the planned loss, but leverage decides how much damage a gap, a fast market or a missed stop can do. Keeping size modest is what keeps a bad fill survivable.
Related lesson: Position sizing
Stop-Loss Mistakes From No Stop to a Moving Stop
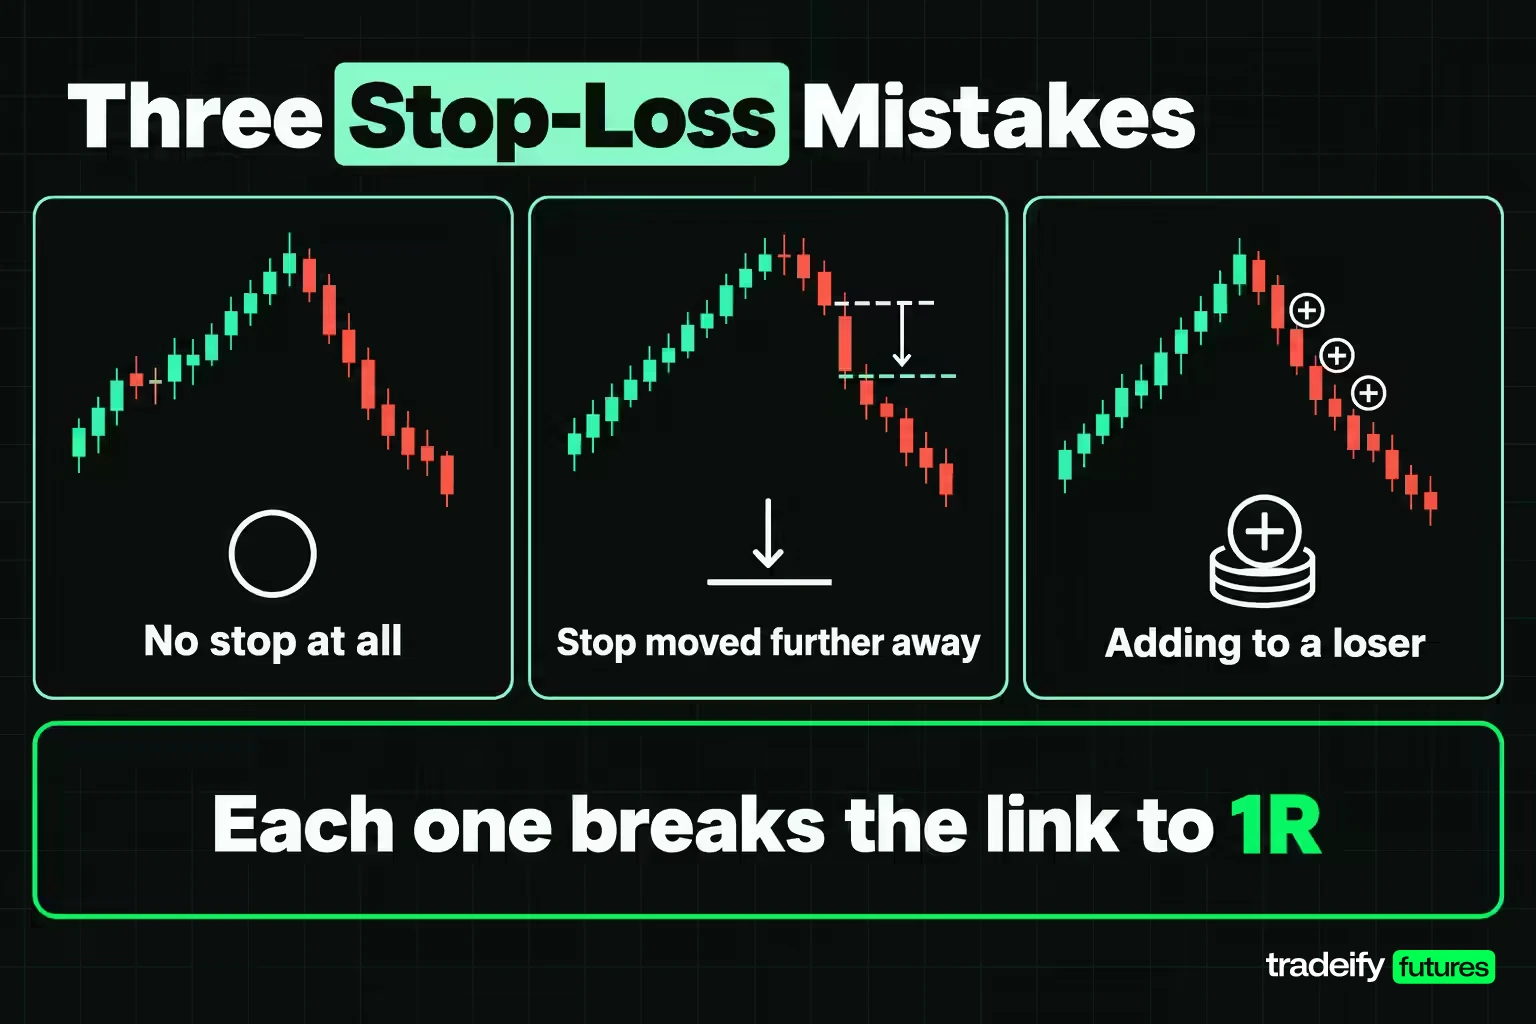
Stop-loss mistakes come in three forms: no stop at all, a stop that gets moved further away, and adding to a loser so the stop no longer matches the size. Each one breaks the link between the plan's 1R and the actual loss.
Trading without a stop leaves the loss open-ended for as long as it takes to decide. On the illustrative 12-contract MES position, a 25-point move against you is 12 x 25 x $5 = $1,500, which is 3% of a $50,000 account and 3.125R. A stop placed with the entry, as a bracket or linked order, removes that decision from the moment of stress.
Moving the stop is quieter. Price comes within 3 points of an 8-point stop and the trader gives it room to 11. The loss becomes 12 x 11 x $5 = $660 instead of $480, a 1.375R loss. Across ten losing trades that is $6,600 instead of $4,800, an extra $1,800 or 3.6% of the account, from an adjustment that felt like patience.
Stops are also not guaranteed prices. Investor.gov explains that when the stop price is reached, a stop order becomes a market order, so in a fast market the fill can land beyond the stop level. Plan for some slippage instead of assuming the exact number.
Averaging down into a losing trade
Averaging down means adding contracts to a position that is losing, hoping a better average price will rescue it. It feels like a discount. In practice it doubles the size at the moment the trade is proving the idea wrong.
Imagine a long of 12 MES at an illustrative 7,000 with a stop at 6,992. Price drops to 6,995, the trader buys 12 more and moves the stop down to 6,987. If the new stop fills:
- The first 12 contracts lose 13 points, or $780.
- The second 12 contracts lose 8 points, or $480.
- The total loss is $1,260, which is 2.625R and 2.52% of the account.
The plan allowed $480. The trade cost more than two and a half times that, and the only new information was that the idea was wrong. The rule that prevents this is short: never add to a losing position.
Related lesson: Stop-loss orders and placement
Emotional Trading Mistakes After Wins and Losses
Emotional trading mistakes are decisions driven by fear, greed or excitement rather than by the plan. Every trader feels those things, and feeling them is not the problem. The mistake is letting the feeling change a number after the plan is set.
Fear tends to show up as a late entry, a skipped valid setup after a loss, or a profit taken at half the target. Greed shows up as extra size after a good day, holding past the target, or one more trade when the daily goal is close. Both feel like judgment in the moment, which is why they need a rule that was written before the session.
A practical way to handle them is to name the trigger and attach a precommitted response.
- After a loss, wait a set time before the next entry, such as 15 minutes.
- After a big winning day, keep the next day's size the same as the formula says.
- After two losses in a row, stop for the session or drop to the smallest size.
Revenge trading after a loss
Revenge trading is entering quickly after a loss to win the money back. On the illustrative account, a $480 loss followed by a double-size re-entry of 24 contracts that also stops out at 8 points costs another $960. That is $1,440 in two trades, 2.88% of the account and 3R in one session.
The urge makes sense. The money feels like it was taken, and getting it back feels urgent. But a clean loss does not need a response. It needs the same risk on the next qualified setup.
Chasing moves and picking tops
Chasing is entering late because the move already started without you. Picking tops and bottoms is the opposite urge, trying to catch the exact turn before there is evidence of one. Both change the trade's math even when the direction is right.
Imagine a planned long at an illustrative 7,000 with a stop at 6,992 and a target at 7,012, a 1.5R trade that breaks even at a 40% win rate. Chase it at 7,004 with the same stop and target and the risk becomes 12 points for 8 points of reward. The break-even win rate jumps to 60%. Missing an entry does not make the next price a good entry. It makes it a different trade.
Following the crowd and social media calls
Following the herd means taking trades because a chat room, a feed or a popular account is in them. The problem is not that crowds are always wrong. It is that you inherit their entry with none of their stop, size or exit, and you usually arrive after the move.
If a trade idea from someone else does not fit your written setup, it is not your trade. Log any you take anyway as rule breaks.
Related lesson: Revenge trading
Risk-Reward and Cost Mistakes Beginners Miss
Risk-reward and cost mistakes are invisible on a single trade and decisive over a hundred. Ignoring risk-reward means not checking whether the target justifies the stop. Ignoring costs means calculating the edge as if commissions and fees did not exist.
Imagine a strategy that wins 45% of the time with a 1.5R target and a 1R loss. Its expectancy is 0.45 x 1.5 - 0.55 x 1 = 0.125R per trade. On the illustrative $480 risk, that is about $60 per trade, or $6,000 over 100 trades before costs.
Now let the trader move the stop on losers so they average 1.375R instead of 1R. Expectancy becomes 0.45 x 1.5 - 0.55 x 1.375 = -0.08125R. The same entries, the same win rate, and the strategy now loses about $39 per trade.
Costs push the same direction. At an illustrative round-turn cost of $2.00 per MES contract, 12 contracts cost $24 per trade, which is 0.05R. That lifts the break-even win rate on a 1.5R target from 40% to 42%, and it trims the 0.125R expectancy to 0.075R, or $3,600 over 100 trades instead of $6,000. Check your own platform's commission schedule rather than assuming this figure.
The fix is to write the target and the cost into the plan, then check the break-even win rate before trading a setup. A setup you cannot win often enough to cover its cost is not a setup yet.
Related lesson: Risk-reward ratio
Indicator, Timeframe and News Mistakes
Indicator, timeframe and news mistakes are analysis errors rather than discipline errors, but they cost money the same way. Each one gives the trader false confidence about an entry.
Misusing technical indicators
The common indicator mistake is stacking several tools that are all calculated from the same price data and treating their agreement as confirmation. RSI, MACD and a moving average built from the same closes are not three independent opinions. When price is trapped in the middle of a range, adding another indicator does not create direction.
Learn what one indicator measures and when it fails, then decide what role it plays in the plan. A filter should remove a recurring failure found in your trades, not make the chart look busier.
Trading the wrong timeframe
A timeframe mistake is a mismatch between the chart and the plan. A trader who reads a setup on a daily chart and enters off a one-minute chart with a tight stop is trading two different strategies at once. The daily idea may be right while the one-minute stop gets hit by ordinary noise.
Choose the timeframe that defines the setup, and set the stop and target in that timeframe's terms. A lower timeframe can refine the entry, but it should not shrink the stop below what the setup needs.
Trading into scheduled news
News trading becomes a mistake when the entry is a guess placed seconds before a scheduled release. The Bureau of Labor Statistics publishes the Consumer Price Index at 8:30 AM ET, and moves around releases like that can be fast enough that stops fill beyond their level and spreads widen.
If your plan does not cover news, write a rule that keeps you flat or out of new entries for a set window around major scheduled releases. If it does cover news, size for the wider stop and expect slippage. Earnings reports create the same problem for stock traders.
Skipping Simulation Practice, a Costly Beginner Mistake
Skipping simulation practice means taking a strategy to real money before it has been run on a practice or demo account. It saves a few weeks and usually costs more than that in avoidable errors.
Practice is where execution mistakes are cheap. Typing the wrong quantity, forgetting to attach a stop, clicking buy instead of sell and misreading the contract month are all common in a trader's first weeks. They teach the same lesson in simulation as they do with money, at a far lower price.
Simulation has limits worth stating plainly. Fills can be friendlier than a live market, especially for limit orders that are only touched, and the emotional weight of a practice loss is lighter. That is why good practice results are a minimum bar, not proof.
A reasonable test for leaving practice:
- At least 40 trades on one written setup.
- No entries without a stop attached.
- Average realized loss at or under 1R.
- Size matches the formula on every trade.
If those hold for 40 trades, the plan is ready to be tested with small size. If not, the practice account just found the mistake for free.
Related lesson: Practice with paper trading
Not Keeping a Trading Journal
Not keeping a trading journal is the mistake that keeps all the others unnamed. Without a record, a trader cannot say which setup works, which hour loses, or whether losses are bigger than planned.
A minimum journal entry holds the date and time, the setup name, planned entry, stop, target and size, actual entry, exit and size, the result in dollars and R, and one line on whether any rule was broken. That last field matters most. Count a rule break even when the trade made money, because a profitable trade outside the plan still distorts the sample.
A journal also exposes patterns a trader cannot feel. Imagine a log that shows mornings averaging +$400 a day while afternoons average -$250. Over 20 sessions, the afternoon habit costs about $5,000 a month, and the trader never sees it without the split.
An eight-week mistake cost log
Until a full journal is running, a weekly log is enough to rank your mistakes by dollars. Fill it in once a week, not after every trade.
| Week | Rule breaks counted | Dollars from breaks | Share of a $50,000 account | Change for next week |
|---|---|---|---|---|
| Worked example | Moved the stop on 3 trades | 3 x $180 = $540 | 1.08% | Stop placed with the entry |
| 1 to 4 | Count each break by type | Price each break against 1R | Divide by the account | One change only |
| 5 | Rank break types by total dollars | Total by type | Total by type | Pick the costliest type |
| 6 to 8 | Track only the chosen fix | Dollars from that type | Compare with week 1 | Keep the fix, change nothing else |
Converting a mistake to dollars changes how it feels. A $180 slip is easy to tolerate once, and much harder to tolerate as $1,800 across ten trades.
Related lesson: How to keep a trading journal
How to Find Your Own Day Trading Mistake
Finding your own day trading mistake is faster when you start from the symptom you can already see. The table pairs common symptoms with the two checks that usually explain them. Two traders with the same symptom can have opposite problems, so the check matters more than the symptom.
| What you are seeing | Check this first | If that is clean, check this |
|---|---|---|
| Account drifts down with no single big loss | Average realized loss against planned risk; above 1R means stop moves | Trades per day against the plan's maximum |
| Losing days are bigger than winning days | Size used per trade against the size the formula gives | Trades taken soon after a loss in the same session |
| Fine in practice, worse with money | Fill prices against planned levels, in ticks, for 20 trades | Whether the size typed in matched the plan |
| One setup works and the account still does not | Profit and trade count per setup over 40 trades | Whether unplanned trades sit in the same total |
| High trade count and flat results | Trades per session against the plan | Profit by hour of the session |
| A big week followed by a giving-back week | Size changes after a strong day, in dollars | Whether the bigger size came from the formula or from confidence |
| Stop always hit just before price turns | Distance from the stop to the nearest obvious level | Typical adverse move on winning trades |
Run one check at a time and give it at least 20 trades. A check that changes between Monday and Wednesday is a new variable, not a fix.
FAQ About Day Trading Mistakes
What is the biggest mistake day traders make?
The biggest mistake is the one that costs you the most dollars, which is usually not the most dramatic one. For a trader who widens stops, it is the stop move; for one who sizes up after wins, it is position size. Rank your own mistakes by dollars in a weekly log before deciding.
Is it true that 97% of day traders lose money?
It is true for one well-known sample, not as a universal law. In a study by Chague, De-Losso and Giovannetti of Brazilian equity index futures day traders, 97% of the 1,551 who persisted more than 300 days lost money net of fees. Other research, including Taiwan data where less than 1% predictably earned profits, points the same way.
What is the 3-5-7 rule in trading?
The 3-5-7 rule is an informal heuristic that limits risk to 3% per trade and 5% across all open positions, and aims for winners at least 7% larger than losers. It is not a regulation, and versions differ. On a $50,000 account that allows $1,500 per trade, and ten straight 3% losses leave the account down 26.3%, needing 35.6% to recover, compared with 9.6% down and 10.6% to recover at 1%.
How did one trader make $2.4 million in 28 minutes?
Fortune reported that in March 2015 an options trader bought about $110,000 of out-of-the-money Altera call options one second after a Dow Jones headline about Intel deal talks. The shares jumped 28% when trading reopened, and the options gained just over $2.4 million in value within 28 minutes. Fortune suggested a computer, not a person, placed the trade, and it is a single outlier rather than a template for beginners.
What are the 7 biggest mistakes investors are making right now?
There is no fixed list of seven, but trading too often, ignoring costs and following the crowd appear on most investor mistake lists. Those lists are usually written for long-term investors, and the "right now" items change with the news. The difference is speed, since a day trader can repeat a mistake ten times in the week it takes an investor to make it once.
How long does it take to fix a trading mistake?
Fixing a trading mistake usually takes weeks, not days, because you need enough occurrences to see a difference. Twenty to forty trades with the fix in place is a reasonable first sample. Track the rule-break count weekly, and change only one rule at a time so you can tell what worked.
Can trading smaller stop these mistakes?
Trading smaller cuts the cost of each mistake but does not stop the behavior. Ten 1R losses at 12 contracts cost $4,800 versus $8,000 at 20, so smaller is clearly better. Treat size as the first control and the habit as the thing still to fix.
How to Stop Repeating Trading Mistakes
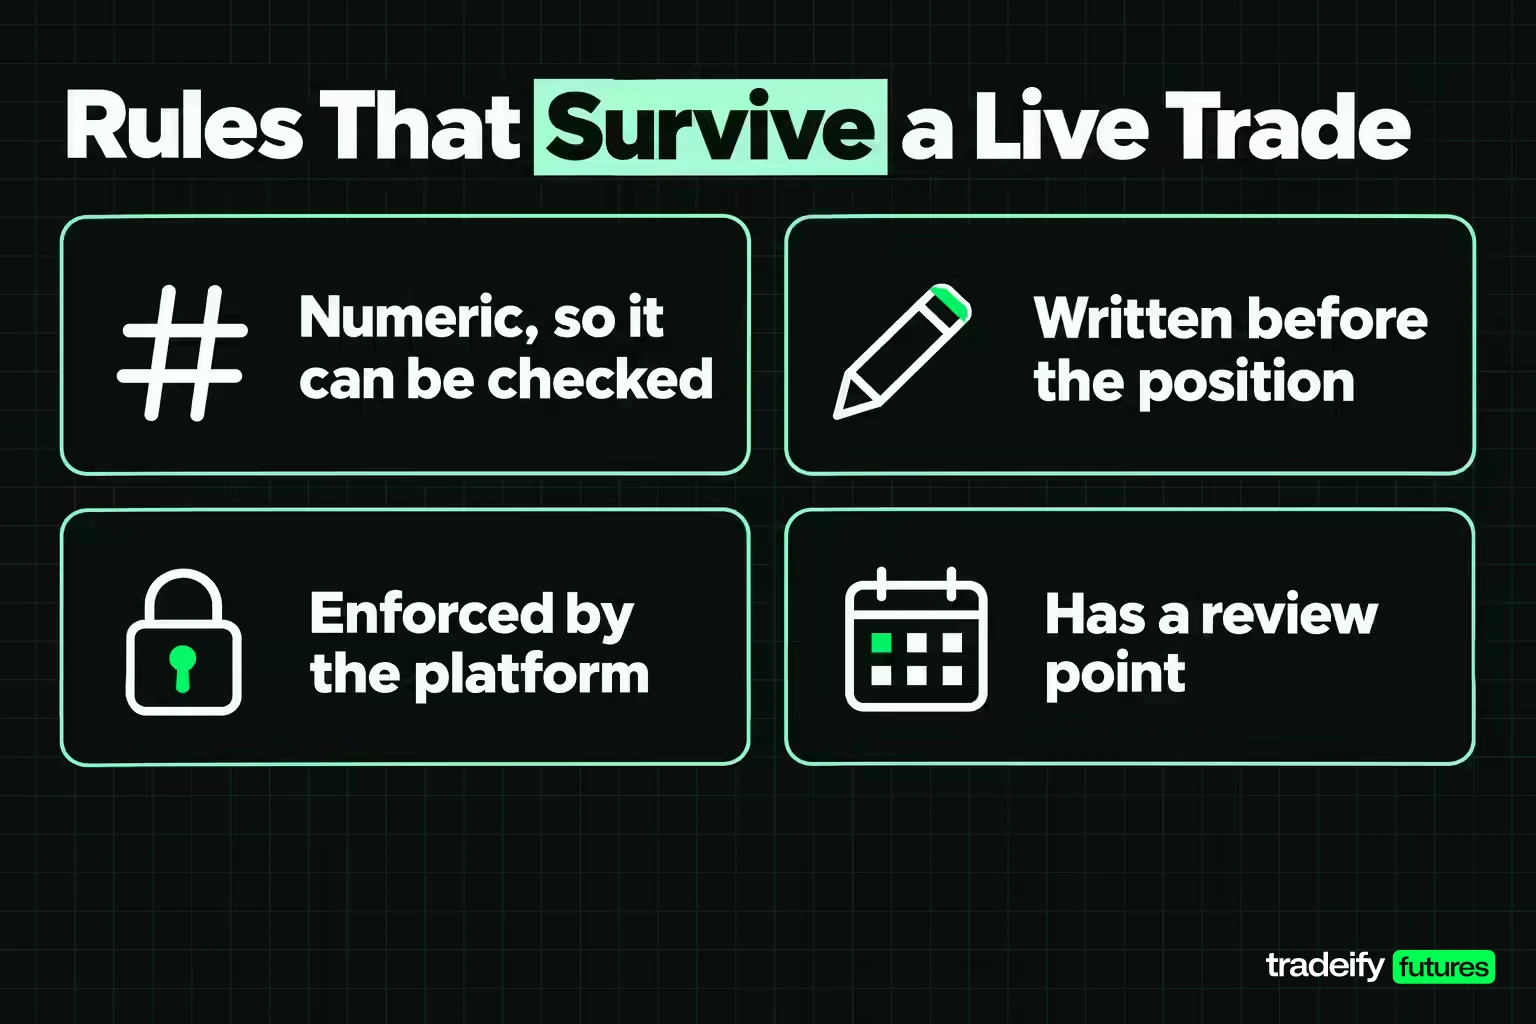
Stopping repeated trading mistakes is mostly a matter of moving decisions out of the live trade. Rules that survive an open position tend to share four properties.
- They are numeric, so they can be checked rather than debated.
- They are precommitted, written before the position exists.
- They are enforced by the platform where possible, through bracket orders, personal loss limits and lockouts rather than willpower.
- They have a review point, so a rule changes after a measured sample rather than during a losing afternoon.
In practice that means a stop placed with the entry, a size typed fresh into the ticket instead of inherited from the last order, one setup traded until it has a sample, a hard stop time for the session and a daily loss number that ends trading rather than starting a negotiation.
On our accounts, the Growth evaluation daily loss limit is a soft breach. Hitting it puts the account in liquidation-only until the next trading day, and our Help Center says it should never be used as a stop. Tradovate's personal risk settings and Tradesea's lockout timer can enforce a lower limit of your own, and every position must be flat by 4:45 PM ET, so there is no overnight hold to wait out a loser. Evaluation and Sim Funded accounts are simulated.
Progress on trading mistakes is unglamorous. Fewer trades, steady size, the same setup for longer, and a record that shows whether any of it helped. Fixing the single most expensive row in your log over the next month will usually do more than a new indicator.
Related lesson: Daily and weekly loss limits
This article is educational and is not investment advice. Futures are leveraged, and losses can build faster than expected and exceed what a stop was meant to limit. All account sizes, prices, costs and calculations are illustrative. Evaluation and funded accounts at prop firms are simulated, and practice results do not predict live results. Only trade with money you can afford to lose.


