




TL;DR: Trend trading forex means trading in the direction of a sustained currency move rather than calling tops and bottoms. Confirm the trend with swing structure first, then use a moving average or ADX above 20 as a filter, not a trigger. Enter on a planned pullback or breakout, put the stop where the idea is wrong, and size the position from that stop. Stand aside when swings overlap, the stop is too wide, or the next obstacle is too close.
A currency pair can push in one direction for hours, days or months. Spotting that direction on a chart is the easy part. The hard part is deciding whether the move is established, whether the current price is a sensible place to join it, and where the idea stops being valid.
Most trend trading mistakes come from skipping one of those three questions. Buying a pair because it "looks strong" after a long run feels safe, and it can mean paying the worst price of the move. Treating every pullback as a reversal can push you out of a sound position early. A written trend process replaces both reactions with conditions you can check before any money is at risk.
What Is Trend Trading in Forex
Trend trading in forex is a strategy that takes positions in the direction of a sustained move in a currency pair. In an uptrend, a trend trader looks for chances to buy. In a downtrend, the same trader looks for chances to sell. When the pair is moving sideways, the trend trader mostly waits.
The approach does not try to catch the first pip or the last one. Its aim is to capture part of the middle of a move while the evidence still favours continuation. That is the key difference from reversal trading, which tries to act near a turning point, and from range trading, which buys and sells between established boundaries.
Trend trading accepts a specific tradeoff. Because entries come after the move has started, you give up the very best prices, and that is by design. In return, you trade with the prevailing order flow instead of against it, and you can define a clear point where the trend idea is wrong.
Charles Dow's work on market trends, later organized into Dow Theory, rests on the same idea: identify the broad underlying move and trade with it, while recognizing that shorter swings against it are normal. A trend trader in currencies applies that logic to pairs such as EUR/USD, GBP/USD or USD/JPY.
Trend trading usually pays off through a small number of large moves rather than a high hit rate. Many trend systems lose more often than they win and still come out ahead on paper, because the winning trades run several times further than the stops on the losing ones. Whether a given system actually does that has to be checked on a meaningful sample, not assumed.
Related lesson: Trend following basics
Forex Trend Types and How Long They Last
A forex trend is a persistent direction in price, defined by the sequence of swing highs and swing lows the pair prints. There are three basic trend types:
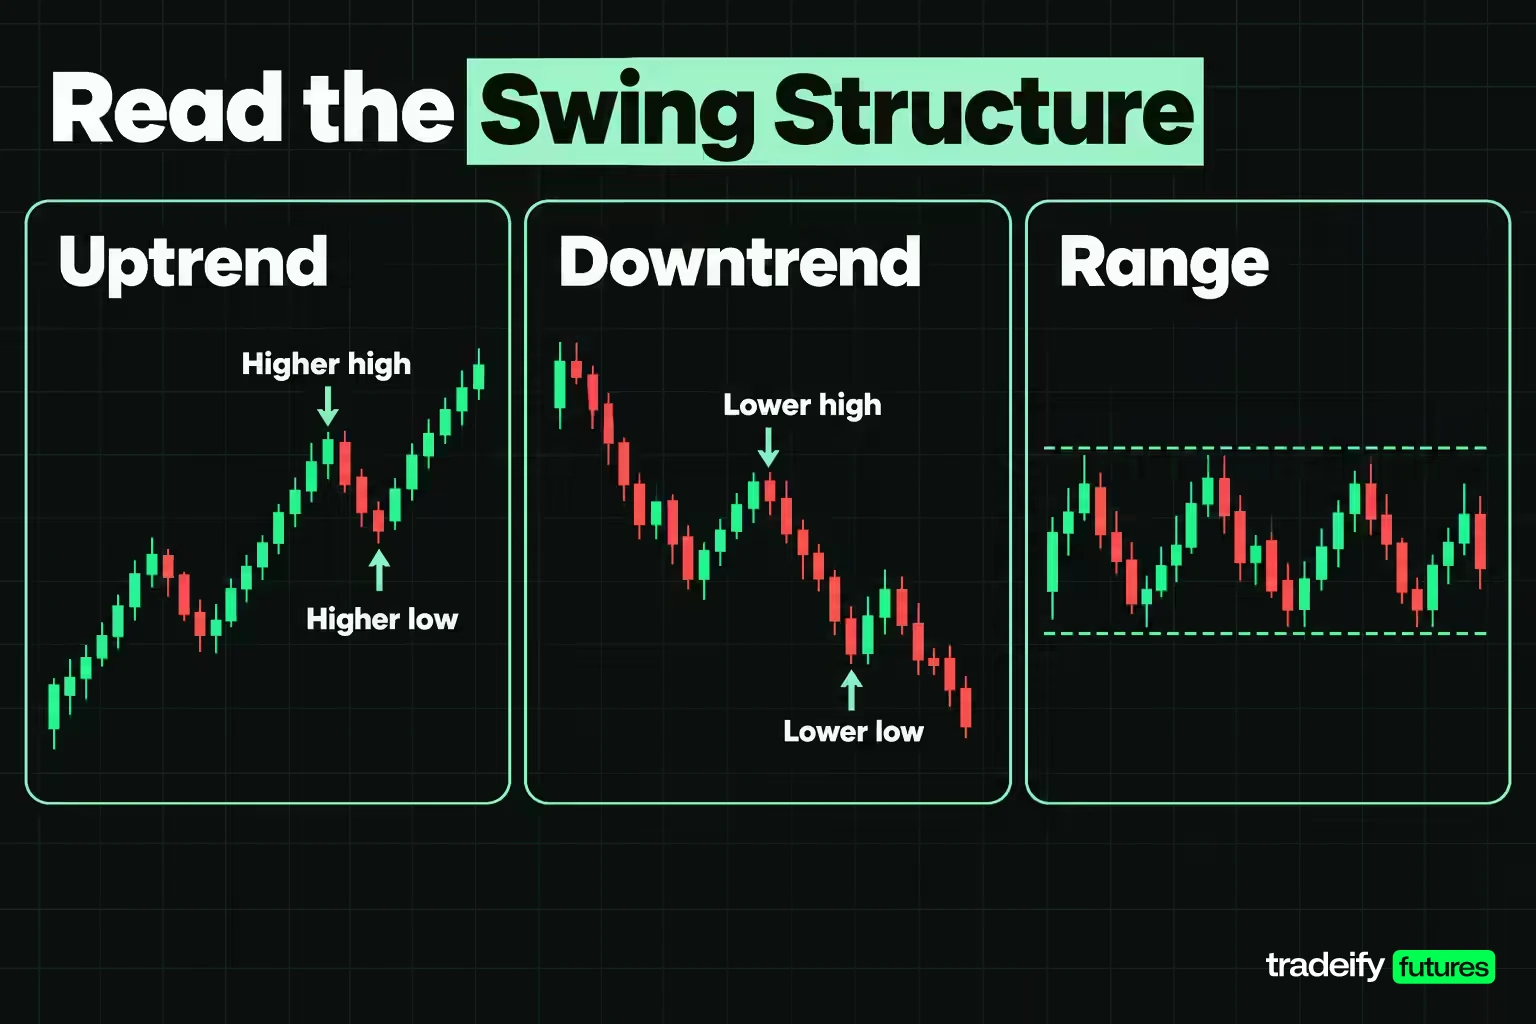
- Uptrend: price makes higher swing highs and higher swing lows. Each pullback stops above the previous low.
- Downtrend: price makes lower swing highs and lower swing lows. Each bounce fails under the previous high.
- Sideways or range: swings overlap without a clear sequence, and price rotates between rough support and resistance.
Trends also come in layers. Dow Theory separates three kinds of movement. Primary moves can last from a few months to many years and represent the broad trend. Secondary moves, also called reactions, can last from a few weeks to a few months and run against the primary trend. Daily fluctuations last from a few hours to a few days and can go either way.
That layering explains a common source of confusion in currency trading. EUR/USD can be in a primary uptrend on the weekly chart, in a secondary pullback on the daily chart, and in a short-term downtrend on the one-hour chart, all at once. None of those readings is wrong. They describe different timeframes.
The practical consequence is simple. Before you call a forex trend up or down, name the timeframe you are reading. A trade plan that says "the trend is up" without saying on which chart leaves room to justify almost any entry after the fact.
Related lesson: Market structure and trends
How to Identify a Forex Trend on the Chart
Identifying a forex trend starts with price structure, because every indicator is ultimately a calculation on price. The goal is to answer one question: is this pair making progress in one direction, or rotating?
Read forex swing highs and swing lows
Mark only the obvious swing points, the ones you could see without zooming into individual candles. Then read the sequence:
- Higher highs and higher lows point to an uptrend.
- Lower highs and lower lows point to a downtrend.
- Overlapping, alternating swings point to a range or a transition.
If two reasonable traders would mark completely different swing points on the same chart, the structure is probably not clean enough to support a trend trade. That uncertainty is useful information. It usually means waiting, which is a decision too.
A pullback does not end a trend by itself. In an uptrend, the test is whether price holds above the most recent meaningful swing low and then resumes higher. In a downtrend, the test is whether price stays under the most recent meaningful swing high and resumes lower.
Draw forex trendlines and channels
A trendline connects at least two swing lows in an uptrend or two swing highs in a downtrend. A third touch that holds adds confidence, because it shows other traders reacting to the same slope. A parallel line drawn off the opposite swings creates a channel, which helps you see when price is stretched toward the far edge of its normal path.
Trendlines are judgment calls. Small changes in which wicks you connect can move the line. Treat a trendline break as a warning to re-check structure, not as automatic proof that the trend has reversed.
Confirm forex trend direction with price behaviour
Strong trends tend to show clean pushes in the trend direction and shallow, overlapping pullbacks against it. Weak or ending trends tend to show the reverse: hesitant pushes, deep pullbacks and repeated failed attempts to make new extremes. Reading that behaviour takes practice, which is one reason to study historical charts before trading a pair live.
Related lesson: Trendlines and channels
Moving Averages for Forex Trend Direction
A moving average smooths price into a single line so you can see direction without reacting to every candle. It defines the current direction; it does not predict the next one. Because it is built from past prices, every moving average lags, and longer averages lag more.
Forex traders use moving averages for trend work in three main ways.
Moving average slope and price position
The simplest filter combines two observations. Price above a rising average supports a bullish reading. Price below a falling average supports a bearish reading. Price whipping back and forth across a flat average usually means no trend worth trading on that timeframe.
Simple vs exponential moving averages
A simple moving average (SMA) weights every period equally. An exponential moving average (EMA) gives more weight to recent prices, so it lags less and turns sooner. That sensitivity is a double-edged trait. An EMA reacts faster when a new trend starts, and it also reacts faster to noise. Neither type is better in general; the right one depends on whether you want earlier signals or fewer false ones.
Moving average crossovers
A double crossover uses one shorter and one longer average. When the shorter average crosses above the longer one, many traders call it a golden cross. When it crosses below, they call it a death cross. A system using a 5-day EMA and a 35-day EMA is a short-term system, while one using the 50-day SMA and 200-day SMA is medium to long term.
Crossovers produce late signals because they combine two lagging lines. They tend to work well once a strong trend takes hold and produce many whipsaws when the market moves sideways. That is why many trend traders use a moving average as a direction filter that confirms swing structure, rather than as a stand-alone entry trigger.
Related lesson: Moving average crossovers
Trend Indicators That Measure Strength and Momentum
Trend indicators answer different questions. Some estimate direction, some estimate strength, and some estimate volatility. Knowing which question a tool answers is most of the skill. Stacking three tools that answer the same question adds confidence you have not earned. Picking one tool for each question gives you independent evidence.
ADX for forex trend strength
The Average Directional Index (ADX) was introduced by J. Welles Wilder in his 1978 book New Concepts in Technical Trading Systems. ADX measures how strong a trend is, regardless of direction. Two companion lines, +DI and -DI, show direction: when +DI is above -DI the bulls have the edge, and when -DI is above +DI the bears do.
The default setting is 14 periods. Wilder treated an ADX reading above 25 as a strong trend and below 20 as no trend, with a gray zone between 20 and 25. Many analysts simply use 20 as the dividing line. ADX lags because of its heavy smoothing, so it tends to confirm a trend after it has started rather than flag it early.
MACD for forex trend momentum
The MACD, developed by Gerald Appel in the late 1970s, subtracts a 26-period EMA from a 12-period EMA. A 9-period EMA of that difference forms the signal line, giving the standard 12, 26, 9 setting. When MACD sits above zero, the shorter average is above the longer one and upside momentum is in control. MACD has no upper or lower bound, so it is not built to flag overbought or oversold conditions.
RSI inside a forex trend
The Relative Strength Index (RSI), also from Wilder, runs from 0 to 100 on a default 14-period setting. Readings above 70 are commonly called overbought and below 30 oversold. In a trend, those labels can mislead. Technical analyst Constance Brown observed that RSI tends to stay between 40 and 90 in an uptrend, with the 40 to 50 zone acting as support. A trend trader can use that behaviour to judge whether a pullback still looks like an uptrend pause or something deeper.
ATR for forex trend volatility
Average True Range (ATR), another Wilder tool, measures how far price typically travels per bar. It says nothing about direction. It is typically calculated over 14 periods and works on intraday, daily or weekly charts. Trend traders use ATR mostly for stops and position size, because it shows whether a planned stop sits inside the pair's normal noise.
Forex trend indicator comparison
| Indicator | Question it answers | Common setting | Main limitation |
|---|---|---|---|
| Moving average | Which way is price leaning | 20, 50 or 200 periods | Lags and whipsaws in ranges |
| ADX with +DI and -DI | Is there a trend, and how strong | 14 periods, 20 to 25 threshold | Slow to confirm, no entry timing |
| MACD | Is momentum building or fading | 12, 26, 9 | Unbounded, late at turns |
| RSI | How deep is the pullback within the trend | 14 periods | Overbought labels fail in strong trends |
| ATR | How much does the pair move per bar | 14 periods | Gives no direction |
No indicator reliably identifies every forex trend in advance. The useful combination is one structure read, one direction filter and one volatility measure, all on the same decision timeframe.
Related lesson: ADX indicator
Forex Trend Trading Strategies
A trend strategy is a written rule for where to enter, where to be wrong and how to exit within a trend. Most forex trend strategies fall into four families. Choose one and test it, rather than switching families after the chart moves.
Pullback strategy
A pullback strategy waits for price to retrace against the trend and then show signs of resuming. Typical entry areas include a prior breakout level, a rising moving average or the lower edge of a trend channel. The trigger might be a candle closing back in the trend direction or a break of the small pullback structure.
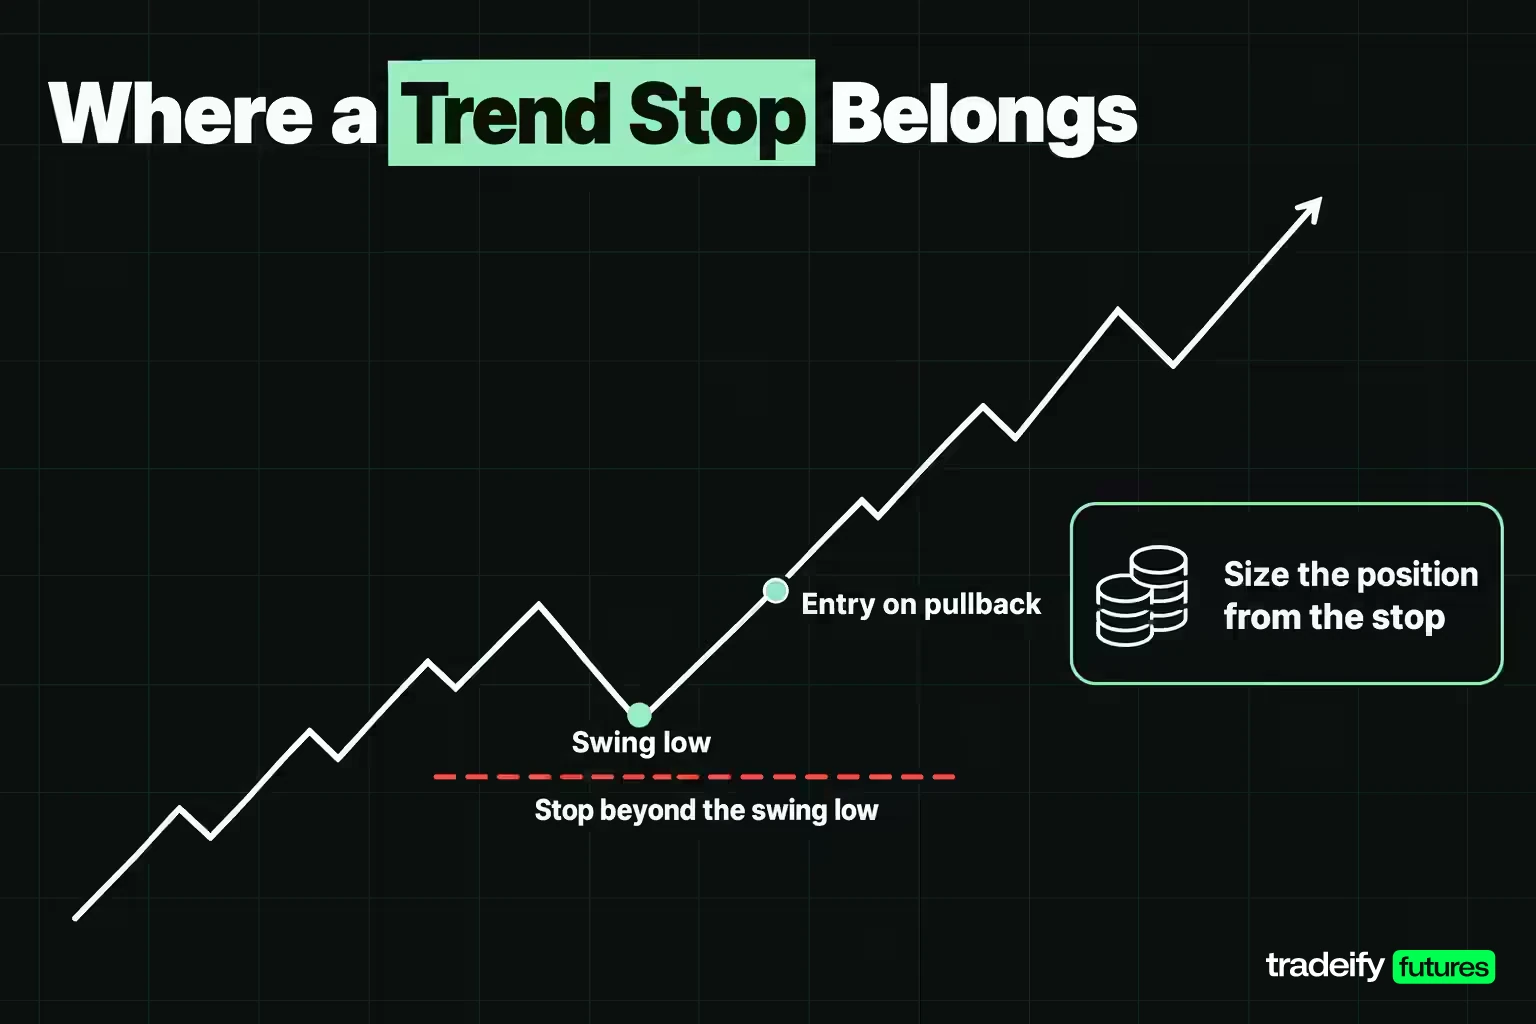
The main benefit is a nearby invalidation point: the stop goes beyond the pullback's swing low in an uptrend or its swing high in a downtrend. The cost is that some strong trends never pull back far enough to trigger an entry, so you miss them.
Breakout strategy
A breakout strategy enters when price clears a defined swing high, swing low or consolidation boundary in the trend direction. It gets you in quickly when a trend accelerates. False breakouts are its main failure mode, especially when the level was obvious to everyone and liquidity sits just beyond it. A rule such as requiring a close beyond the level, or waiting for a retest, can filter some of those failures at the price of a later entry.
Moving average trend-following strategy
A classic trend-following rule goes long when a shorter moving average crosses above a longer one and exits or reverses on the opposite cross. It is mechanical and easy to test. It also accepts long strings of small losses in sideways markets, waiting for the occasional extended trend to pay for them. The honest difficulty is not the rule, it is sticking with it. A trader who abandons the system after five whipsaws never gets to the trend it was built for.
Channel and trailing-stop strategy
Some trend traders care less about the entry and more about staying in. They enter on a channel break or crossover and then trail a stop behind the trend. The Chandelier Exit, developed by Charles Le Beau, is one example: on its default setting it hangs a long exit three times ATR under the highest high of the last 22 periods. As the trend extends, the stop rises with it.
Illustratively, if the 22-period high on EUR/USD were 1.1100 and the 22-period ATR were 25 pips, the long Chandelier Exit would sit at 1.1025, 75 pips under that high.
Forex trend exits
Every trend strategy needs an exit rule as specific as its entry rule. Common choices are a fixed objective at the next major obstacle, a trailing stop behind new swings, an ATR-based trail, an indicator exit or a time stop. A fixed objective banks gains before a reversal but caps an unusually strong run. A trailing exit can stay with a large trend but gives back open profit during normal pullbacks. Pick one before entry and judge it over many trades, not on the trade that is currently winning.
Chart Patterns Inside a Forex Trend
Chart patterns are recurring shapes in price that help a trend trader read whether a pause is likely to resolve with the trend or against it. They are descriptions of behaviour, not guarantees.
Continuation patterns in a forex trend
- Flags and pennants: a sharp move (the pole) followed by a short, tight pause that drifts slightly against the trend. A break out of the pause in the trend direction suggests continuation.
- Triangles: converging swing highs and lows during a pause. In a trend, a break in the trend direction is the continuation read; a break the other way is a warning.
- Channels: parallel trendlines containing the trend. Pullbacks to the lower line of a rising channel offer a defined area to look for entries.
Reversal patterns at the end of a forex trend
- Double top or double bottom: two failed attempts at the same extreme, followed by a break of the swing in between.
- Head and shoulders: a higher high (the head) between two lower highs (the shoulders), followed by a break of the neckline. Its inverse marks potential bottoms.
The trend trading use of patterns is mostly defensive. A continuation pattern can time an entry with a defined stop on the other side of the pattern. A reversal pattern forming in your trade direction is a reason to tighten your exit or stop adding, not necessarily to flip your position. Patterns that look clean in hindsight are often ambiguous in real time, so write down what completes the pattern before you act on it.
Choosing Timeframes for a Forex Trend
There is no single best timeframe for trend trading forex. The right one depends on how much time you can watch the market, how much noise you can tolerate and how large a stop your risk limit allows.
Higher timeframes, such as the daily or four-hour chart, generally produce fewer signals, wider stops and less sensitivity to short-term spread spikes. Lower timeframes, such as the 15-minute or five-minute chart, produce more decisions, tighter stops and much greater sensitivity to costs, news spikes and execution.
Multi-timeframe trend alignment
Many trend traders use three charts with distinct jobs:
- A higher timeframe sets the direction you are allowed to trade.
- A decision timeframe defines the setup, the stop and the objective.
- A lower timeframe, if used at all, only refines the entry.
One illustrative combination is a daily chart for direction, a four-hour chart for setups and a one-hour chart for timing. The rule that matters is consistency: if the daily chart sets the direction, a dip on the five-minute chart is not a reason to exit a trade planned on the four-hour chart.
London and New York sessions for forex trend timing
Spot forex trades around the clock from Sunday evening to Friday afternoon New York time, but activity is uneven. The London and New York overlap, 8:00 AM to 12:00 PM ET, is the window when both major centres are open. Intraday trend traders often focus on active sessions because quiet hours tend to produce drifting, overlapping price action. Swing and position traders face a different issue: holding a multi-day trend trade means accepting weekend gap risk, when price can reopen away from the stop.
Related lesson: Multiple timeframe analysis
Risk Control for Forex Trend Trades
Risk control in trend trading starts from a different assumption than many beginners expect. Trend systems often have modest win rates and depend on a few large winners. That only works if the losing trades stay small and the position size stays consistent.
Placing a forex trend stop
A trend trade stop belongs where the trend idea is invalid, not at a round number or a dollar amount you can live with. In an uptrend, that usually means beyond the swing low that the pullback should respect. In a downtrend, beyond the swing high.
ATR helps check whether that stop is realistic. If the four-hour ATR on a pair were 25 pips, a stop only 10 pips from entry would sit inside one ordinary bar's movement. Some traders place stops at a multiple of ATR, such as 1.5 times ATR, which would be 37.5 pips in that illustrative case. The structural level and the ATR check should agree; if they don't, the setup may not fit your risk limit.
Sizing a forex trend position from the stop
Position size comes after the stop, never before. The formula is the planned dollar risk divided by the stop distance in pips times the pip value per unit. On EUR/USD, one pip (0.0001) is worth $10 on a standard lot of 100,000 units and $1 on 10,000 units.
With an illustrative $100 risk limit and a 40-pip stop, the position needs a pip value of $2.50, which is 25,000 units. A tighter stop allows more units for the same risk; it does not allow more risk.
Leverage is not the same as risk
US retail forex rules cap leverage at 2 percent margin on major pairs and 5 percent on other pairs, according to the CFTC. A 2 percent margin means a $100,000 position can be opened with $2,000. That margin figure tells you what the dealer holds as a deposit. It does not tell you what you can lose. The CFTC warns that losses can exceed the deposit if the market moves sharply against you.
Size from the stop and your risk limit first. Then check that the margin required fits the account. Never work in the other direction, from available margin to position size.
Win rate, reward and losing streaks
The break-even win rate for a strategy equals 1 divided by (1 + the reward-to-risk ratio). At 2.0 to 1, a strategy breaks even at a 33.3% win rate before costs. At 1.89 to 1, the break-even rate rises to 34.6%.
Consider a hypothetical system that wins 40% of the time at a 2R average win. Its expectancy is 0.4 times 2 minus 0.6 times 1, or 0.2R per trade before costs. The same system loses 60% of the time, so any given run of five trades has a 7.8% chance of being five straight losses. Across hundreds of trades, losing streaks are close to certain. The temptation after the fourth loss is to tighten the stop, double the size or switch strategies. A trend trader who has not planned for streaks tends to change the rules at exactly the wrong moment.
Related lesson: Position sizing in forex
A Worked EUR/USD Trend Trade Example
This hypothetical example uses round, illustrative prices to walk one trend trade from structure to exit. It is not a current market view.
Forex trend setup on the EUR/USD four-hour chart
EUR/USD shows higher swing highs and higher swing lows on the four-hour chart, and price is above a rising 50-period moving average. The daily chart leans the same way. Price pulls back toward a prior breakout area near 1.1000, with RSI easing into the 40 to 50 zone instead of collapsing. A four-hour candle then closes back higher out of the pullback.
The plan is set before the order goes in:
- Entry: 1.1000, after the confirmation candle closes.
- Stop: 1.0960, under the pullback swing low, so the stop distance is 40 pips.
- Objective: 1.1080, just under the next marked resistance, an 80-pip objective distance.
- Maximum planned risk: $100.
Forex trend position size and margin
The reward-to-risk ratio is 80 pips divided by 40 pips, which equals 2.0 to 1 before costs. Dividing $100 by 40 pips gives $2.50 per pip. On EUR/USD that is 25,000 units, or 2.5 mini lots.
The notional value is 25,000 times 1.1000, or $27,500. At 2% margin, the deposit would be $550. The deposit is not the risk. The risk is the $100 defined by the stop, plus anything gaps or slippage add.
Costs change the forex trend math
Assume an illustrative 1.5-pip round-trip spread. At $2.50 per pip that costs $3.75. Net of the spread, the objective shrinks to 78.5 pips and the loss grows to 41.5 pips, so the realistic ratio is about 1.89 to 1. That still works for a trend strategy, but on a lower timeframe with a 10-pip stop, the same spread would take a much larger bite.
What ends this forex trend trade
A EUR/USD trend trade plan with an illustrative entry at 1.1000, a stop at 1.0960, an objective at 1.1080 and 25,000 units also states what changes the conclusion:
- A close under 1.0960 ends the long thesis. The stop handles it.
- No confirmation candle means no entry, even if price drifts higher.
- If price rallies to 1.1080 without triggering an entry, the opportunity has passed. Chasing it at a worse price with the original stop would shrink the reward-to-risk ratio.
- If the entry price changes, recalculate the size rather than reusing 25,000 units.
USD/JPY trend trade sizing with yen pips
Yen pairs quote to two decimals, so one pip is 0.01. Say a USD/JPY trend trade plans an entry at 150.00 with a stop at 149.50, a 50-pip stop. On 30,000 units, each pip is worth ¥300, which is $2.00 at 150.00. Fifty pips times $2.00 equals $100, so 30,000 units fits the same $100 risk limit.
How to Avoid False Trend Signals
False trend signals are setups that look like a trend starting or resuming and then fail. Every trend method produces them. The goal is to recognize the conditions that produce them most often and to filter with intent, not to eliminate them entirely.
Common causes of false forex trend signals
- Sideways markets: moving average crossovers and +DI/-DI crosses fire repeatedly when price is rotating, producing a string of small losses.
- Obvious breakout levels: a widely watched swing high attracts stop orders and breakout entries, and price can poke through and snap back.
- Mixed timeframes: a buy signal on the 15-minute chart inside a daily downtrend is fighting the bigger flow.
- News spikes: scheduled releases can push price through a level for seconds before reversing, with spreads wider than usual.
- Indicator stacking: three momentum indicators agreeing is often one piece of information counted three times.
Filters that reduce false trend signals
- Require structure first. No higher high and higher low, no long trend trade.
- Use a strength filter. An ADX reading above 20 or 25 is one way to skip signals in trendless conditions.
- Ask for a close, not a touch. A candle close beyond a level filters some intrabar spikes.
- Wait for a retest. A broken level that holds on a retest is stronger evidence than the first break.
- Check the higher timeframe. Trade only in the direction it allows.
- Avoid entries right into scheduled high-impact releases if your plan cannot handle the spread and slippage.
The cost of filtering trend signals
Filters are not free. Every filter that removes bad signals also removes some good ones and delays the entries that remain. ADX in particular tends to filter as many good signals as bad ones because of its smoothing. Add one filter at a time, test whether it improves results on a meaningful sample, and remove it if it only makes old charts look better.
How to Tell When a Forex Trend Is Ending
A forex trend ending is usually a process, not a single candle. The useful skill is separating a normal pullback inside the trend from a structural change that ends it.
Signs a forex trend is weakening
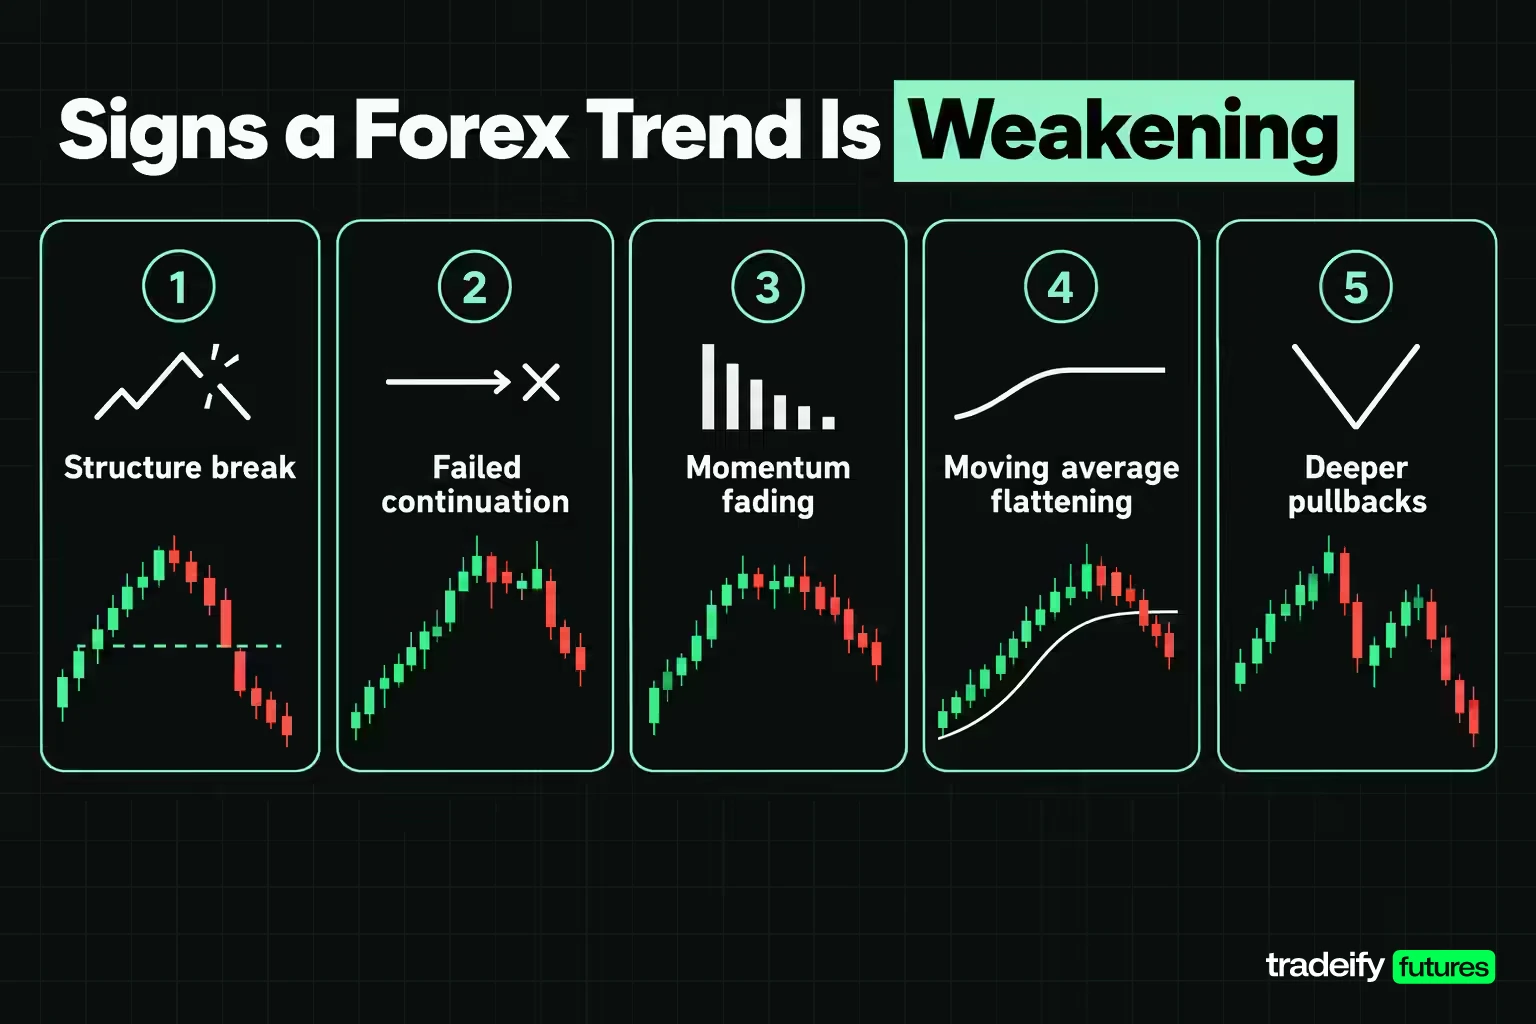
- Structure break: in an uptrend, price closes under the most recent meaningful swing low. In a downtrend, price closes above the most recent meaningful swing high.
- Failed continuation: price makes a new high but cannot hold it, or stalls repeatedly at the same level.
- Momentum fading: MACD makes lower peaks while price makes higher highs, or ADX turns down from an elevated reading.
- Moving average flattening: the trend-defining average stops rising, and price starts crossing it in both directions.
- Deeper pullbacks: retracements get larger and the pushes in the trend direction get smaller.
Pullback or trend reversal
One opposite candle is not enough to call a reversal. A pullback that holds the prior swing level and resumes is the trend working normally. A pullback that breaks the swing level, fails to recover it and then makes a lower high is evidence the trend has changed.
Be careful with divergence. RSI divergence can appear several times during a strong trend before any real top forms, so treating every divergence as a sell signal would mean exiting good trends far too early. Divergence is better used as a reason to tighten a trailing stop or stop adding to the position.
Pre-defining the forex trend exit
Write the event that ends the trade before you enter it, while you are still neutral. That might be a close beyond a swing level, a trailing stop being hit or a time limit. Deciding in the moment, while a position is losing, is where many trend traders move their stop and turn a small, planned loss into a large one.
Trend Trading Compared With Other Forex Styles
Trend trading describes what you trade, the direction of a sustained move. Day trading, swing trading and position trading describe how long you hold. That is why the styles overlap: a day trader can trend trade on intraday charts, and a position trader usually trend trades by definition.
| Style | Core idea | Typical holding period | When it struggles |
|---|---|---|---|
| Trend trading | Trade with a sustained direction | Depends on the timeframe used | Sideways, choppy markets |
| Range trading | Buy support and sell resistance | Minutes to days | Strong breakouts and trends |
| Breakout trading | Enter as price clears a level | Minutes to weeks | False breaks and low volatility |
| Day trading | Open and close within one session | Minutes to hours | High costs relative to small moves |
| Swing trading | Capture multi-day swings | Days to weeks | Weekend gaps and news shocks |
| Position trading | Hold through a primary trend | Weeks to months or longer | Long drawdowns while the trend pauses |
Trend trading and trend following overlap heavily. Trend following usually refers to systematic rules that try to capture a large part of a sustained move, often with trailing exits. Trend trading is the broader term and includes shorter pullback and breakout trades within a trend.
Does Trend Trading Work in Currency Markets
Trend trading can work in currency markets, but the evidence supports caution more than enthusiasm. Two facts pull in different directions.
Research evidence that currency trends persist
Academic research has found momentum effects in currencies. A study by Lukas Menkhoff, Lucio Sarno, Maik Schmeling and Andreas Schrimpf, published in the Journal of Financial Economics in 2012, examined up to 48 currencies from January 1976 to January 2010. It found excess returns of up to 10% per year from portfolios that bought recent winners and sold recent losers. Macro drivers such as interest-rate differences and central bank policy can keep a currency moving in one direction for long stretches.
Research showing currency trend profits are fragile
The 2012 Menkhoff, Sarno, Schmeling and Schrimpf study of currency momentum also reported that momentum returns were sensitive to transaction costs and unstable over short periods. The authors also cited earlier research showing that technical rules such as moving average crossovers, filter rules and channel breakouts were temporarily profitable, but that their profits often deteriorated over time as more traders learned and used them. Those findings describe diversified, multi-currency portfolios, not one trader's chart of a single pair.
What the research means for forex trend traders
Trend behaviour also varies by pair and by period. Currencies tend to trend when the economies behind them are diverging, for example when one central bank is raising rates while another holds or cuts. Pairs whose economies move in step, or periods when policy is on hold everywhere, tend to produce more ranging, overlapping price action. A trend trader who checks whether there is a reason for a pair to keep moving, not just a chart pattern, is better placed to sit out the quiet stretches.
The currency market is very large. The Bank for International Settlements reported foreign exchange trading of $9.6 trillion per day in April 2025, with the US dollar on one side of 89% of trades. Deep liquidity in major pairs keeps costs low relative to many markets, which helps trend strategies that hold for meaningful moves.
The fair conclusion is conditional. Trend trading forex has a sound logic and some research support, but no specific rule set is guaranteed to keep working. Costs, regime changes and your own execution decide whether a particular approach works for you, which is why testing and journaling matter more than the choice of indicator.
How to Start Trend Trading Forex Step by Step
Starting trend trading is mostly about narrowing choices so that your results mean something. A beginner who changes pairs, timeframes and indicators every week cannot tell what is working. The start splits into two jobs: writing the rules, then testing them.
Writing your forex trend trading rules
- Pick one or two liquid pairs. Major pairs such as EUR/USD or USD/JPY usually have tighter spreads than exotic pairs, which matters when trend trades are measured in pips.
- Choose one decision timeframe. Match it to your schedule. Someone who can check charts twice a day is better suited to the four-hour or daily chart than the five-minute chart.
- Write the trend definition. State exactly what counts as an uptrend, a downtrend and a range on that timeframe, using swing structure and one filter.
- Write one entry pattern. Pullback or breakout, with a specific trigger.
- Write the stop and exit rules. Where the idea is invalid, and what closes a winning trade.
- Set a fixed risk per trade. Size every position from the stop distance using the same dollar risk.
Testing and reviewing your forex trend rules
Once a trend trading rule set is written, the next job is to see whether you can follow it and whether it holds up.
- Test on historical charts. Mark past setups by hand or in a backtest and record every result, including the ones you would rather skip.
- Practice in a simulator. Execute the rules in real time without real money before increasing exposure.
- Journal every trade. Record timeframe, setup, entry reason, stop, size, exit, and whether you followed the plan.
- Review after a meaningful sample. Judge the process over dozens of trades, not three.
A short pre-trade checklist keeps the process honest. What is the decision timeframe? Is the pair trending, ranging or in transition? What exact price invalidates the setup? Does the distance to the next obstacle justify the risk after costs? Is a major scheduled release close enough to affect the trade? If any answer is missing, the setup is not fully defined, and waiting is a valid decision.
Currency Trends Through Futures Contracts
Currency trends can also be traded through exchange-listed currency futures instead of spot forex. CME's Euro FX futures (6E) and Micro EUR/USD futures (M6E) track the same euro-dollar exchange rate as the spot pair, quoted in US dollars per euro, so a trend on the EUR/USD chart is a trend in those contracts too.
The difference is in contract size. One 6E contract covers 125,000 euros, with a minimum tick of 0.00005 worth $6.25, so one 0.0001 pip is worth $12.50. One M6E contract covers 12,500 euros, so one pip is worth $1.25. A 40-pip stop is therefore $500 on one 6E contract and $50 on one M6E contract. Fitting an illustrative $100 risk limit to a 40-pip stop would take 2 M6E contracts. Futures size in whole contracts, so risk per trade moves in steps rather than in any unit size you choose.
Futures also trade on a set exchange schedule with a daily maintenance break, rather than through a dealer's quote. Trend logic, stop placement and sizing from the stop all carry over unchanged.
On our accounts, currency exposure comes through CME currency futures (6E, 6B, 6J, 6A, 6C, 6S, M6E and M6A); we don't offer spot forex or CFDs. All positions on our accounts are closed by 4:45 PM ET, with no overnight or weekend holds, so a multi-day currency trend can only be traded as a series of intraday trades in its direction. Our funded accounts are simulated.
Trend Trading Forex FAQ
Is forex trend trading good for beginners?
Yes, forex trend trading suits many beginners because its logic is easy to grasp, though execution still takes practice. Beginners can start by marking swing structure on historical charts, using one pair and one timeframe, and rehearsing entries and exits in a simulator. Simple rules are easier to review than a chart crowded with indicators.
What is the best indicator for trend trading forex?
Swing structure plus one moving average is the most practical starting combination, because no single indicator works best in every market. Moving averages summarize direction, ADX estimates trend strength and ATR helps size stops. Price structure, location, invalidation and risk still need to agree before a trade.
What is the best timeframe for forex trend trading?
There is no universal best timeframe. Higher timeframes give fewer, slower signals with wider stops, while lower timeframes give more signals and more exposure to spreads and noise. Choose a timeframe that fits your schedule and test the whole process on it.
Is trend trading the same as trend following?
The terms overlap. Trend following usually means systematic rules that try to capture a large part of a sustained move, often with a trailing exit. Trend trading is broader and also covers shorter pullback or breakout trades within a trend.
Can you trend trade on a 5-minute chart?
Yes, intraday charts show trends too, and the same structure rules apply. The tradeoff is that stops are smaller, so spreads, commissions and news spikes take a larger share of each trade. Checking a higher timeframe for direction helps avoid fighting the bigger move.
How do you know when a forex trend is ending?
A trend may be ending when price breaks a meaningful swing level, fails to resume after a pullback, or makes new extremes with fading momentum. One opposite candle is not enough on its own. Define the event that ends your trade before you enter.
Building a Repeatable Forex Trend Routine
A forex trend routine works best when it is boring and repeatable. Start with one pair, one decision timeframe and one entry pattern. Mark the structure, check the filter, calculate the stop and size, and save the result whether the trade wins, loses or never triggers. The journal is not there to prove the strategy works after a handful of trades. It is there to show whether you followed the same decision process often enough to judge it.
Trend trading cannot remove uncertainty from currency markets. What it can do is make that uncertainty manageable by defining what you see, what has to happen next and where the idea is wrong.
Forex and futures trading involve substantial risk of loss and are not suitable for everyone. Leverage magnifies both gains and losses, and losses can exceed the amount you deposit depending on the product and account terms. Prices in this article are illustrative, not current quotes or forecasts. Simulated and funded evaluation accounts are simulated and can differ from live trading in execution, costs and rules. This article is general education, not financial advice or a recommendation to trade.


