




TL;DR: Triangle patterns are two converging trendlines, and which line is flat sets the lean before any break. Ascending leans bullish, descending leans bearish, and symmetrical has no lean until price breaks. Confirm the break on a close, then check the stop distance, because the triangle loses height every bar. A stop beyond the broken line, a target from the pattern's height and a 2 to 1 gate keep the trade honest.
You have drawn two lines, price is coiling between them, and the breakout bar finally prints. The question is not whether you spotted triangle patterns correctly. It is whether this particular break, at this point in the pattern, is worth the stop it demands.
The textbook version is simple: two lines squeeze price into a narrowing range, price breaks one side, and the measured move tells you where it might travel. The version that matters for a trade is less tidy. The lean of a triangle is a tendency, not a forecast. The pattern's height, which sets both the stop and the target, shrinks every bar. And the published ways of measuring the target disagree on the same chart. This guide covers all three triangle types, how to confirm one, and how to run the numbers before the break, not after it.
What Triangle Patterns Are
A triangle pattern is a consolidation bounded by two trendlines that converge. One line connects a series of highs, the other connects a series of lows, and the space between them narrows until the lines would meet at a point called the apex. Price usually breaks out of one side before it gets there.
There are three standard triangle patterns, and they differ in only one way: which line is horizontal.
| Triangle | Upper line | Lower line | Lean before the break | Usual role |
|---|---|---|---|---|
| Ascending | Flat | Rising | Bullish | Continuation in an uptrend, sometimes a reversal after a downtrend |
| Descending | Falling | Flat | Bearish | Continuation in a downtrend, sometimes a reversal after an uptrend |
| Symmetrical | Falling | Rising | None until the break | Continuation roughly 75% of the time by the Edwards and Magee estimate |
The ascending and descending versions are sometimes called right-angle triangles, because the flat line and an imaginary vertical line at the start of the pattern form a right angle with the sloping line. StockCharts' ChartSchool describes the symmetrical version as a coil, and the 75% continuation figure comes from Edwards and Magee's 1948 book Technical Analysis of Stock Trends, as cited by ChartSchool. That figure is an estimate from one classic text, not a measured base rate.
The flat line is the most useful part of an ascending or descending triangle. It marks a fixed price that one side of the market keeps defending, and it becomes the breakout level. A symmetrical triangle has no flat line, so there is no fixed level to lean on and no direction to assume.
Related lesson: Support and resistance
Why Triangle Patterns Form
Triangle patterns form when one side of the market holds a level while the other side keeps changing its price, or when both sides keep conceding ground at the same time.
On an ascending triangle, ChartSchool's description is that it looks as if a large sell order sits at the horizontal line and takes weeks to fill. Sellers refuse to go higher than that price. Buyers, meanwhile, keep stepping in at higher prices on every dip, which is what makes the lows rise. The pattern is a record of buyers getting more aggressive against a seller who has not moved. If that seller's supply runs out, nothing is left at the level, and price can move through it quickly.
The descending triangle is the mirror image. A buyer holds a fixed floor, and sellers accept lower and lower prices on every bounce. If the buyer at the floor stops buying, the floor gives way.
The symmetrical triangle is a different story. Buyers pay a bit more on each low and sellers accept a bit less on each high, so neither side is defending a fixed price. Both are narrowing the range together. Volume usually fades as that happens; Bulkowski reports volume trending downward 84% to 86% of the time inside symmetrical triangles. The quiet is the market waiting for new information or new orders to tip the balance.
This story explains why the shapes lean the way they do. It does not tell you when the fixed seller or buyer will run out. That is the trap with a pretty triangle: it feels like the answer is already on the chart, so traders buy the third touch of the rising line in anticipation. The shape is the observation. The break is the confirmation, and those are two different decisions.
How to Identify Triangle Patterns

Drawing two converging lines on a chart is easy. Drawing triangle patterns that deserve a trade takes a short checklist, and the first failed check usually means the shape is a different pattern or no pattern at all.
Triangle Validity Checklist
| Check | What it requires | What goes wrong when you skip it |
|---|---|---|
| Two clean lines | One line through the highs, one through the lows, neither broken by a close | A wandering line forced through unrelated swings |
| Touch count | At least three touches on one line and two on the other | Two swings joined by a straight edge, not a pattern |
| Converging slopes | The lines get closer over time | A widening shape with no apex to measure from |
| Successive highs or lows | Ascending needs each low above the last; descending needs each high below the last | Trading a triangle whose own validity rule already failed |
| Space filled | Price crosses from line to line | A triangle in name with empty space in the middle |
| Volume | Volume fades as the range narrows and expands on the break | Treating a quiet, thin break as confirmation |
The touch rule comes from Bulkowski's identification guidelines on ThePatternSite, which ask for at least three touches on one trendline and two on the other as distinct peaks and valleys. ChartSchool adds a hard invalidation rule for the right-angle versions: an ascending triangle is not valid if a more recent reaction low is equal to or less than the previous one, and a descending triangle is invalid if a more recent reaction high equals or exceeds the previous one.
The crossing rule is the one traders skip most often. Bulkowski is blunt about it for descending triangles: price must cross the pattern from trendline to trendline, nearly filling the space, and triangles with abundant white space are best avoided.
Duration matters too. ChartSchool puts the average ascending or descending triangle at one to three months on daily charts and a typical symmetrical triangle at about three months.
Related lesson: Trendlines and channels
Triangles Compared With Wedges, Pennants and Rectangles
Several patterns look like triangles at a glance, and the difference changes the trade.
- A pennant is a small symmetrical triangle that forms after a sharp, high-volume move called the flagpole. ChartSchool says flags and pennants last one to 12 weeks, and a pennant more than 12 weeks old turns into a symmetrical triangle. On its symmetrical triangle page, ChartSchool says a pattern under three weeks is usually considered a pennant.
- A wedge has two converging lines that slope the same direction. A rising wedge slopes up and carries a bearish bias; a falling wedge slopes down and carries a bullish bias. A triangle's lines slope toward each other, or one is flat.
- A rectangle has two flat, parallel lines. There is no apex and no narrowing, so none of the shrinking-height arithmetic that applies to triangles applies there.
- A broadening formation has lines that move apart. It is the opposite of a triangle.
If you cannot tell which of these you are looking at, that is information too. The shape is not clean enough to measure, and doing nothing is a valid call.
Bullish and Bearish Triangle Signals
Each triangle has a textbook lean, and the measured record shows how loosely that lean holds. Thomas Bulkowski's statistics on ThePatternSite cover thousands of triangles in US stocks on daily charts in a bull market.
| Bulkowski measure | Ascending triangle | Descending triangle | Symmetrical triangle |
|---|---|---|---|
| Sample | More than 1,400 | More than 1,300 | Over 3,000 |
| Upward breakouts | 63% | 53% | 60% |
| Breakout position, share of the way to the apex | 64% | 61% to 65% | 74% |
| Break even failure rate, up / down | 17% / 38% | 22% / 23% | 25% / 37% |
| Average rise after upward breakout | 43% | 38% | 34% |
| Average decline after downward breakout | 13% | 15% | 12% |
| Meeting price target, up / down | 70% / 44% | 64% / 50% | 58% / 36% |
| Throwback / pullback rate | 64% / 63% | 60% / 58% | 62% / 65% |
Reading the Triangle Statistics
Three readings stand out when you compare triangle patterns side by side in Bulkowski's numbers.
First, the ascending triangle is the most consistent of the three when it breaks the way it leans. In Bulkowski's data, upward breaks had a 17% break even failure rate, the lowest in the table, while downward breaks from the same shape failed 38% of the time.
Second, the descending triangle broke upward 53% of the time in that sample. It leans bearish by construction, but the record is close to a coin flip on direction. Bulkowski also notes that descending triangles broke upward 63% of the time when price rose into the pattern, and that performance has dropped almost in half since the 1990s.
Third, Bulkowski ranks symmetrical triangles near the bottom of his chart-pattern list (36 out of 39 for upward breakouts) and says plainly that performance is awful. They appear often, which is part of the problem.
Two cautions keep these figures honest. The break even failure rate is not a win rate; Bulkowski defines it as the share of patterns that fail to move at least 5% after the breakout, which he describes as failing to cover the cost of trading. And these are stock patterns on daily bars. An intraday futures triangle may behave differently, so treat the table as a reason to respect the lean without trusting it.
How Triangle Height Shrinks Toward the Apex
The part most guides to triangle patterns skip is that the pattern's height is not a fixed number. It falls every bar, and the height sets both the stop and the target.
Here is an illustrative symmetrical triangle on the E-mini S&P 500 (ES), using round prices so the arithmetic can be checked by hand. The upper line starts at 7,700.00 at bar 0 and falls 4 points per bar. The lower line starts at 7,500.00 and rises 3 points per bar. The triangle starts 200 points tall, and the lines meet at bar 28.57, at 7,585.71.
Because the lines close in from both sides, the height drops 7 points every bar. On ES, where one point is worth $50 and the minimum tick is 0.25, that is 28 ticks, or $350 per contract, lost to time alone.
| Bar | Upper line | Lower line | Height in points | Share of the triangle's life |
|---|---|---|---|---|
| 0 | 7,700.00 | 7,500.00 | 200 | 0.00% |
| 5 | 7,680.00 | 7,515.00 | 165 | 17.50% |
| 10 | 7,660.00 | 7,530.00 | 130 | 35.00% |
| 15 | 7,640.00 | 7,545.00 | 95 | 52.50% |
| 20 | 7,620.00 | 7,560.00 | 60 | 70.00% |
| 25 | 7,600.00 | 7,575.00 | 25 | 87.50% |
| 28.57 (apex) | 7,585.71 | 7,585.71 | 0 | 100.00% |
On a chart, the triangle at bar 5 and the triangle at bar 25 look like the same setup. They are not. One offers 165 points of structure, the other 25. Nothing in the market had to happen for that change. Time alone did it, which is why any rule that treats a triangle as one opportunity, regardless of when it breaks, is mixing up very different trades.
The rate depends on the type. A symmetrical triangle loses height at the sum of both slopes. An ascending triangle loses it only at the rate of the rising lower line, and a descending triangle only at the rate of the falling upper line, so right-angle triangles shrink more slowly and their stops stay wider for longer.
Triangle Breakout Confirmation
A triangle breakout is confirmed when price closes beyond one of the trendlines. Until then, the pattern is only a potential triangle, and a wick through the line is not the same as a close.
ChartSchool's symmetrical triangle guidance adds three refinements that apply to all three types:
- Closing basis. A break should be on a closing basis. Some traders add a price filter (a 3% break) or a time filter (sustained for 3 days). On intraday futures, the same idea translates into requiring a full bar close, or a set number of ticks, beyond the line.
- Volume. The break should come with expanding volume, especially on upside breaks. Bulkowski found that symmetrical triangles with breakout volume above the 30-day average did better.
- Timing. The ideal breakout comes between one half and three quarters of the way from the start of the pattern to the apex. A break before halfway may be premature, and a break close to the apex may be insignificant, since price has to leave the pattern somewhere.
The measured timing lines up with that window. Bulkowski's median breakout came 64% of the way to the apex on ascending triangles, 61% to 65% on descending and 74% on symmetrical.
Trading the Triangle Retest
Many breakouts from triangle patterns come back to test the line they broke. Bulkowski calls a return to the breakout price within 30 days a throwback (after upward breaks) or a pullback (after downward breaks), and the rates are high: 64% of upward breaks from ascending triangles threw back, and 65% of downward breaks from symmetrical triangles pulled back.
That gives you two entry styles, each with a cost:
- Break entry. Enter on the close beyond the line. You are in every move, but you sit through the retest most of the time.
- Retest entry. Wait for price to return to the broken line and hold it as new support or resistance. Your stop can be tighter, but you miss the breaks that never come back.
Bulkowski also notes that throwbacks and pullbacks hurt post-breakout performance. A retest that holds is fine. A retest that closes back inside the pattern is a warning that the break may be failing.
Related lesson: Breakout trading
Triangle Price Targets and Measured Moves

Every guide to triangle patterns gives a measured move, but the published methods produce different targets on the same chart.
- Widest distance. ChartSchool measures the widest distance of the pattern and applies it to the breakout point. On the illustrative ES triangle, that is 200 points, wherever the break happens.
- Adjusted widest distance. Bulkowski computes the same height (highest peak to lowest valley on a symmetrical triangle) and then multiplies it by the pattern's percentage meeting price target. For upward breaks from symmetrical triangles that figure is 58%, so 200 points becomes 116. His glossary calls the raw measure rule usually inaccurate.
- Height at the breakout. A more conservative reading uses the height of the triangle at the bar where it breaks, which shrinks every bar.
- Parallel line. ChartSchool's second method draws a line parallel to the trendline that slopes in the direction of the break. For an upward break here, that is a line through 7,700.00 rising 3 points per bar, which sits at 7,730.00 at bar 10, 7,745.00 at bar 15 and 7,760.00 at bar 20, and keeps climbing as time passes.
Triangle Targets Compared on One Chart
Here is how the first three triangle target methods play out on upward breaks at three different bars of the illustrative ES symmetrical triangle, which starts 200 points tall with its upper line at 7,700.00 falling 4 points per bar and its lower line at 7,500.00 rising 3 points per bar.
| Breakout bar | Breakout price | Widest distance target | Adjusted target at 58% | Height at breakout target | Gap, widest vs height at breakout |
|---|---|---|---|---|---|
| 10 | 7,660.00 | 7,860.00 | 7,776.00 | 7,790.00 | 70 points |
| 15 | 7,640.00 | 7,840.00 | 7,756.00 | 7,735.00 | 105 points |
| 20 | 7,620.00 | 7,820.00 | 7,736.00 | 7,680.00 | 140 points |
The gap between the widest-distance and height-at-breakout targets grows from 70 to 140 points as the break comes later. That is $3,500 to $7,000 per ES contract, or $350 to $700 per Micro E-mini (MES), on the same pattern.
Here is where traders usually get caught. They anchor on the widest target, hold through the first objective, and watch a perfectly good break give back everything on the retest. The practical fix is to stop treating the target as one number. Treat the widest distance as the optimistic ceiling, the adjusted or height-at-breakout reading as the first objective, and judge what price does between them. Both ChartSchool and Bulkowski describe targets as guidelines, not destinations.
Where to Place a Stop on a Triangle Trade
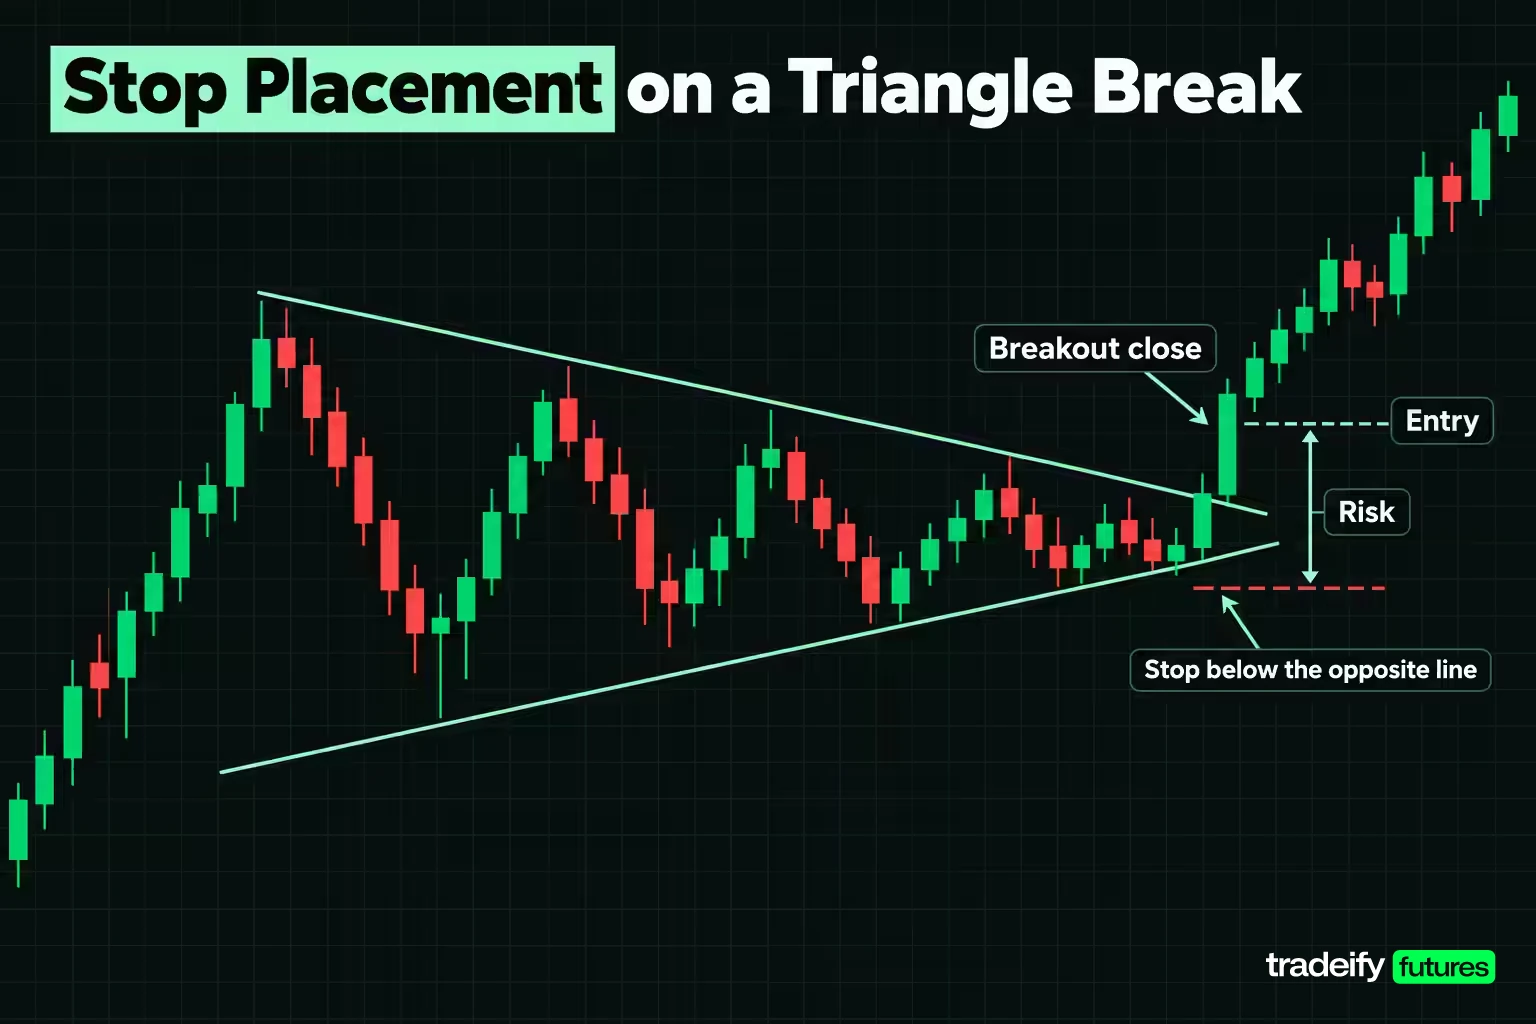
The natural stop on a triangle trade sits just beyond the opposite side of the pattern at the breakout bar, because a close back through that line means the pattern has failed. On the illustrative ES triangle, an upward break uses a stop one tick below the rising lower line.
Because the lower line rises every bar, the stop rises with it, and the risk equals the remaining height plus one tick.
| Breakout bar | Entry | Stop | Risk in points | Risk in ticks | Risk per ES | Risk per MES | Reward to risk, widest target | Reward to risk, adjusted target |
|---|---|---|---|---|---|---|---|---|
| 10 | 7,660.00 | 7,529.75 | 130.25 | 521 | $6,512.50 | $651.25 | 1.54 to 1 | 0.89 to 1 |
| 15 | 7,640.00 | 7,544.75 | 95.25 | 381 | $4,762.50 | $476.25 | 2.10 to 1 | 1.22 to 1 |
| 20 | 7,620.00 | 7,559.75 | 60.25 | 241 | $3,012.50 | $301.25 | 3.32 to 1 | 1.93 to 1 |
| 25 | 7,600.00 | 7,574.75 | 25.25 | 101 | $1,262.50 | $126.25 | 7.92 to 1 | 4.59 to 1 |
Same triangle, same rules, and the risk falls by more than 80% between bar 10 and bar 25. That looks like a reason to always wait for the late break, until you check what the late break does to the targets. The reward to risk against the height-at-breakout target, by contrast, stays at about 1.00 to 1 on every row, because the stop and that target both come from the same shrinking height.
Stops on Ascending and Descending Triangles
Ascending and descending triangles carry wider stops than a symmetrical triangle of the same starting size, because only one line moves. Take an illustrative 200-point ES ascending triangle, with a flat top at 7,700.00 and a lower line rising 3 points per bar from 7,500.00. At bar 20 its height is 140 points. The upward break is at 7,700.00 and the stop goes one tick below the rising line at 7,559.75, a risk of 140.25 points, or $7,012.50 per ES. A symmetrical triangle built from the same starting levels, with the upper line also falling 4 points per bar, risks only 60.25 points at bar 20, so the ascending stop is 80 points wider, worth $4,000 per contract, and the reward to risk against the 200-point widest target is 1.43 to 1.
An illustrative descending triangle, with its upper line falling 4 points per bar from 7,700.00 and a flat floor at 7,500.00, is 120 points tall at bar 20. A downward break at 7,500.00 uses a stop one tick above the falling line at 7,620.25, a risk of 120.25 points, or $6,012.50 per ES, and 1.66 to 1 against the widest target.
Bulkowski's own stop guidance for ascending triangles matches this: place the stop on the side opposite the breakout unless that would be too far away, using a minor low inside the pattern if needed.
Sizing From the Stop Distance
The stop distance decides the position size, not the other way round. Placing the stop where your preferred size fits, rather than where the pattern fails, is how a valid setup turns into a random exit. With an illustrative $1,000 risk budget per trade on MES, at $5 a point:
- At bar 10, risk is $651.25 per MES, so 1 contract fits.
- At bar 20, risk is $301.25 per MES, so 3 contracts fit, risking $903.75.
- At bar 25, risk is $126.25 per MES, so 7 contracts fit, risking $883.75.
A single ES at bar 20 would risk $3,012.50, three times that budget. The stop that fits the pattern often does not fit a full-size contract.
One shortcut to avoid: placing the stop beyond the whole triangle instead of beyond the line at the breakout bar. The risk becomes the full height plus a tick, 200.25 points, which is 1.00 to 1 against the widest target on every triangle type.
Related lesson: Position sizing
Trading Triangle Patterns Step by Step
Trading triangle patterns well comes down to a plan written before the break, so the arithmetic decides the trade instead of the adrenaline of a breakout bar.
Start with a gate. For an illustrative 200-point ES symmetrical triangle (upper line from 7,700.00 falling 4 points per bar, lower line from 7,500.00 rising 3 points per bar) to offer at least 2 to 1 against its 200-point widest target, the stop distance has to be 99.75 points or less. On the symmetrical version that happens at bar 14.32. On the ascending version, it happens at bar 33.42 of a 66.67-bar life. On the descending version, at bar 25.06 of a 50-bar life. All three land at 50.13% of the pattern's life, because each one loses height in a straight line.
That number lines up with ChartSchool's ideal breakout window of one half to three quarters of the pattern. The arithmetic and the classic guidance point the same way: the first half of a triangle is too wide to trade at 2 to 1, and the last quarter is too close to the apex to trust.
If you hold the trade to the stricter Bulkowski-adjusted target of 116 points, 2 to 1 does not arrive until bar 20.32, or 71.13% of the symmetrical triangle's life. That leaves a narrow window, which is exactly why a triangle should not be traded on shape alone.
There is no free version of this trade, only a choice about which problem you carry: a wide stop early or an unreliable target late.
A Triangle Trading Plan in Seven Steps
A plan for trading triangle patterns that follows from the gate:
- Draw the triangle and check it against the validity checklist: at least three touches on one line and two on the other, converging lines, filled space, fading volume.
- Mark the halfway and three-quarter points of the pattern's life. On the illustrative symmetrical triangle, those are bars 14.29 and 21.43.
- Wait for a close beyond a line inside that window. For an ascending or descending triangle, the flat line is the usual trigger.
- Put the stop one tick beyond the opposite line at the breakout bar and size the position from that distance.
- Check reward to risk against the widest target. Skip the trade if it is under your minimum.
- Take partial profit at the adjusted or height-at-breakout target and treat the widest target as a runner objective.
- Exit if price closes back inside the triangle, since the break has failed.
Related lesson: Risk reward ratio
When Triangle Patterns Fail
Triangle patterns fail in two ways: the market breaks the wrong way or reverses after the break, and the trader measures or manages the pattern badly. The first is part of the pattern. The second is avoidable.
On the market side, busted breakouts are common. Bulkowski found that 46% of ascending triangles with downward breakouts busted, reversing to move higher, and that those busts rose an average of 36%. He also notes symmetrical triangles have a tendency to double bust, where price breaks one way, reverses through the other side, then reverses again in the original direction.
A triangle can also stall at the apex without ever breaking cleanly. In Bulkowski's apex study, 165 of 221 triangles across 388 stocks showed a minor high or low within a few days of the apex, a 75% rate. A separate test on 500 stocks from July 1991 to July 1996 found the average distance from the apex to a minor turn was 3.6 days, against 6.55 days expected by chance. A triangle that crawls to its apex is no longer a breakout setup; the apex is more likely to mark a short-term turn.
Trader Mistakes That Sink Triangle Trades
Most disappointment with triangle patterns comes from a handful of repeatable mistakes. The costs below come from the illustrative 200-point ES symmetrical triangle used throughout this guide.
| Failure | What it costs | What to do instead |
|---|---|---|
| Stop beyond the whole pattern | Risk becomes 200.25 points, 1.00 to 1 on every type | Stop one tick beyond the opposite line at the breakout bar |
| Entry in the first half | 130.25 points of risk at bar 10, 1.54 to 1 against the widest target | Wait for the halfway mark or cut size to fit the wider stop |
| Entry near the apex | 25.25 points of risk at bar 25, but the targets are 175 points apart | Stop taking new breaks past three quarters of the pattern |
| Too few touches | A two-touch line can be redrawn to fit almost anything | Require three touches on one line and two on the other |
| Trusting the widest target only | The height-at-breakout target sits 70 to 140 points lower | Take first profit at the conservative target |
| Trading the lean, not the break | Descending triangles broke up 53% of the time in Bulkowski's sample | Wait for the close beyond a line |
The first two rows do the most damage. A stop beyond the whole pattern turns every triangle into a 1 to 1 trade, and an early entry carries the widest stop the pattern will ever offer. The last row is the quiet one: it is the trader who is right about the shape and still loses, because they acted on the lean before the market confirmed it.
Triangle Examples on Real Charts
ChartSchool documents one historical example of each of the three triangle patterns on daily stock charts. They are worth reading for what happened after the target as much as for the target itself.
- Ascending, Primus Telecom (PRTL). Resistance held at 24 for about six months while the lows rose from around 14. The projected move was 10 points (24 minus 14) for a target of 34. After the November breakout, the stock advanced to 30.75, pulled back to around 26 while holding above the old resistance, reached the target within two months and later reached 50.
- Descending, Nucor (NUE). Support at $45 held for a little less than three months under a falling line of highs. The projected decline was nine points (54 minus 45), for a target around $36. The break came on a gap down with heavy volume. Price fell from $45 to $41, made a feeble three-day rally, then dropped past the target before rebounding back near $36.
- Symmetrical, Conseco (CNCEQ). A five-month symmetrical triangle with a widest point of 10.50 points broke support at $29.50. The widest-distance method projected around $19, and the parallel-line method around $20. After a drop from $29.50 to $25.50, the stock bounced weakly and failed to reach the apex area before falling further.
Two lessons repeat across all three. Each break came with a volume expansion, and each target was a guideline, not a finish line: Primus kept running far past it, while Nucor overshot it and came back.
Triangle Patterns on Intraday Futures Charts
Triangle patterns show up on any timeframe. ChartSchool suggests one-minute to hourly charts for day trading, four-hour to daily for medium-term trading, and weekly or monthly for long-term work, with larger timeframes usually more significant.
Intraday triangles on futures bring two practical differences. First, a triangle that started late in a session may run into the session close before it reaches the halfway mark, so a day trader may never see a valid breakout window. Second, intraday volume tends to follow the clock, often heavier around the open and lighter around midday, so a volume fade inside a midday triangle may be the time of day rather than a real coil. Comparing volume with the same time of day on prior sessions helps separate the two.
On our Tradeify accounts, every position is closed by 4:45 PM ET and nothing is held overnight, so a daily-chart triangle that takes one to three months to form is context for an intraday trade, not a position to carry. Our contract limits size the intraday version (a 50K account allows 4 minis or 40 micros, with 10 micros counting as one mini), which is where the MES sizing math earns its keep. Our funded accounts are simulated, and WealthCharts' Chart Replay lets you practice drawing triangles on historical bars first.
Related lesson: What is volume
Triangle Patterns FAQ
What do you mean by triangular pattern?
A triangular pattern is a chart formation where two trendlines, one through the highs and one through the lows, converge toward a point. It shows a narrowing range before a breakout. The three standard versions are ascending, descending and symmetrical.
What is a 3 triangle?
A 3 triangle usually refers to the three triangle chart patterns: ascending, descending and symmetrical. They share the same converging structure and differ only in which line, if any, is flat. The flat top of an ascending triangle leans bullish, the flat floor of a descending triangle leans bearish, and the symmetrical version waits for the break.
What are some triangle shapes?
The ascending triangle has a flat top and rising bottom. The descending triangle has a falling top and flat bottom. The symmetrical triangle has both lines sloping toward each other, and a pennant is a small symmetrical triangle after a sharp move.
What is the triangle strategy in trading?
It means waiting for price to close beyond one of the triangle's lines, entering in that direction, placing a stop beyond the opposite line, and targeting a move based on the pattern's height. The strategy works best when the break comes between halfway and three quarters of the way to the apex.
What is the most powerful pattern in trading?
There is no single most powerful pattern in trading, because any ranking depends on the market, timeframe and sample. Among triangle patterns in Bulkowski's stock data, the ascending triangle with an upward breakout had the lowest break even failure rate, 17%. That is a tendency in one sample, not a guarantee.
Triangle Pattern Trading Risk
Trading futures involves substantial risk of loss, and leverage means losses can exceed what you expect on a single trade. Chart patterns, measured moves and stops describe probabilities, not outcomes, and a stop can fill far from its price in a fast market. The worked example in this article uses constructed, illustrative prices, and the cited statistics come from historical stock data that may not repeat. Funded and evaluation accounts are simulated. This article is education, not investment advice.


