



TL;DR: Bookmap is the pick for reading resting liquidity on a heatmap, but it needs full-depth data and costs the most of the three. Quantower suits traders who want one multi-broker workstation, with footprint and DOM Surface sold as paid add-ons. Sierra Chart is the low-cost, highly configurable choice for footprint, profile and DOM work, with a steeper setup. Footprint, profile and delta come from trades, while heatmaps and depth tools need Level 2 or MBO data. Check the data your account delivers before you pay for any of them.
Most traders shopping for order flow software ask which platform is best. The better question is which tool you will look at before every entry, and whether your data feed can power it.
Bookmap, Quantower and Sierra Chart all sell a clearer view of who is buying, who is selling, and where size is waiting. They show that view differently, price it differently, and depend on market data you may or may not have.
This guide compares the three on the things that change the buying decision: what each tool draws, which data feed it needs, what it costs once data is added, how hard it is to learn, and which type of futures trader it suits. Prices and features were checked on each vendor's own site on November 2, 2026.
Bookmap, Quantower and Sierra Chart Shortlist
Bookmap, Quantower and Sierra Chart each have a clear identity, and most buyers regret the choice only when they pick a tool for the wrong job. Here is the shortlist, with prices as of November 2, 2026.
| Platform | Best at | Signature order flow tools | Starting paid price | Runs on | Biggest tradeoff |
|---|---|---|---|---|---|
| Bookmap | Liquidity heatmap and order book history | Heatmap, volume bubbles, Footprint, DOM Pro, CVD | Global $49/month (no futures trading); Global Plus $99/month | Windows, macOS, limited Linux | Highest cost once data is added |
| Quantower | Multi-broker workstation | DOM Trader, Cluster chart, DOM Surface, Power Trades, TPO | All-in-One $70/month, or single extensions | Windows 10 or 11 | Key order flow tools sit behind paid licenses |
| Sierra Chart | Low-cost, deeply configurable charts and DOM | Numbers Bars, Volume by Price, Market Depth Historical Graph, configurable DOM | Package 10 $36/month; Package 11 $46/month for Numbers Bars | Windows (Mac via Wine or Crossover) | Plain interface and a steep setup |
The short version: Bookmap is a specialist, Quantower is a generalist with strong order flow add-ons, and Sierra Chart is a toolkit you assemble yourself.
If you trade from a heatmap, Bookmap is the reference product. If you read footprints and profiles, either alternative does the job for less money. If your account only carries top-of-book data, the heatmap advantage mostly disappears, which is why the data question comes first.
Bookmap Data Needs and the Level 1, Level 2 and MBO Split
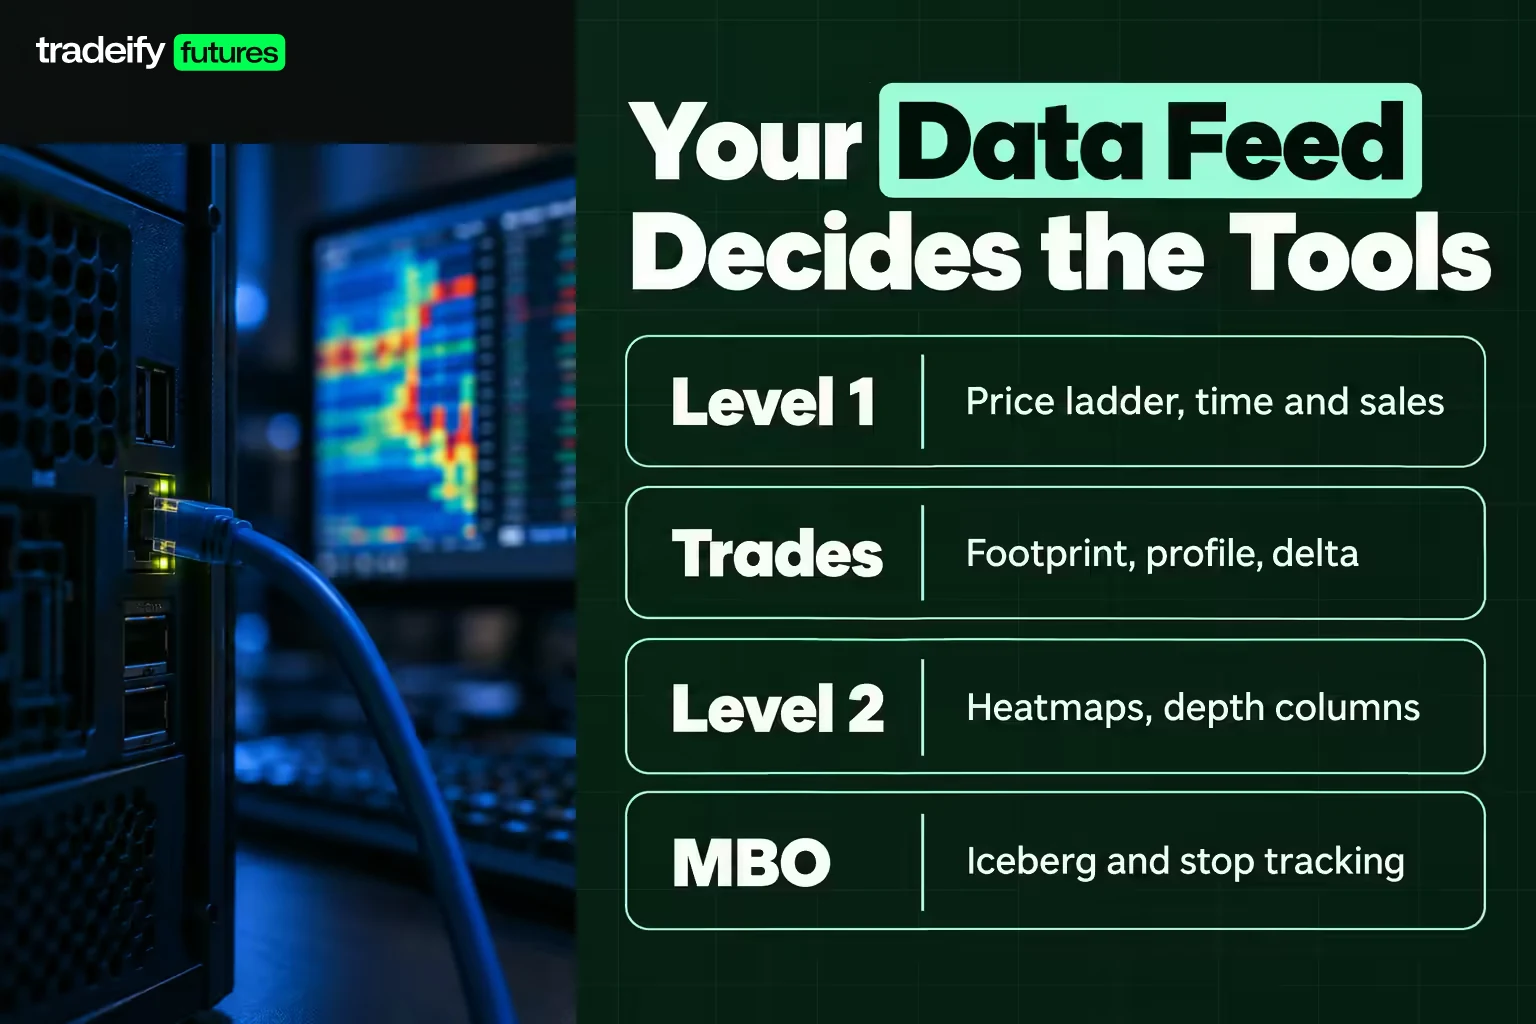
Bookmap, Quantower and Sierra Chart can only draw what their data feed sends them, so the feed decides which order flow tools actually work.
| Data type | What it contains | Order flow tools it powers |
|---|---|---|
| Level 1 (top of book) | Best bid, best ask and last traded price | Price ladder for order entry, basic time and sales |
| Trades with aggressor side | Every print, sized and tagged as hitting the bid or lifting the offer | Footprint and cluster charts, volume profile, delta and CVD, large trade alerts |
| Level 2 (market by price) | Aggregated resting size at several price levels | Heatmaps, DOM depth columns, pulling and stacking, depth history graphs |
| Market by Order (MBO) | Each individual resting order | Iceberg and stop tracking, Bookmap's MBO Bundle, Sierra Chart Package 12 tools |
The split matters. Footprint charts, volume profile and delta are built from executed trades. Heatmaps and depth tools are built from resting orders. A heatmap fed only top-of-book data has almost nothing to draw. Bookmap's FAQ notes that CME transmits up to 10 levels of bid and 10 levels of ask, and Bookmap keeps a record of levels that drift out of that range.
Bookmap is the most depth-dependent of the three. Its connectivity guide says Market Order Data (level 2) "is a prerequisite for using Rithmic in Bookmap" and that "for Bookmap, the order book is a central functionality." Quantower and Sierra Chart both run without depth. You simply lose the depth-based panels, and Quantower's docs say DOM Surface works "depending on the depth of market data."
Before you compare features, find out which of these four data types your broker or account actually sends. That one answer rules out more products than any feature list.
Bookmap Heatmap and Other Liquidity Tools Compared
Liquidity visualization is where Bookmap earns its price. Its main chart is a liquidity heatmap that plots resting limit orders across price levels over time, with brighter areas showing heavier size. Volume bubbles mark executed trades, a line tracks the best bid and offer, and the current order book sits on the right edge. Bookmap's FAQ describes the product as event-driven and updated every 30 milliseconds, with "order book history in addition to current status."
That history is the benefit. A normal DOM shows the book right now. Bookmap shows whether a large bid sat at a level for twenty minutes or appeared two seconds ago, and whether it held, moved or vanished as price arrived.
| Liquidity tool | Bookmap | Quantower | Sierra Chart |
|---|---|---|---|
| Main heatmap | The core chart in every tier | DOM Surface panel (All-in-One or $30/month extension) | Market Depth Historical Graph (Package 11 or 12) |
| Current book display | Order book column and DOM Pro | DOM Trader plus Size, Cumulative Size and Order Book Imbalance histograms | DOM with bid and ask depth columns |
| Pulling and stacking | Order book changes shown on the heatmap | Placing, changing and cancelling shown on DOM Surface | Market Depth Pulling and Stacking columns |
| Iceberg and stop tracking | Stops and Icebergs Tracker (Premium plus MBO feed) | MBO mode on Rithmic colours DOM sizes by order | Market by Order tools on Package 12 |
Quantower and Sierra Chart offer the same raw idea as a panel or study. Bookmap is the only one of the three where the heatmap is the product rather than an extra window.
How to Read a Bookmap Heatmap
A Bookmap heatmap is an observation tool, not a signal generator. A thick band of bids below price is something you notice. What it means only becomes clear when price reaches it.
- Observation: a heavy liquidity band forms a few ticks below price.
- Interpretation: buyers may defend that level, or the size may be bait that gets pulled.
- Confirmation: price trades into the band, volume bubbles print, and the band holds or refills.
- Invalidation: the band disappears before price arrives, or price trades straight through it.
The trap is treating a bright band as support before it has been tested. It feels like information, so it is tempting to lean on it early. Displayed size can be cancelled, and the heatmap shows that cancellation honestly. That is useful, but you are still reading behaviour, not getting a promise.
Bookmap Footprint and Order Flow Charts Compared
Order flow visualization on Bookmap, Quantower and Sierra Chart covers more than the heatmap. Footprint charts, DOM ladders and large-trade markers are where most day traders spend their screen time, and each platform gates them differently.
- Bookmap: the Footprint add-on and DOM Pro arrive at Global Plus. The $49 Global tier (as of November 2, 2026) has neither and cannot trade stocks or futures from Bookmap.
- Quantower: the Cluster chart (Quantower's footprint) and Footprint Imbalances come with Volume Analysis, included in the Crypto, Multi-Asset and All-in-One licenses or sold alone at $35 a month as of November 2, 2026.
- Sierra Chart: Numbers Bars shows volume, ask volume, bid volume and their difference at each price inside each bar. It is an Advanced feature, so a trader on Rithmic or CQG needs Package 11 or 12.
Bookmap Order Flow Feature Table
This Bookmap, Quantower and Sierra Chart table lines up the order flow tools by job rather than by brand name.
| Order flow tool | Bookmap | Quantower | Sierra Chart |
|---|---|---|---|
| Liquidity heatmap | Core chart, all tiers | DOM Surface | Market Depth Historical Graph |
| Footprint chart | Footprint (Global Plus and up) | Cluster chart (Volume Analysis) | Numbers Bars (Package 11 or 12) |
| Volume profile | SVP and CVP columns, POC indicator | Right, left, custom and step profiles | Volume by Price and TPO |
| DOM | DOM Pro (Global Plus and up) | DOM Trader (free version) | Trading DOM with configurable columns |
| Delta and CVD | CVD in all tiers | Cluster chart delta views | Numbers Bars difference values |
| Big trades | Large Trades Alert, Large Lot Tracker | Power Trades | Large Volume Trade Indicator |
| Replay | Record and replay (Global and up) | Market Replay (Multi-Asset or All-in-One) | Chart replay, no recording needed |
All three can do footprint, profile and big-trade work. The real differences are price, interface and how much depth data each tool needs. If two rows in this table are the only ones you would use, price those two rows and ignore the rest.
Bookmap Volume Profile and Delta Tools Compared
Volume and delta analysis is the part of order flow that runs on executed trades, so Bookmap, Quantower and Sierra Chart can all do it without a deep book.
Bookmap shows volume profile as columns next to the heatmap. SVP (session range volume profile) shows traded volume for the whole session, starting from when you subscribed to the instrument. CVP (chart range volume profile) covers only the range on screen. Cumulative Volume Delta (CVD) is included in every Bookmap tier, Digital included, and the point of control indicator and AVWAP start at Global.
Quantower's Volume Analysis bundle carries the cluster chart with delta views, all volume profile types, time statistics, VWAP, anchored VWAP and a Dynamic VPOC indicator. The free version has none of these, and it limits you to 2 indicators per chart.
Sierra Chart's Numbers Bars prints the bid and ask volume difference inside each bar, which is delta at every price. Volume by Price and the TPO Profile chart handle session structure and value areas, with TPO and Numbers Bars both in Package 11.
The decision point: if your edge is reading where volume traded and which side was aggressive, all three deliver. Bookmap adds little here over the cheaper two, so a profile-and-delta trader is paying for the heatmap whether or not it gets used.
Bookmap Scalping and Day Trading Tools Compared
Scalping and day trading tools are about speed of order entry and how clearly the ladder shows what is happening at the inside price. Bookmap, Quantower and Sierra Chart all trade from a DOM, but they package it differently.
- Bookmap: futures and stock trading from the chart or DOM starts at Global Plus, which adds DOM Pro, Execution Pro, Multi-Account Trading, the Absorption Indicator and the Sweep Indicator. Real-time simulated trading is in every tier.
- Quantower: DOM Trader, chart trading and time and sales are in the free version. Multiple Order Entry, order placing strategies and local stop and target orders need a paid license. A Risk Management panel lets you set daily profit and loss limits and maximum position sizes.
- Sierra Chart: the Trading DOM has configurable columns, including bid and ask depth, recent bid and ask volume, current traded volume and pulling and stacking. Every package includes unlimited simulated trading.
For a scalper on ES or NQ, the question is what you look at in the half second before you click. If it is resting size being pulled or stacked, Bookmap or a depth-fed Sierra Chart DOM fits. If it is prints hitting the bid or offer, a footprint plus a plain ladder on any of the three covers it.
If you scalp on one of our Tradeify funded accounts, scalping is allowed, but a payout request needs over 50% of trades held longer than 10 seconds and over 50% of profit from those trades. A fast DOM on Bookmap, Quantower or Sierra Chart does not change that rule, so plan your holds around it.
Bookmap Pricing Compared With Quantower and Sierra Chart
Bookmap pricing sits well above Quantower and Sierra Chart, and none of the three software prices include futures market data. The table shows list prices as of November 2, 2026.
| Software plan | Monthly | Prepaid or long term | Lifetime |
|---|---|---|---|
| Bookmap Global | $49 | $39/month billed yearly | $990 |
| Bookmap Global Plus | $99 | $79/month billed yearly | $1,990 |
| Bookmap Global Premium | $199 | $158/month billed yearly | $3,990 |
| Quantower All-in-One | $70 | $588 per year | $1,690 |
| Sierra Chart Package 10 | $36 | $280.80 for 12 months | Not offered |
| Sierra Chart Package 11 | $46 | $358.80 for 12 months | Not offered |
| Sierra Chart Package 12 | $56 | $436.80 for 12 months | Not offered |
Quantower also sells single extensions, per month on a one-month term: DOM Surface $30, Volume Analysis $35, Power Trades $25 and TPO $20. Volume Analysis plus DOM Surface comes to $65 a month, only $5 under All-in-One, and adding Power Trades makes it $90. Sierra Chart says its prices are subject to small changes without notice and that a one-time purchase "would never be offered."
Free routes exist but are limited. Bookmap Digital is free but cannot trade futures. Quantower's free version allows one connection and leaves out the footprint and DOM Surface. Sierra Chart's 21-day trial unlocks every feature, but external services such as Rithmic, CQG and Interactive Brokers are not supported during it.
Bookmap Market Data Fees on Top of the Software
Bookmap market data is billed separately, and it is the cost that catches buyers out. As of November 2, 2026, Bookmap's pricing page lists BookmapData from $34 to $110 per month, dxFeed futures at $37 per month per exchange, and Rithmic data from $40 to $101 per month. BookmapData sells CME, CBOT, NYMEX and COMEX at $34 a month each, or $79 a month for all four, for non-professional users. Backfill differs too: 72 hours on BookmapData, 24 hours on dxFeed, and on Rithmic 1 hour free or 24 hours for $14 a month per exchange.
Quantower and Sierra Chart usually take data through your broker or data vendor, such as Rithmic or CQG, and Sierra Chart also sells its own Denali Exchange Data Feed. Real-time futures data carries exchange fees in every case, so get the full monthly figure from whoever supplies your feed.
Bookmap Worked Cost Example for a Futures Setup
This Bookmap, Quantower and Sierra Chart example prices a year of footprint charts plus order entry for ES and NQ, using the November 2, 2026 list prices. It is illustrative only and excludes exchange and broker data fees.
| Yearly setup | Software | Data line | Year total |
|---|---|---|---|
| Bookmap Global Plus billed yearly | $79 x 12 = $948 | BookmapData CME only, $34 x 12 = $408 | $1,356 |
| Bookmap Global Plus with the CME bundle | $948 | $79 x 12 = $948 | $1,896 |
| Quantower All-in-One annual | $588 | Through the broker feed | $588 |
| Sierra Chart Package 11, 12 months | $358.80 | Through the broker feed | $358.80 |
Month to month, the gap looks similar: $99 plus $34 is $133 for Bookmap, against $70 for Quantower and $46 for Sierra Chart.
The decision point is simple. If the heatmap is the edge you are paying for, Bookmap's premium may be worth it. If you mainly read footprints and profiles, the single-exchange Bookmap setup costs $768 more a year than Quantower and $997.20 more than Sierra Chart for a view you might not use.
Bookmap Lifetime License Break-Even Math
Bookmap and Quantower both sell lifetime licenses, and Sierra Chart does not. A lifetime license only pays off if you keep using the platform past its break-even point.
- Quantower All-in-One lifetime at $1,690 equals about 24 months of the $70 monthly price, or about 2.9 years of the $588 annual license.
- Bookmap Global Plus lifetime at $1,990 equals about 20 months of the $99 monthly price, or about 2.1 years at $948 a year.
Market data is never part of a lifetime license, so the data bill keeps running either way. Buy lifetime only after a few months of monthly billing have shown you actually use the tools.
Bookmap Broker and Data Feed Connections Compared
Broker connectivity decides which of Bookmap, Quantower and Sierra Chart you can actually trade on, so check it before comparing features.
| Connection detail | Bookmap | Quantower | Sierra Chart |
|---|---|---|---|
| Rithmic | Yes, full depth and MBO; level 2 required | Yes, with optional MBO mode | Yes, Package 10 or higher |
| CQG | CQG Continuum | Yes | Yes |
| Other futures routes | Tradovate, NinjaTrader, Interactive Brokers, TradeStation | Interactive Brokers, IQFeed | Teton order routing, Interactive Brokers, IQFeed |
| Own data option | BookmapData (CME MBO, Nasdaq TotalView) | Third-party data only | Denali Exchange Data Feed with depth and MBO |
Bookmap's Rithmic note is the one to read twice. If your Rithmic account comes from a provider that has not enabled level 2, Bookmap returns "permission denied," and its guide tells you to ask whoever created the account to turn on Market Order Data. The same guide points out that platforms designed to work without an order book, such as R Trader, do not hit this problem.
Quantower's strength is breadth: one license can hold several connections at once, while the free version allows one. Sierra Chart's Base packages (3 and 5) cannot connect to Rithmic, CQG or Interactive Brokers at all, so an outside-broker trader starts at Package 10.
Bookmap Asset Class Coverage Compared With Quantower and Sierra Chart
Asset class coverage (futures, stocks, crypto and forex) is broad on Bookmap, Quantower and Sierra Chart, but the data route differs for each market.
| Market | Bookmap | Quantower | Sierra Chart |
|---|---|---|---|
| CME Group futures | BookmapData, Rithmic, dxFeed, CQG | Rithmic, CQG, Interactive Brokers | Denali, Rithmic, CQG, Interactive Brokers |
| US stocks | BookmapData (Nasdaq TotalView, Cboe EDGX), dxFeed | Interactive Brokers, IQFeed | Denali (Nasdaq, NYSE, AMEX) |
| Crypto | Real-time crypto in the free Digital tier | Crypto exchange connections, Crypto license | Crypto data and trading services |
| Forex and CFDs | CME currency futures through its futures feeds | cTrader brokers, OANDA, FXCM | Forex and CFD data service, LMAX |
Bookmap is strongest on futures and US stocks with full depth, and its free tier is effectively a crypto heatmap. Quantower is the most multi-asset of the three. Sierra Chart covers the most exchanges through its own Denali feed, including EUREX and CFE.
Bookmap Hardware and Performance Compared
Bookmap is the heaviest of the three to run because depth data is heavy. Its performance FAQ says market depth updates make up roughly 90% to 97% of all market data, which is why heatmap platforms need more machine than candle charts.
| Requirement | Bookmap | Quantower | Sierra Chart |
|---|---|---|---|
| Operating system | Windows, macOS, limited Linux | Windows 10 or 11 | 64-bit Windows; Mac via Wine or Crossover |
| Recommended RAM | 16 GB light use, 32 GB for heavy MBO or full-depth use | 16 GB | 16 GB |
| Recommended CPU | 4+ cores light use, 8+ cores heavy use | 4 cores or better | 4 cores minimum |
| Storage | SSD with 100 GB free for the data folder | SSD | SSD |
Bookmap's macOS minimum is 8 GB of RAM with 24 GB preferred, and it runs on only one PC at a time, though Global Plus and Premium allow a second machine in replay mode.
Sierra Chart is written in C++ and says it does not use Java or .NET, which keeps it light on modest hardware. Quantower runs on Microsoft's .NET runtime and installs as a portable folder. For a trader on one laptop, Sierra Chart and Quantower are the easier fit. For a trader planning several full-depth Bookmap charts, budget for the 32 GB, 8-core class of machine.
Bookmap Learning Curve Compared With Quantower and Sierra Chart
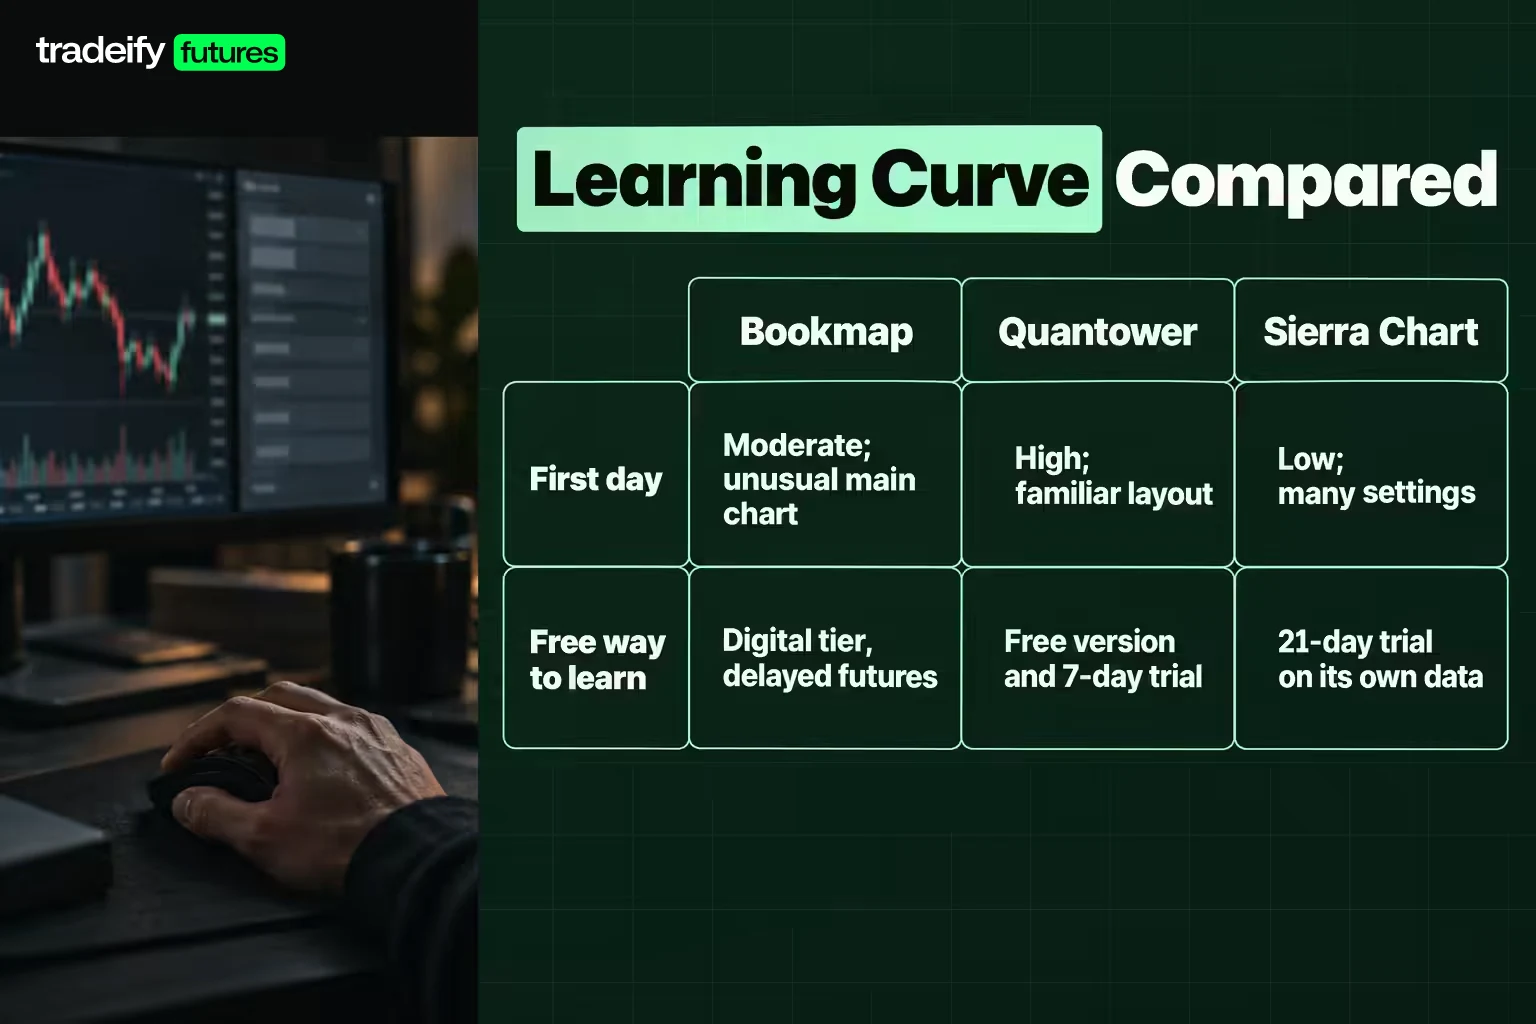
The Bookmap learning curve is about reading, not menus. Bookmap is easy to open and hard to read well, because the heatmap rewards screen time and the chart looks unlike anything most traders learned on.
Quantower feels the most like a modern trading app. Panels, workspaces and templates behave as expected, and the 7-day full trial lets you test the paid tools before buying.
Sierra Chart takes the longest to set up. Settings run deep, the interface is plain, and its 21-day trial cannot connect to Rithmic or CQG, so you learn it on Sierra Chart's own delayed or simulated data first. Traders who put in that time get a platform that does exactly what they configure.
| Learning factor | Bookmap | Quantower | Sierra Chart |
|---|---|---|---|
| First-day usability | Moderate; one unusual main chart | High; familiar layout | Low; many settings |
| Time to read well | Long; heatmap reading takes practice | Moderate | Moderate once configured |
| Free way to learn | Digital tier, delayed futures | Free version and 7-day trial | 21-day trial on its own data |
Bookmap Customization and Coding Options Compared
Customization on Bookmap, Quantower and Sierra Chart ranges from layouts to full programming.
- Bookmap: an add-on Marketplace, a Multibook Customizer on Global Plus, and a published Bookmap API for building your own add-ons.
- Quantower: free workspaces, templates and binds, plus a free API for custom indicators and strategies and an Algo extension for Visual Studio, all in the free version.
- Sierra Chart: ACSIL, its C++ interface for custom studies and trading systems, along with chartbooks that save complete layouts.
If you never plan to code, all three are configurable enough, and the time is better spent on one clean layout you trust. If you do, Quantower's free API is the lowest-cost entry and Sierra Chart's ACSIL gives the most control.
Bookmap Replay and Practice Tools Compared
Replay matters for order flow because you learn to read the tape by watching it again. Bookmap, Quantower and Sierra Chart each handle it differently.
- Bookmap: Record and Replay starts at Global and lets you record live sessions and replay them tick by tick. Global Plus and Premium add a second license for replay.
- Quantower: Market Replay (History Player) is in the Multi-Asset and All-in-One licenses and replays tick, 1-minute or daily data from any data provider or broker.
- Sierra Chart: chart replay runs at 0.1 to 100,000 times normal speed from any point in the available data, with no recording needed, and trade simulation works during replay.
For practice on a specific day, such as a fast open or an FOMC afternoon, Sierra Chart's no-recording replay is the most convenient. Bookmap's replay is the one that shows the full heatmap again, as long as you recorded the session with depth.
Bookmap Support and Learning Resources Compared
Support and documentation are uneven across Bookmap, Quantower and Sierra Chart.
Bookmap has the most structured education. Its packages page lists live trading sessions with pro traders and full access to the Bookmap Discord in every tier, plus a 4-hour order flow course, and its knowledge base covers each feature.
Quantower runs a searchable help center with a page for most panels and every connection, and its pricing page offers a 10 days money back guarantee on licenses. Sierra Chart publishes very detailed documentation and runs a support board where its own staff answer.
If you trade through a prop firm, remember that the platform vendor, not the firm, usually handles software questions. Our Help Center says plainly that we do not provide technical support for Quantower or Sierra Chart.
Bookmap Weak Spots Next to Quantower and Sierra Chart
No platform here is a bad choice. Each one frustrates a specific kind of trader.
- Bookmap: total cost climbs fast once you add Global Plus, data and possibly the MBO Bundle. It needs depth data to be useful, and it asks the most of your hardware. The heatmap can also tempt you to treat displayed size as a level, when that size can be pulled.
- Quantower: the free version is generous for charting, but the order flow tools most buyers want (DOM Surface, Power Trades and TPO) need All-in-One or separate extensions. It is Windows only.
- Sierra Chart: the interface looks dated, setup takes real effort, and the footprint and depth tools need Package 11 rather than the entry Package 10. The free trial cannot connect to Rithmic or CQG.
If a platform's weakness hits the exact thing you trade with, move on. A cheaper tool you fight every day costs more than its price.
Bookmap Alternatives on a Funded Rithmic Account With Level 1 Data
If you trade a funded futures account and want Bookmap-style order flow, the account decides which platform and data you can use, not just your preference. Here is how it works on our Tradeify accounts.
Bookmap is not on our supported platform list, so it does not connect to a Tradeify account. Our Rithmic accounts work with Quantower and Sierra Chart, along with Tradesea and R Trader Pro, all on one Rithmic login. Sierra Chart needs its own paid Sierra Chart subscription at Package 10 or higher, and our setup guide lists Package 10 at $36/month or $23.40/month prepaid for a year. For Numbers Bars you would need Package 11 at $46, a $10 monthly step up, at Sierra Chart prices as of November 2, 2026. Quantower currently needs its beta version enabled to connect to our server.
The data point that matters most: our Rithmic accounts carry Level 1 CME data only. Level 2 depth and EUREX data are not yet available on Rithmic accounts and cannot be purchased from us, from Rithmic or inside the platform. The DOM still works as a price ladder showing the best bid, best ask and your own working orders. Our Quantower guide notes that DOM Surface's full order book view needs Level 2.
Bookmap-Style Tools That Still Work on a Level 1 Rithmic Feed
Our Tradeify Rithmic accounts carry Level 1 CME data only (best bid, best ask and last trade), and Bookmap itself does not connect to them. That shapes which order flow tools in Quantower and Sierra Chart are worth paying for. Combining our Level 1 rule with the vendor docs, the reasoning runs like this:
- Depth-based tools, such as Quantower's DOM Surface, Sierra Chart's Market Depth Historical Graph and DOM depth columns, draw resting orders. On a Level 1 feed they have only the top of the book to show.
- Trade-based tools, such as a Quantower cluster chart, Sierra Chart Numbers Bars, volume profile and delta, are built from executed trades, so they do not rely on depth.
Confirm with our support team before you pay for a package around a specific tool.
On our Tradovate accounts, Level 2 depth is a paid add-on bought from Tradovate, but those accounts run Tradovate, NinjaTrader and TradingView rather than Quantower or Sierra Chart. Switching broker means buying a new account, so choose the broker that fits your platform at checkout.
Our funded accounts are simulated, and every position must be closed by 4:45 PM ET. Futures are leveraged, losses can build quickly, and no order flow tool removes that risk.
Bookmap or Quantower or Sierra Chart by Trader Type
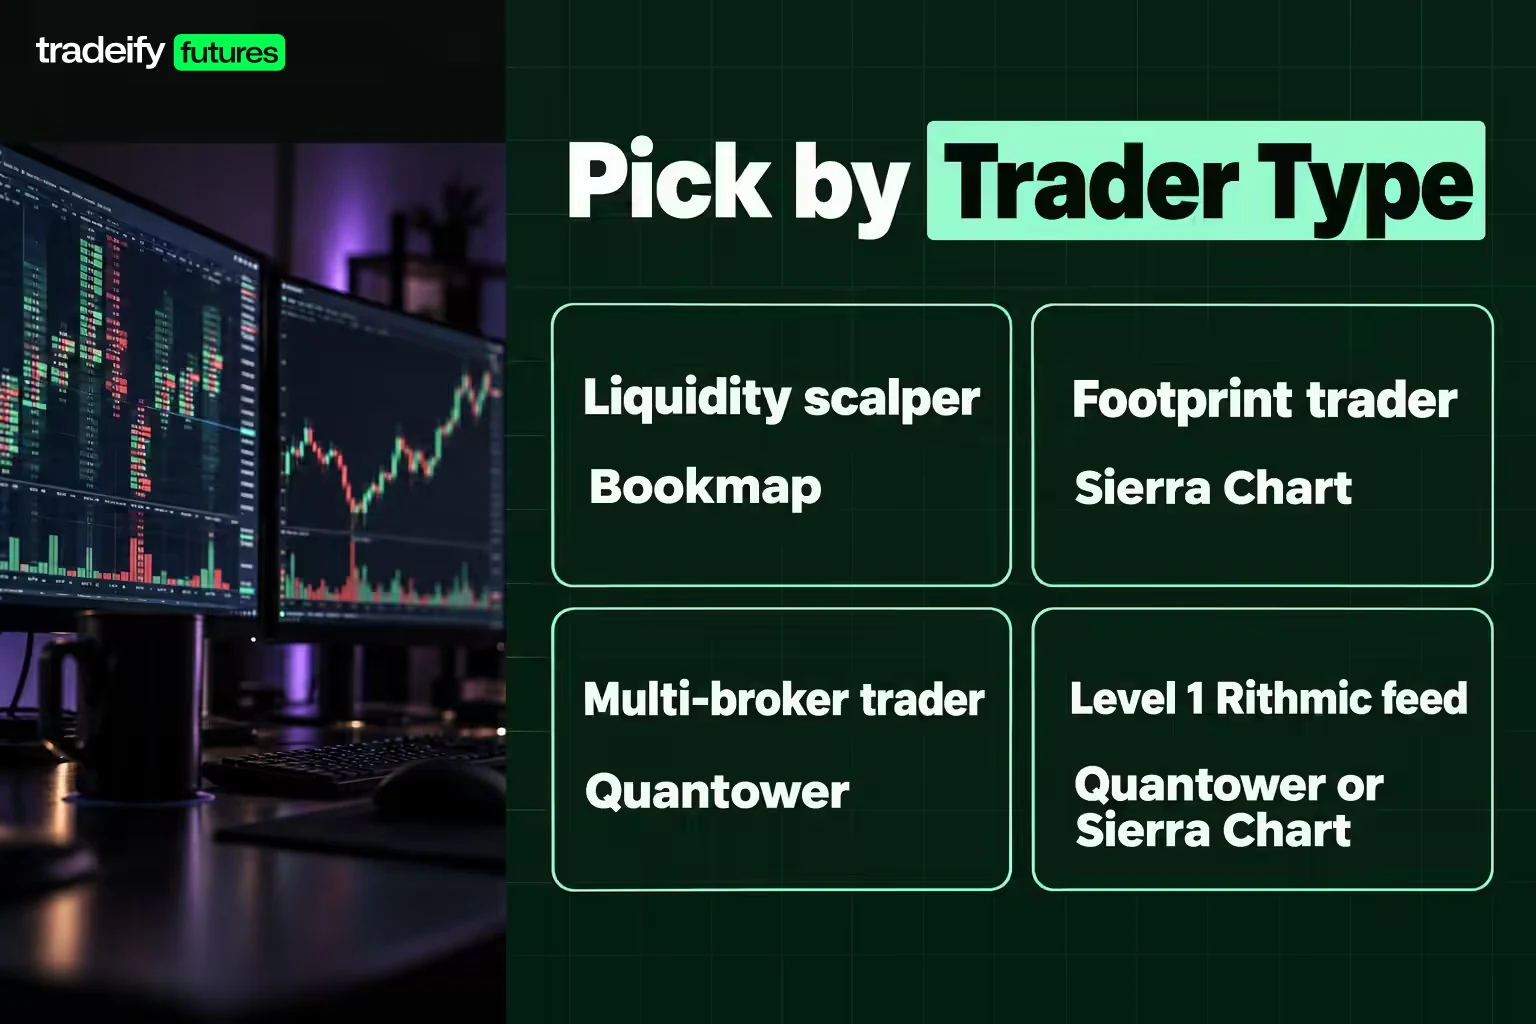
Bookmap, Quantower and Sierra Chart each fit a different trader. Match the platform to how you read the market, not to which demo looked best.
| Trader type | Best fit | Why |
|---|---|---|
| Scalper reading resting liquidity on ES or NQ | Bookmap Global Plus | Heatmap, DOM Pro and replay, if your feed carries full depth |
| Footprint and volume profile trader | Sierra Chart Package 11 | Numbers Bars, Volume by Price and TPO at the lowest price |
| Footprint trader who wants a modern interface | Quantower with Volume Analysis | Cluster chart and profiles in a familiar layout |
| Multi-broker or multi-asset trader | Quantower All-in-One | Several connections under one license |
| Trader who wants to code custom studies | Sierra Chart or Quantower | ACSIL in C++, or a free C# API |
| Mac user | Bookmap | The only one of the three with a native macOS version |
| Funded trader on a Level 1 Rithmic feed | Quantower or Sierra Chart | Footprint, profile and delta rather than depth tools |
A useful test: write down the one tool you would look at before every entry. Then buy the cheapest package that does that tool well on the data feed you actually have.
Bookmap, Quantower and Sierra Chart FAQ
How much is Bookmap per month?
As of November 2, 2026, Bookmap Global costs $49/month, Global Plus $99/month and Global Premium $199/month billed monthly, or $39, $79 and $158 a month billed yearly. Digital is free but cannot trade futures. Futures data is billed separately, from $34 a month per CME Group exchange through BookmapData.
Is Bookmap better than Quantower?
Bookmap is better for reading resting liquidity and order book history on a heatmap. Quantower is better value for footprint, volume profile and multi-broker trading, and its DOM Surface covers basic heatmap use. Pick Bookmap only if the heatmap is central to your entries and your feed carries full depth.
What is SVP in Bookmap?
SVP stands for session range volume profile. It is a Bookmap column that shows traded volume at each price for the whole session, starting when you subscribed to the instrument. Its partner, CVP, shows volume only for the chart range on screen.
Is Sierra Chart better than Bookmap for order flow?
Sierra Chart is better for footprint, volume profile and highly configured DOM work at a lower price. Bookmap is better for reading resting liquidity through a heatmap. Sierra Chart's Market Depth Historical Graph covers some heatmap use at Package 11, but it is not its core view.
Is Quantower free for order flow trading?
Quantower has a free version with one connection, DOM Trader, time and sales and a Market Heatmap panel. The cluster chart, volume profiles, DOM Surface and Power Trades are paid, through a license such as All-in-One at $70/month or as separate extensions, as of November 2, 2026.
Do you need Level 2 data for order flow trading?
You need Level 2 or Market by Order data for depth tools such as heatmaps, DOM depth columns, pulling and stacking, and iceberg tracking. Footprint charts, volume profile and delta are built from executed trades, so they depend on trade data rather than book depth. Bookmap in particular expects full-depth data.
Does Bookmap work on a Mac?
Yes. Bookmap has native macOS versions for Intel and Apple Silicon machines, with 8 GB of RAM as the minimum and 24 GB preferred. Quantower and Sierra Chart are Windows programs, so Mac users run them through a virtual machine or a compatibility layer such as Wine.
Does Bookmap have a web version?
Yes. Bookmap lists Bookmap Web, a browser-based version, among its products. The packages compared in this guide, including futures trading from the chart, belong to the downloadable Bookmap platform, which has system requirements for Windows, macOS and Linux.
Is Bookmap better than TradingView?
Bookmap is built around a liquidity heatmap of resting orders, while TradingView is a general charting platform. TradingView's volume footprint and TPO start at its Premium plan, $69.95 a month billed monthly as of November 2, 2026. On our accounts, TradingView connects through Tradovate credentials only, and Bookmap is not supported.
Bookmap Buying Checklist Before You Pay
Before buying Bookmap, Quantower or Sierra Chart, start with the data, not the software. Confirm what your broker or account actually delivers (Level 1, Level 2 or MBO), and only then compare packages.
Then use the free routes. Run Quantower's 7-day full trial, open Sierra Chart's 21-day trial on its own delayed data, or try Bookmap's free Digital tier, and note which tool you actually looked at before each trade. Buy the cheapest package that covers that tool on the feed you have.