.svg)

.svg)
.svg)


TL;DR: A risk reward ratio compares the loss planned at the stop with the gain planned at the target. Because traders reverse the notation, this guide uses reward-to-risk: 2:1 means two units of potential reward for each unit of planned risk, which may also be written as a 1:2 risk-to-reward ratio. Calculate the price distance from entry to stop and entry to target, convert both distances to dollars using tick value and contract count, then divide reward by risk. Before fees and slippage, a 1:1 plan needs a 50% win rate to break even, 1½:1 needs 40%, 2:1 needs 33⅓%, and 3:1 needs 25%. Those are mathematical thresholds, not forecasts. A useful ratio has a stop based on trade invalidation, a realistic target, positive expectancy in actual journal data, and dollar risk that fits the account’s active limits. For evaluation and funded-account traders, the ratio is only one part of the decision. Position size, total open risk, drawdown room, day-loss constraints, execution costs, and the difference between planned and realized results matter just as much.
Table of contents
- What a risk reward ratio actually tells you
- How to calculate a risk reward ratio
- Risk reward ratio examples for futures trades
- Common ratios and break-even win rates
- What makes a good risk reward ratio
- How the ratio fits a prop trading account
- Planned and realized risk reward
- Diagnose the risk reward gap
- Common risk reward mistakes
- A pre-trade risk reward checklist
A 3:1 ratio can look clean on a chart and still describe a bad trade.
The stop may sit inside normal price noise. The target may be far beyond any realistic move. The position may be too large for the account. Or the trader may abandon both levels as soon as pressure hits.
That is the real job of a risk reward ratio. It does not predict the next trade. It forces you to define the loss, the target, and the trade-off before money and emotion are involved.
What a risk reward ratio actually tells you
A risk reward ratio compares two estimates:
- Risk: the amount you plan to lose if the trade reaches the stop
- Reward: the amount you plan to gain if the trade reaches the target
If a trade risks $100 to pursue $200, the planned reward is twice the planned risk.
The ratio helps you compare setups on a common scale. One futures trade may risk 12 ticks and another may risk 30 ticks, but both can offer 2R of potential reward. Here, R means one unit of the trade’s initial planned risk.
The ratio is a planning tool, not a probability. A 3:1 setup does not have three times the chance of winning. It only says the planned gain is three times the planned loss.
Pick one ratio convention
Traders use two conventions:
- Risk-to-reward: $100 risk and $200 reward is written 1:2.
- Reward-to-risk: $200 reward divided by $100 risk is written 2:1.
Both describe the same trade. Trouble starts when a journal, calculator, or trading plan uses one convention and the trader reads it as the other.
This guide uses reward-to-risk because it maps directly to R-multiples. A 2:1 ratio means the target is 2R from the entry while the stop is 1R away. When you record a trade, label the fields instead of writing an unlabeled “2:1.”
How to calculate a risk reward ratio

Start with three prices:
- Planned entry
- Protective stop
- Profit target
For a long trade:
Risk distance = Entry price − Stop price
Reward distance = Target price − Entry price
For a short trade:
Risk distance = Stop price − Entry price
Reward distance = Entry price − Target price
Then calculate:
Reward-to-risk ratio = Reward distance ÷ Risk distance
Price distance is enough to find the ratio when the same number of contracts will be used at the stop and target. To plan account risk, convert the distance to dollars:
Risk per contract = Stop distance in ticks × Dollar value per tick
Reward per contract = Target distance in ticks × Dollar value per tick
Total planned risk = Risk per contract × Number of contracts
Contract count changes the dollars at stake, but it does not change the ratio when the entire position uses the same stop and target.
Include trading costs in the risk reward estimate
The chart ratio is a gross estimate. A more realistic plan adds expected round-turn commissions and fees to risk and subtracts them from reward.
Slippage is less predictable. You can estimate it from your own fills, but you cannot assume a stop will always execute at its trigger price. That is one reason to keep a planned ratio and a realized ratio instead of treating the chart calculation as the final result.
Risk reward ratio examples for futures trades
The examples below use hypothetical tick values so the mechanics stay clear. Always confirm the current contract specifications and order behavior for the product and platform you trade.
Long futures example
Suppose a trader plans:
- Entry at 5,000
- Stop at 4,996
- Target at 5,008
- Contract value of $5 per point
- One contract
The stop is 4 points from entry, so planned risk is:
4 points × $5 = $20
The target is 8 points from entry, so planned reward is:
8 points × $5 = $40
The reward-to-risk ratio is:
$40 ÷ $20 = 2:1
Two contracts would raise planned risk to $40 and planned reward to $80. The ratio would remain 2:1.
Short futures example
Suppose a different market has a $5 tick value. A trader plans:
- A short entry
- A stop 6 ticks above entry
- A target 9 ticks below entry
- Two contracts
Risk per contract is:
6 ticks × $5 = $30
Reward per contract is:
9 ticks × $5 = $45
Across two contracts, the trade risks $60 to pursue $90.
$90 ÷ $60 = 1½:1
The arithmetic is simple. The harder question is whether the 6-tick stop marks a real invalidation level and whether the market can reasonably travel 9 ticks to the target.
Common ratios and break-even win rates

Reward-to-risk and win rate work together. If every loss equals 1R and every win reaches the planned target, the break-even win rate before trading costs is:
Break-even win rate = 1 ÷ (1 + Reward-to-risk multiple)
Reward-to-risk | Equivalent risk-to-reward | Break-even win rate before costs |
|---|---|---|
1:1 | 1:1 | 50% |
1½:1 | 1:1½ | 40% |
2:1 | 1:2 | 33⅓% |
3:1 | 1:3 | 25% |
A 2:1 plan can break even with fewer wins than a 1:1 plan because each full winner offsets two full losses. That does not mean any 2:1 setup is sound. If the target is reached less often than 33⅓% of the time, or if realized winners average less than 2R, the strategy can still lose before costs.
Commissions, fees, slippage, partial exits, early profit-taking, and losses larger than 1R all raise the real win rate needed to break even.
What makes a good risk reward ratio
There is no universal “good” ratio.
Page-one explanations often mention 1:2 or 1:3 benchmarks. Those numbers can be useful filters, but they are not rules. CME Group’s 2% Rule lesson pairs a predetermined ratio with stop distance and position size, while also stating that its 2% account-risk threshold is arbitrary.
A ratio is useful when all of these are true:
- The stop marks the point where the trade idea is wrong.
- The target is plausible for the market structure, volatility, and time available.
- The position’s dollar risk fits the account and trading plan.
- The strategy’s realized win rate and average win support positive expectancy.
- Costs and typical slippage do not erase the edge.
Use expectancy with the risk reward ratio
Expectancy estimates the average result per trade:
Expectancy in R = (Win rate × Average win in R) − (Loss rate × Average loss in R) − Average costs in R
Suppose a setup wins 45% of the time, the average winner is 1½R, and the average loser is 1R:
(45% × 1.5R) − (55% × 1R) = 0.125R before costs
Now consider a setup that wins 60% of the time but averages only ½R on winners while losing 1R on losers:
(60% × 0.5R) − (40% × 1R) = −0.10R before costs
The higher win rate did not rescue the weaker payoff profile.
Expectancy does not guarantee the next outcome. It describes the average produced by a defined setup over a meaningful sample. If the sample mixes different markets, sessions, entry rules, and discretionary exits, the statistic can hide more than it reveals.
Keep risk reward stops and targets honest
Do not pull a stop closer just to manufacture a larger ratio. A tight stop can sit inside ordinary movement and get triggered before the setup has actually failed.
Do not push a target farther away just to turn 1¼R into 2R. If price rarely reaches that area during the session, the attractive ratio is mostly decoration.
Start with market logic. Set the invalidation level and a plausible target first. Calculate the ratio second. If the trade does not meet the plan, skip it. Do not force the chart to produce the number you wanted.
How the ratio fits a prop trading account
For an evaluation or funded-account trader, reward-to-risk has to fit inside a larger risk plan.
CME Group’s trade-plan guidance tells traders to define intended leverage, maximum trade loss, maximum day loss, the number of simultaneous positions, and maximum account exposure. That sequence matters when an account also has drawdown or consistency constraints.
Use this order:
- Define the setup and its invalidation level.
- Choose the planned entry and stop.
- Choose a realistic target.
- Calculate the reward-to-risk ratio.
- Convert the stop distance to dollars per contract.
- Size the position within the tightest active account limit.
- Check other open risk and the remaining room for the session.
- Place or stage orders only after the complete plan fits.
The ratio does not size the position
A 3:1 setup can still be too large.
Suppose the trade plan allows no more than $150 of risk. A setup has $60 of price risk per contract plus an estimated $5 of round-turn costs.
Estimated risk per contract = $65
Maximum contracts = Floor of $150 ÷ $65 = 2 contracts
Three contracts would create an estimated $195 of risk. The ratio might look attractive, but the size would violate the risk budget.
Position size should come after stop placement. Starting with the maximum available size and squeezing the stop inward reverses the process.
Count total open risk
Two trades that each risk 1R can lose together. That is especially important when positions respond to the same market driver.
Track:
- Risk on the new trade
- Risk on existing positions
- Realized loss for the session
- Remaining drawdown or day-loss room
- Additional risk if stops slip
Use the strictest applicable constraint, whether it comes from your personal plan or account rules. Leave room for normal execution variance instead of planning to land exactly on a limit.
Know how stop orders affect futures risk
A stop is part of the plan, but it is not a promise of an exact fill. CME Group’s futures order-types lesson explains that stop-limit orders become limit orders after activation, while protected stop orders execute only within a defined protection range.
That creates a trade-off. A market-style stop prioritizes getting out but may fill away from the trigger. A stop-limit order controls the acceptable price but may remain unfilled in a fast move. Review the exact order types and protection rules supported by your broker, platform, and contract.
Planned and realized risk reward
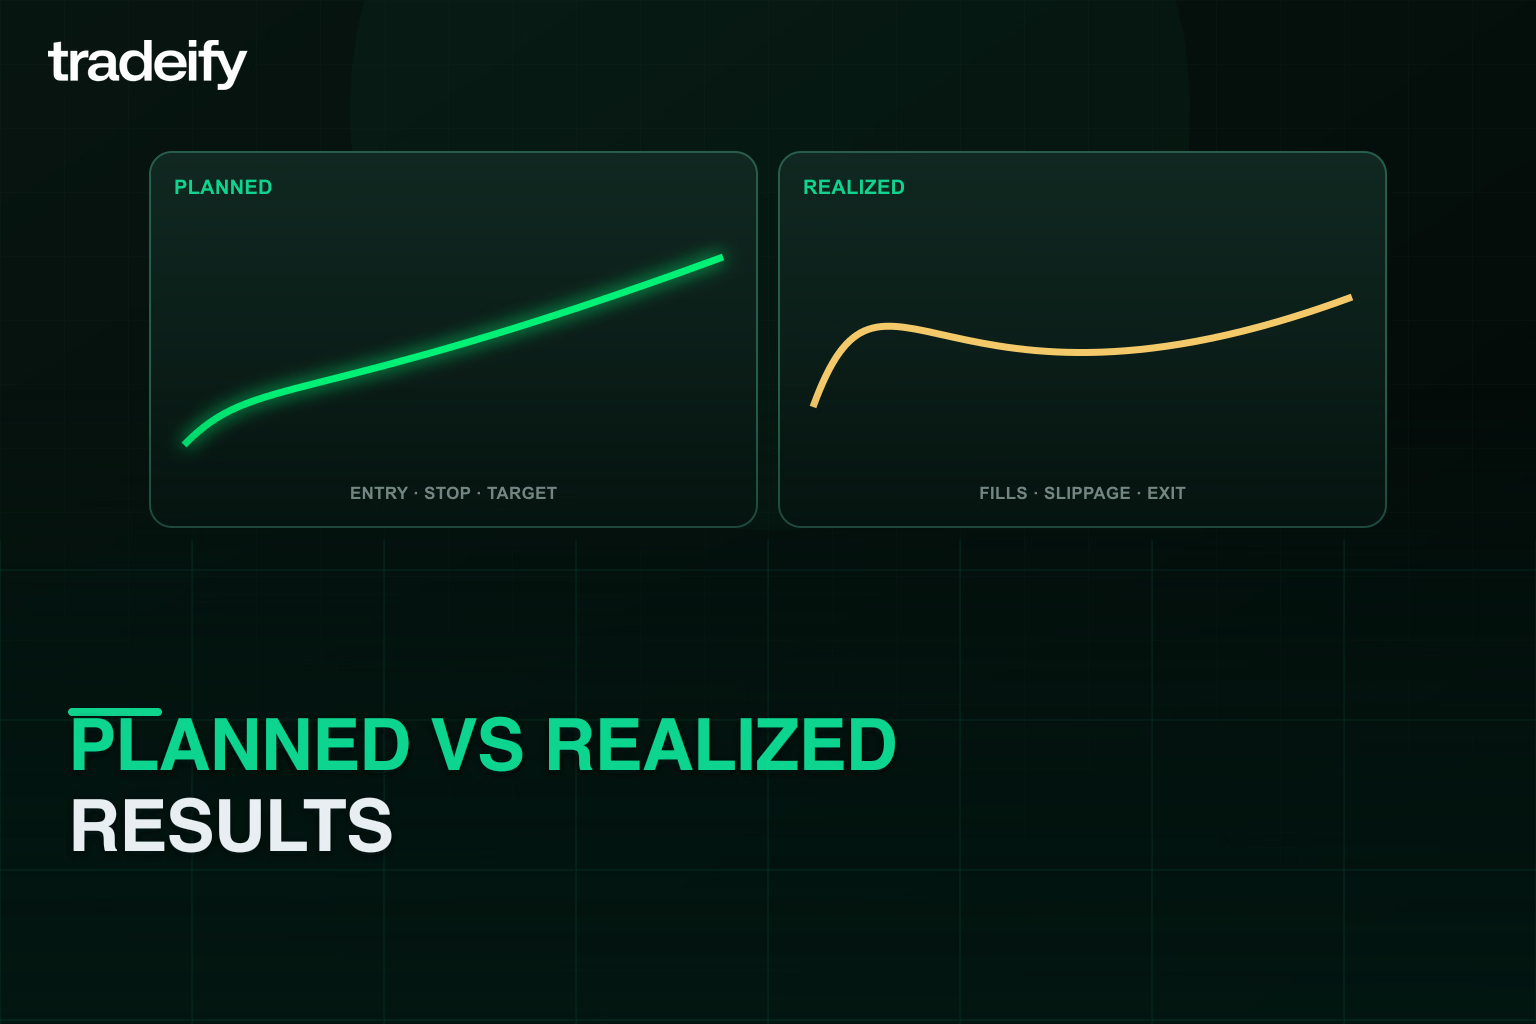
The pre-trade ratio is planned reward-to-risk. Your journal should also record what happened.
For each trade, capture:
- Planned risk in ticks and dollars
- Planned reward in ticks and dollars
- Planned reward-to-risk multiple
- Actual entry and exit prices
- Commissions, fees, and estimated slippage
- Realized result in R
- Reason for any stop, target, size, or exit change
After a useful sample, calculate:
- Win rate
- Average winner in R
- Average loser in R
- Expectancy in R
- Percentage of trades that followed the original plan
This separates a setup problem from an execution problem.
If planned 2R winners routinely become 0.7R exits because you take profits under pressure, the chart ratio is not your real payoff. If 1R stops regularly become 1.3R losses because you move them or hesitate, the realized risk is larger than the plan.
That gap is where discipline shows up. Review it without turning one loss into an emergency. One trade is noise. A repeated pattern is information.
Diagnose the risk reward gap
When planned 2R trades repeatedly produce less than 2R, “execution” is too broad an explanation. Split the gap into causes you can test.
Gap type | Examples | Question to test |
|---|---|---|
Plan-design gap | The target sits beyond normal movement, the stop sits inside ordinary noise, or the setup rarely offers the assumed path | Does historical trade data support the planned stop and target? |
Market-friction gap | Spread, commissions, slippage, partial fills, or fast-market exits reduce the available payoff | What does the ratio become after typical trading costs by contract and session? |
Decision gap | The trader exits early, moves the stop, adds size, or changes the target under pressure | How often did the actual management match the written plan? |
For each trade, calculate the planned R and the realized R, then assign the difference to one or more gap types. Review totals over a useful sample.
Suppose ten planned 2R winners average only 1.2R. If 0.5R disappears because targets are rarely reached even when the plan is followed, the design needs review. If the target is reached in the data but exits happen early in real time, the decision process needs review. If the difference clusters around a thin session, execution assumptions need review.
Do not repair every gap by demanding a larger target. The diagnosis should change the right part of the system: setup design, cost assumptions, order handling, or trader behavior.
Common risk reward mistakes
Treating the ratio as a win probability
A 3:1 ratio does not mean the trade is likely to win. The target may be less likely to be reached precisely because it is farther away.
Moving the stop to improve the ratio
The stop should mark invalidation. A stop chosen only to make the arithmetic look better can increase stop-outs without improving the setup.
Forcing a distant reward target
A large reward number is meaningless if market structure, volatility, or the remaining session makes the move improbable.
Ignoring futures contract count and tick value
Price distance describes the ratio. Tick value and size determine the account impact. Traders who skip the dollar conversion may learn the real risk only after the position moves against them.
Ignoring costs in the risk reward ratio
Small targets are especially sensitive to friction. A gross 1:1 ratio can fall below 1:1 after round-turn costs and imperfect fills.
Changing the risk plan under pressure
Moving a stop, taking an early exit, or adding size changes the ratio. If the change is not part of a written management rule, it is a new trade decision made with money already at risk.
Applying one ratio to every setup
Different markets, sessions, and setups produce different payoff distributions. Use realized data for each defined setup instead of forcing one threshold across everything.
A pre-trade risk reward checklist
Before sending the order, ask:
- Is the setup defined clearly enough to say where it is wrong?
- Is the stop outside ordinary noise and at a real invalidation level?
- Is the target plausible for current structure and time?
- Which notation am I using, reward-to-risk or risk-to-reward?
- What are the risk and reward in ticks?
- What are the risk and reward in dollars after contract count and estimated costs?
- Does the size fit the tightest active account limit?
- How much total risk is already open?
- How much room remains for the session and drawdown?
- What order types will be used, and what happens if an order does not fill as expected?
- Are partial exits, trailing stops, or time-based exits part of the written plan?
- Will I record both planned and realized R?
The ratio should make the decision cleaner. If the numbers work only after moving the stop, stretching the target, or using too much size, the trade does not fit.
Protect capital first. Wait for a setup whose logic, payoff, and account risk agree.
Futures trading is volatile, complex, and risky. Review the CFTC’s futures market basics, understand the rules that apply to your account, and use only risk you can afford to take. This article is educational and does not guarantee a trading outcome.
.svg)
.svg)
.svg)
.svg)






.webp)