.svg)

.svg)
.svg)



Table of Contents
- What trading expectancy tells you
- How the trading expectancy formula works
- A trading expectancy example
- How to calculate trading expectancy from a journal
- What a good trading expectancy looks like
- Trading expectancy in R-multiples
- Trading expectancy vs profit factor
- How many trades trading expectancy needs
- Why trading expectancy changes
- How to improve trading expectancy
- Trading expectancy mistakes to avoid
- Trading expectancy questions
TL;DR: Trading expectancy estimates the average amount a strategy earns or loses per trade. Use Expectancy = (Win Rate × Average Win) − (Loss Rate × Average Loss). A system with a 45% win rate, a $300 average win, and a $150 average loss has an expectancy of $52.50 per trade before costs. Positive expectancy suggests an edge, but the estimate is only useful when it includes fees and slippage, comes from a meaningful sample, and is reviewed by setup and market condition.
Trading results can be deceptive when viewed one trade at a time. A strategy may win often but lose money because its average loss is too large. Another strategy may lose more often than it wins yet remain profitable because its winning trades are much larger than its losing trades.
The trading expectancy formula combines those moving parts into one number. It estimates the average profit or loss produced by each trade over a sufficiently large sample. That makes expectancy useful for evaluating a strategy, comparing setups, sizing risk, and deciding whether a recent run of results reflects an edge or ordinary variance.
Expectancy is not a forecast for the next trade. It is a statistical estimate based on past or tested results. Its quality depends on the data used to calculate it.
What trading expectancy tells you
Trading expectancy answers a practical question: if the same process were repeated many times, how much would it make or lose per trade on average?
A positive result means the strategy made money per trade over the measured sample. A negative result means it lost money per trade. An expectancy near zero means the apparent edge may be too small to survive commissions, exchange fees, bid-ask spread, and slippage.
Expectancy gives more context than win rate alone. Consider two systems:
System | Win Rate | Average Win | Average Loss | Expectancy |
|---|---|---|---|---|
A | 70% | $100 | $300 | -$20 |
B | 40% | $300 | $100 | $60 |
System A wins seven trades out of ten, but its losses are three times the size of its wins. System B wins only four trades out of ten, but its payoff is large enough to produce a positive average. The higher win rate feels smoother, yet the lower-win-rate system has the stronger measured edge.
How the trading expectancy formula works
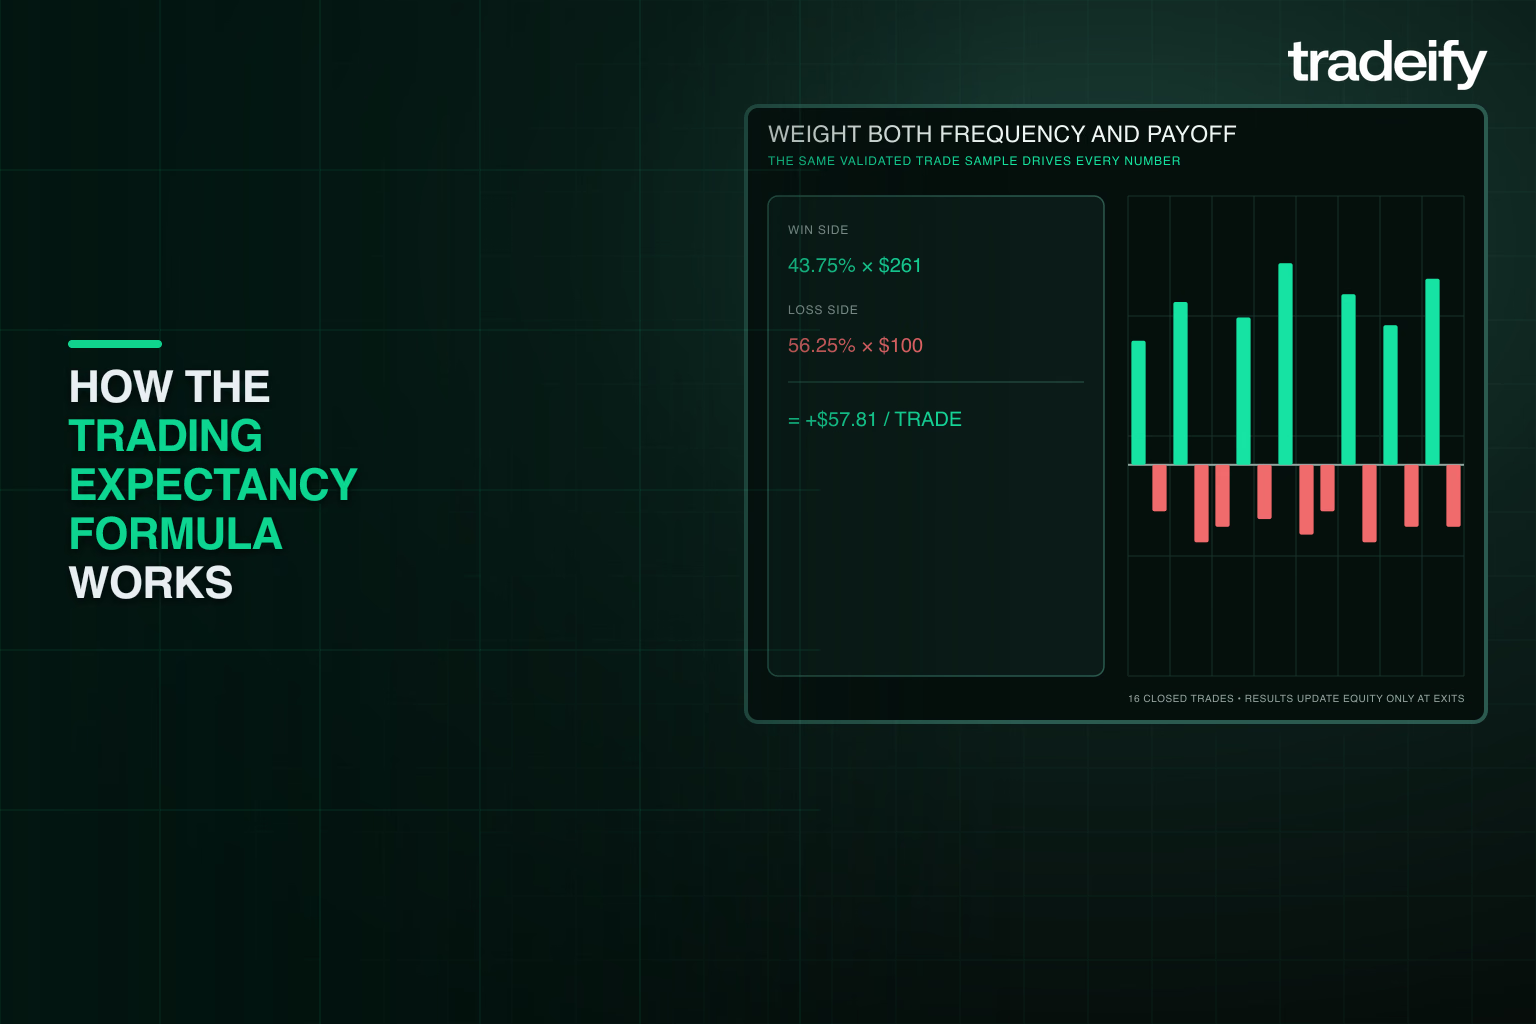
The standard trading expectancy formula is:
Expectancy = (Win Rate × Average Win) − (Loss Rate × Average Loss)
The four inputs are:
- Win rate: Winning trades divided by total trades.
- Average win: Total profit from winning trades divided by the number of winning trades.
- Loss rate: Losing trades divided by total trades. If every trade is classified as a win or loss, loss rate equals 1 minus win rate.
- Average loss: The absolute value of total losses divided by the number of losing trades.
Use decimal rates in the calculation. A 45% win rate becomes 0.45, while a 55% loss rate becomes 0.55. Average loss is entered as a positive magnitude because the subtraction sign already accounts for it.
Break-even trades require a consistent rule. You can exclude true scratches from the win and loss counts while retaining their costs in net results, or treat them as a separate zero-outcome category. Do not switch methods between reviews.
A trading expectancy example
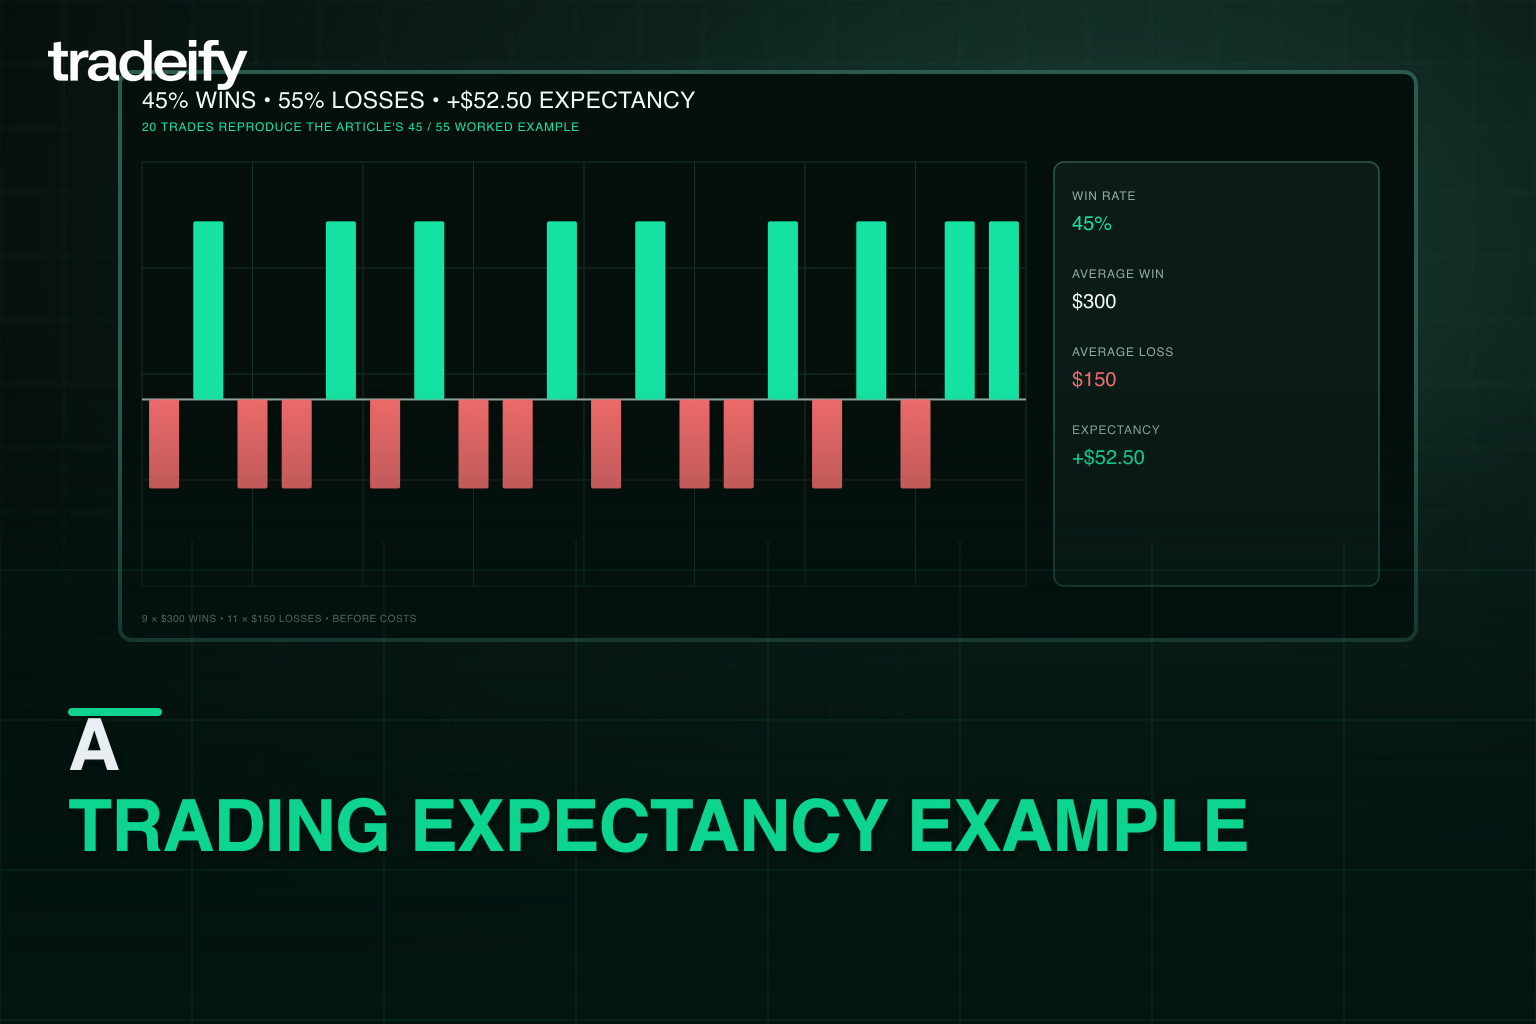
Assume a strategy produced 100 trades with these results:
- 45 winning trades
- 55 losing trades
- $300 average win
- $150 average loss
The win rate is 45%, and the loss rate is 55%.
Expectancy = (0.45 × $300) − (0.55 × $150)
Expectancy = $135 − $82.50 = $52.50 per trade
Across 100 trades, the expected net result based on that sample is:
100 × $52.50 = $5,250
That number describes the sample average, not a guaranteed outcome for the next 100 trades. The sequence can include long losing streaks, uneven monthly results, and drawdowns even when the long-run expectancy is positive.
Trading costs also matter. If commissions, fees, spread, and slippage average $12 per round trip, net expectancy falls to:
$52.50 − $12 = $40.50 per trade
Costs should be included before using expectancy to compare systems or set risk.
How to calculate trading expectancy from a journal
A trading journal should contain enough data to calculate expectancy without guesswork. At minimum, record the setup, entry, exit, position size, gross P&L, commissions, fees, slippage, and initial risk.
Use this process:
- Select a clean group of trades from the same strategy and rule set.
- Calculate net P&L for every trade after all trading costs.
- Count winning, losing, and break-even trades using a fixed classification rule.
- Divide the number of wins by the included trade count to get win rate.
- Divide total net winning P&L by the number of wins to get average win.
- Divide the absolute value of total net losing P&L by the number of losses to get average loss.
- Insert the four figures into the expectancy formula.
As a cross-check, divide total net P&L by the number of included trades. The result should match expectancy when the same trades and classification rules are used.
Do not combine unrelated setups too early. A profitable opening-range strategy can hide a losing midday strategy when both are grouped into one account-level figure. Calculate account expectancy for a broad view, then segment the data by setup, instrument, time of day, direction, and market condition.
What a good trading expectancy looks like
There is no universal dollar amount that defines good trading expectancy. A $50 average may be strong for one position size and weak for another. The number must be judged relative to risk, trading costs, drawdown, sample size, and how often the opportunity occurs.
The first threshold is simple:
- Negative expectancy: The measured process loses money per trade.
- Zero or near-zero expectancy: Costs and small execution changes can erase the edge.
- Positive expectancy: The measured process earns money per trade over the sample.
A useful comparison is expectancy divided by the average amount initially risked. If a strategy averages $40 per trade while risking $200, its expectancy is 0.20R, or 20% of initial risk per trade. Expressing the result in R makes different instruments and position sizes easier to compare.
Quality also matters. A stable 0.15R expectancy across several hundred well-documented trades may be more dependable than 0.50R generated by 20 trades or one unusually large winner.
Trading expectancy in R-multiples
An R-multiple expresses each result relative to the trade's initial planned risk. If initial risk is $200, a $400 winner equals +2R and a full-stop loss equals -1R.
The same formula works with R values:
Expectancy in R = (Win Rate × Average Win in R) − (Loss Rate × Average Loss in R)
Suppose a strategy has:
- 40% win rate
- 1.8R average win
- 60% loss rate
- 0.9R average loss
The calculation is:
(0.40 × 1.8R) − (0.60 × 0.9R) = 0.18R per trade
If the trader normally risks $250 per trade, the estimated dollar expectancy is:
0.18 × $250 = $45 per trade
R-based expectancy helps separate strategy quality from position size. It also makes it easier to compare a futures setup with a different futures contract or a different risk budget.
Trading expectancy vs profit factor
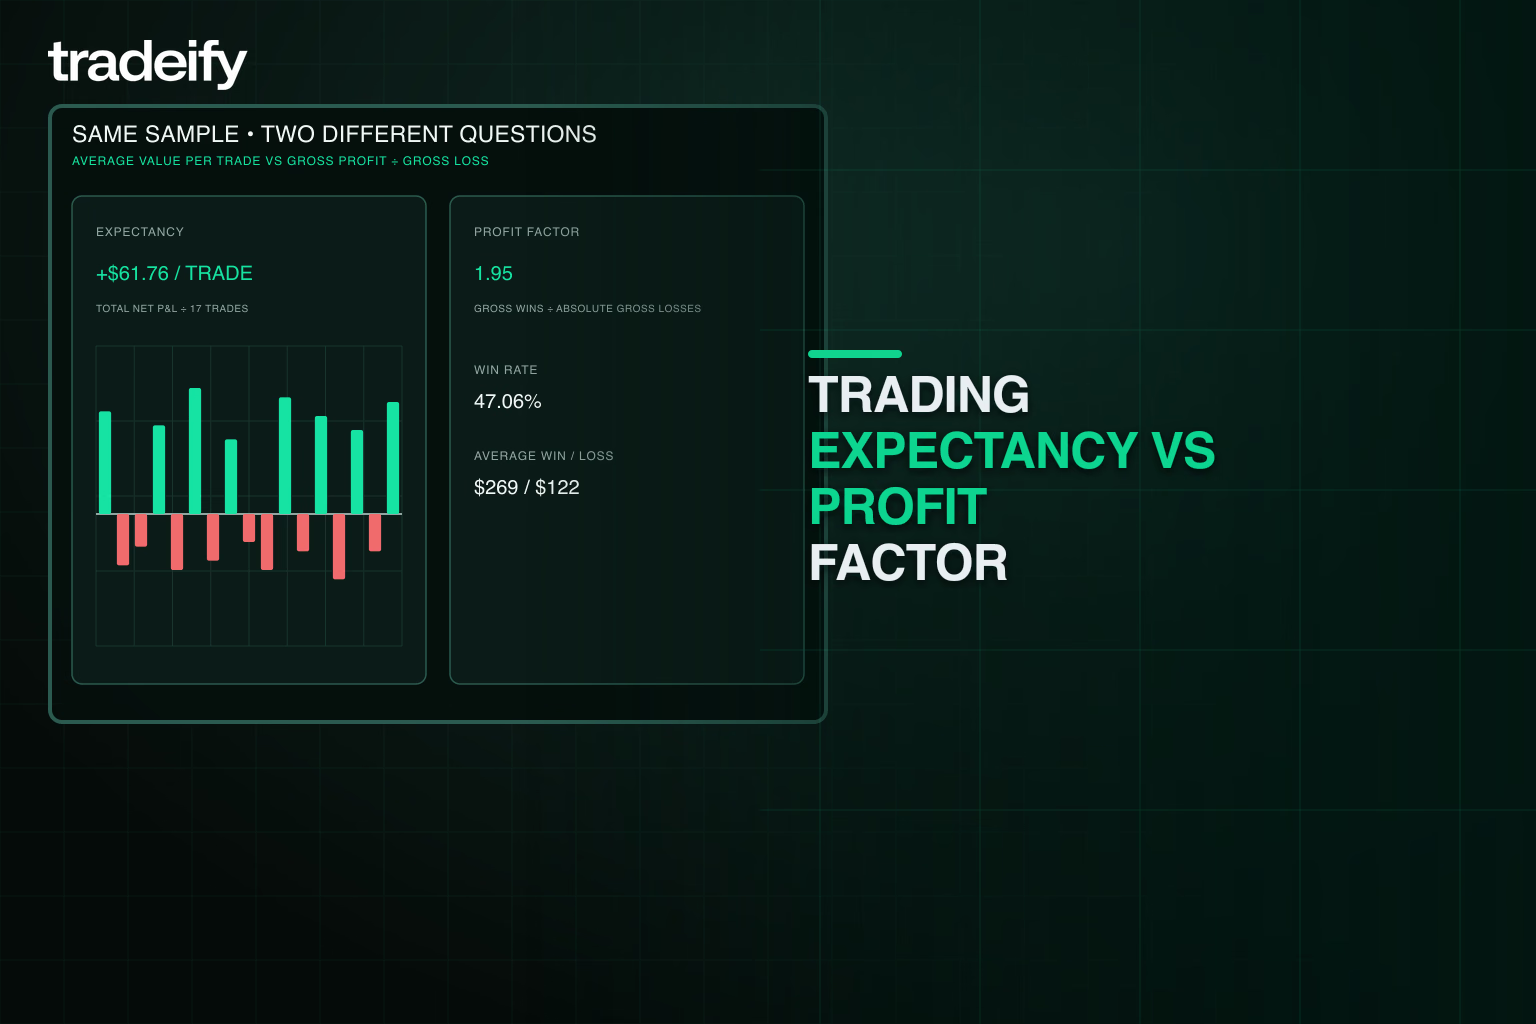
Expectancy and profit factor describe related parts of performance, but they answer different questions.
Metric | Formula | Main Question |
|---|---|---|
Expectancy | Total net P&L ÷ number of trades | What is the average result per trade? |
Profit factor | Gross profit ÷ absolute gross loss | How many dollars were earned for each dollar lost? |
Win rate | Winning trades ÷ total trades | How often did the strategy win? |
Average win-loss ratio | Average win ÷ average loss | How large were wins relative to losses? |
A profit factor above 1 means gross profit exceeded gross loss over the sample. Positive expectancy means average net P&L per trade was above zero. Both can describe the same profitable sample, but expectancy is easier to translate into an average trade value or R-multiple.
Neither metric shows the order of returns. Two strategies can share the same expectancy and profit factor while producing very different maximum drawdowns and losing streaks. Review them alongside drawdown, return variability, trade frequency, and rule adherence.
How many trades trading expectancy needs
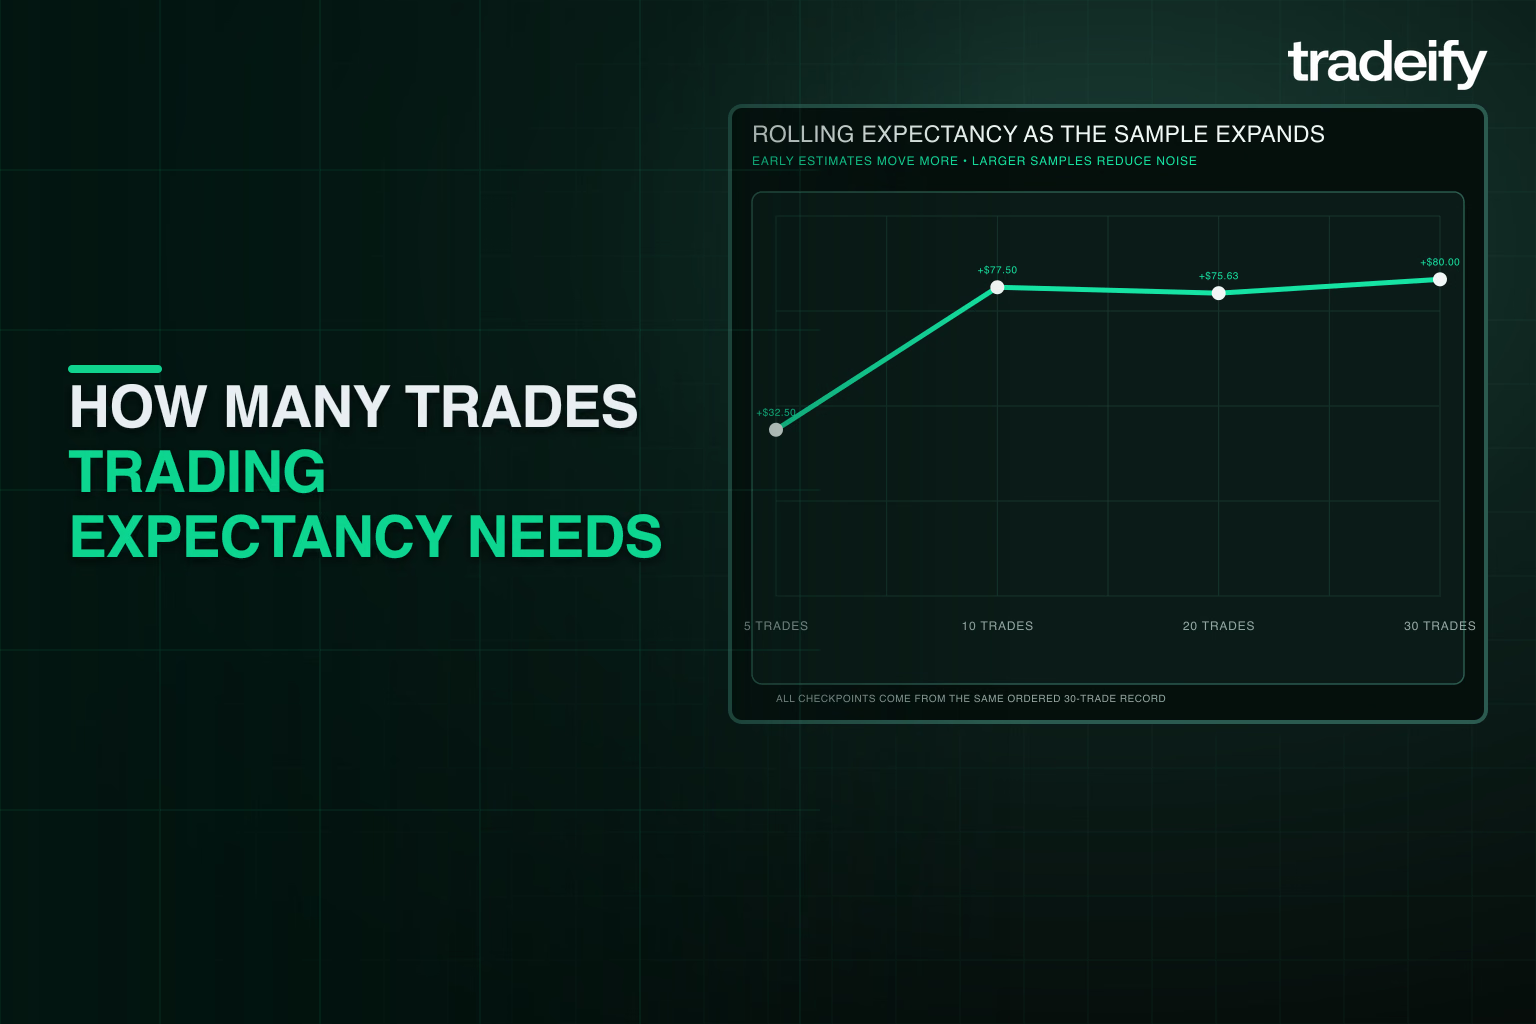
There is no fixed trade count that makes expectancy reliable for every strategy. The required sample depends on how variable the outcomes are and whether the market conditions represented in the sample are relevant to current trading.
Twenty trades may be enough to spot an obvious problem, but it is usually too small a sample for a firm conclusion. Fifty to 100 trades can provide an initial reading for one narrowly defined setup. Several hundred trades across different conditions provide a more credible estimate, especially when returns include occasional large winners or losses.
Use rolling samples instead of relying only on a lifetime average. For example, compare the last 50 trades, last 100 trades, and full history. If short-term expectancy deteriorates while the long-term number remains positive, investigate execution and market conditions before assuming the edge is intact.
Confidence intervals, bootstrapping, and Monte Carlo analysis can estimate how much the result might vary. Even without advanced statistics, a trader can improve the estimate by using more trades, keeping the strategy definition consistent, and separating dissimilar setups.
Why trading expectancy changes
Expectancy is not permanent. It can change when the strategy, execution, costs, or market behavior changes.
Common causes include:
- Market regime: A trend-following setup may perform differently in a range-bound market.
- Volatility: Stop distance, target distance, slippage, and opportunity frequency can shift as volatility changes.
- Time of day: Results near the open may differ from midday or closing-session results.
- Instrument selection: The same entry logic can produce different outcomes across contracts.
- Execution drift: Late entries, early exits, missed stops, and inconsistent sizing alter the original strategy.
- Trading costs: Higher fees, spread, or slippage reduce net expectancy.
- Rule changes: Adjusting filters, targets, stops, or position management creates a new version of the strategy.
Tag these variables in a journal and calculate segmented expectancy. A positive overall number can hide a weak market regime, an unprofitable time window, or a recurring execution mistake.
How to improve trading expectancy
Expectancy improves when win rate rises, average win rises, average loss falls, or trading costs fall. The best adjustment is usually the one supported by journal data and compatible with the strategy.
Start with the largest repeatable drag:
- Remove setups with persistently negative expectancy after a sufficient sample.
- Filter time windows or market conditions that repeatedly underperform.
- Reduce oversized losses by following the planned stop and position size.
- Test whether partial exits cut average wins more than they reduce variability.
- Review winning trades for exits that consistently leave planned profit uncollected.
- Reduce avoidable commissions and slippage without sacrificing execution quality.
- Separate valid losses from rule-breaking losses and fix process errors first.
Avoid changing several variables at once. A new entry filter, tighter stop, and different target create a different strategy and make it hard to identify which change helped. Test one defined adjustment on enough trades, then compare its expectancy and drawdown with the original version.
Trading expectancy mistakes to avoid
Expectancy is simple to calculate, but it is easy to misuse.
Ignoring trading costs in expectancy
Gross results can make a high-frequency strategy look profitable when costs consume its small edge. Use net P&L after commissions, fees, spread, and realistic slippage.
Trusting a small trading sample
A few large winners can inflate expectancy, while a brief losing streak can make a sound strategy appear broken. Review the trade count and return distribution before acting on the number.
Mixing different trading strategies
Combining every trade into one calculation can hide which setups create or destroy value. Segment results while keeping an account-level summary.
Treating trading expectancy as a guarantee
Positive expectancy does not promise a profitable day, week, or next trade. It describes the average of a measured sample and still allows for variance and drawdown.
Optimizing trading expectancy without drawdown
A strategy can show attractive expectancy and still carry unacceptable losing streaks, tail risk, or position concentration. Evaluate expectancy with maximum drawdown and risk limits.
Using inconsistent trading data
Changing how wins, losses, break-even trades, fees, or partial exits are recorded makes comparisons unreliable. Use one method across the full sample.
Trading expectancy questions
What is the formula for expectancy?
The trading expectancy formula is (Win Rate × Average Win) − (Loss Rate × Average Loss). Use decimal win and loss rates and enter average loss as a positive magnitude.
What is positive expectancy in trading?
Positive expectancy means a strategy produced an average net gain per trade over the measured sample. It suggests an edge but does not guarantee future profits.
What is a good expectancy ratio in trading?
There is no single good ratio for every trader. Expectancy should be positive after costs and meaningful relative to initial risk. Expressing it in R, such as 0.15R per trade, makes strategies easier to compare.
Can a low win-rate strategy have positive trading expectancy?
Yes. A low win rate can produce positive expectancy when average wins are sufficiently larger than average losses. A 40% win rate with a 3-to-1 average win-loss ratio can be profitable.
Can a high win-rate strategy have negative trading expectancy?
Yes. A high win rate can still lose money when occasional losses are much larger than the typical win. Win rate should always be reviewed with average win and average loss.
Is trading expectancy the same as expected return?
They are related but not always presented the same way. Trading expectancy usually refers to the average dollar or R result per trade. Expected return may be expressed as a percentage over a period or for an investment.
How often should trading expectancy be recalculated?
Recalculate it during a regular review cycle and after a meaningful new batch of trades. Rolling 50-trade and 100-trade views can reveal changes that a lifetime average hides.
Use trading expectancy as a decision tool
The trading expectancy formula turns win rate and payoff size into a single average result. Its real value comes from how the number is used. Calculate it with net data, normalize it in R, segment it by setup and condition, and compare rolling samples over time.
A positive number is a starting point, not final proof. The stronger case is positive expectancy supported by enough trades, consistent execution, manageable drawdown, and results that remain stable across relevant market conditions.
.svg)
.svg)
.svg)
.svg)








.webp)