




TL;DR: Break of structure trading works better as a filter than as an entry signal, because most breaks get closed back inside the level. In a study of 269 hourly ES and NQ breaks, only 17.10% held for 60 bars. Wick-only breaches held far less often, and breaks still within half an ATR of the level three bars later almost never held.
A break of structure (BOS) is one of the first ideas anyone learns in price action, ICT or smart money concepts. Price closes above the last swing high in an uptrend, the trend is "confirmed", and it feels like the trade is on.
The definition is easy. The trouble is the step after it. The continuation a break promises is usually assumed, not measured, and that assumption is what has you buying the high right before it gets closed back inside. This guide covers the definition, the market structure underneath it, the rules for a valid break, and how BOS fits with change of character and market structure shift. It also reports what happened on 269 real breaks in ES and NQ hourly futures, plus a cross-check on a second data series, so you can see how often a break of structure actually delivered the continuation it is supposed to confirm.
What a break of structure is
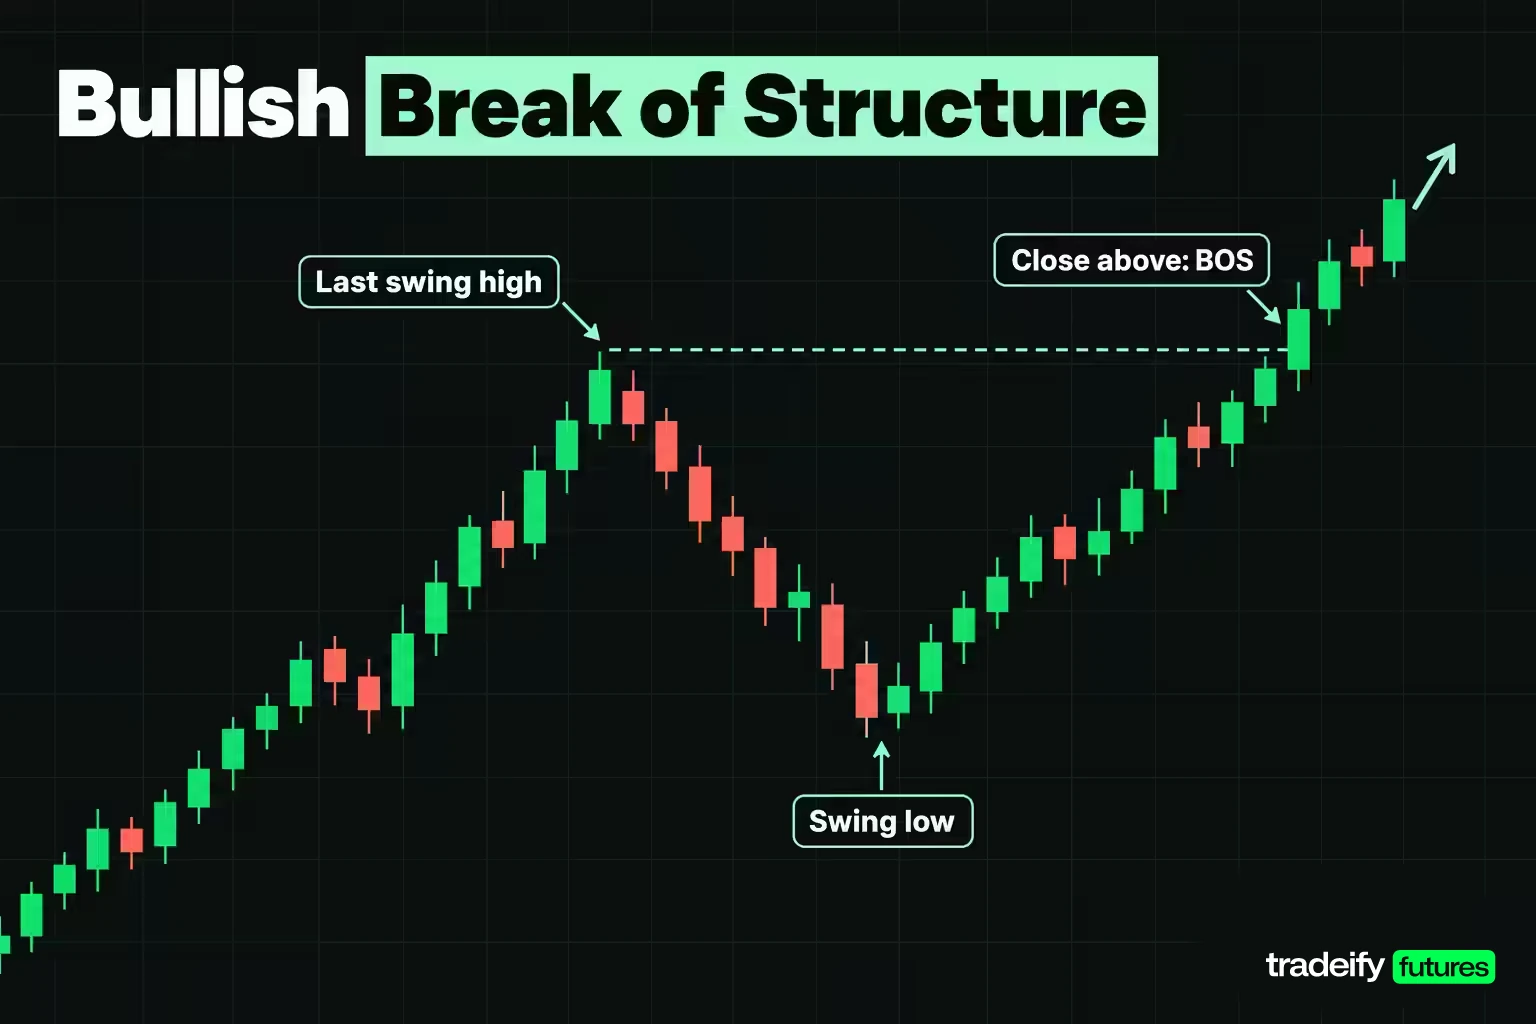
A break of structure is a candle close beyond the most recent swing point in the direction of the existing trend. In an uptrend that means a close above the last swing high. In a downtrend it means a close below the last swing low.
The claim a break of structure makes is continuation. Buyers pushed price to a high, sellers pulled it back, and buyers then took out that high. If the sequence repeats, the trend is intact.
That is the whole idea, and it applies the same way to futures, forex, stocks and crypto. A break of structure in forex is read on the same swing highs and lows as one in ES. What changes between markets is the session schedule and the size of a normal bar, not the concept.
Two things a break of structure is not:
- It is not a reversal signal. A close through structure against the trend is a change of character, a different event.
- It is not a guarantee. A break says the trend was intact on that close. It says nothing about the next bar.
Related lesson: Market structure highs, lows and trends
Market structure behind a break of structure
Market structure is the sequence of swing highs and swing lows on a chart. An uptrend prints higher highs and higher lows. A downtrend prints lower highs and lower lows. A range prints neither consistently.
Swing highs, swing lows and the confirmation lag
Every break of structure depends on how you define a swing. The rule used in the measurements in this guide is common and easy to apply:
- A swing high is a bar whose high is above the highs of the two bars on each side.
- A swing low is a bar whose low is below the lows of the two bars on each side.
- A swing is only usable two bars after it prints, because the two bars on its right have to exist first.
That two-bar lag matters more than it looks. On a finished chart every swing high is obvious. In real time, the high you think is a swing may still be forming, and the temptation is to draw it anyway. A break of structure rule that waits for the swing to be confirmed is the only version you can actually run live.
Internal and external structure
Many traders separate two layers of market structure:
- External structure is the larger swing points that define the main trend on your chart, the highs and lows everyone can see.
- Internal structure is the smaller swings inside a pullback or leg, often only visible on a lower timeframe.
An internal break of structure inside a pullback can line up with the main trend or fight it. A common approach is to take direction from external structure and use internal breaks only for timing. Mixing the two without labelling them is how a chart ends up with a dozen "breaks" pointing in different directions.
How to identify a valid break of structure
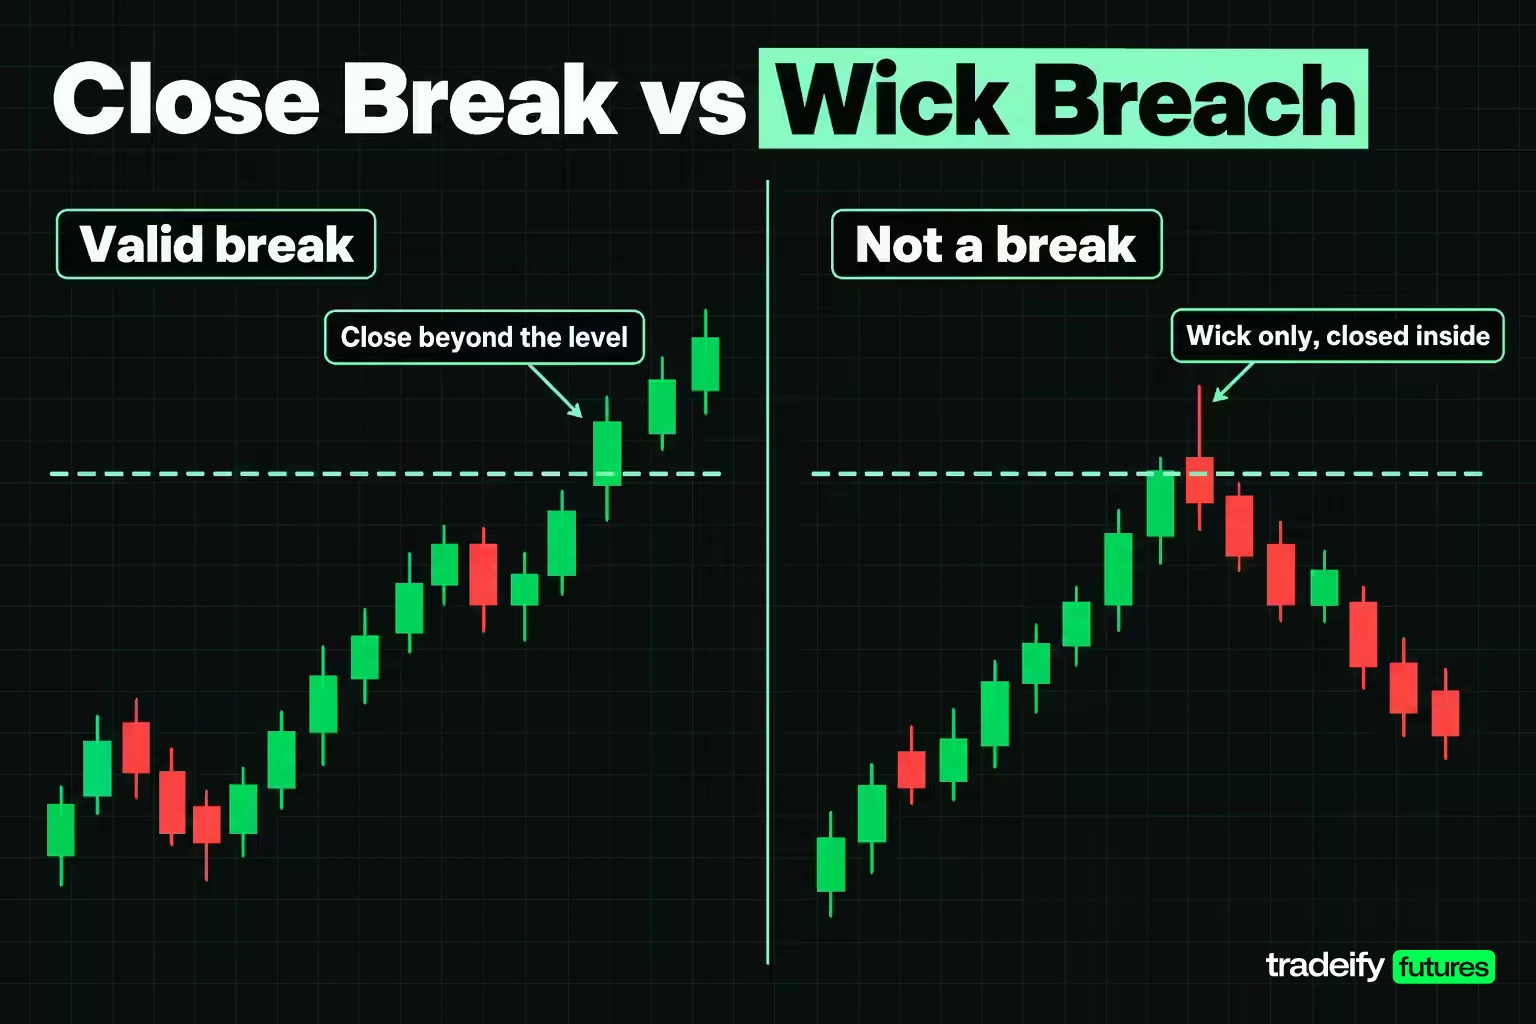
Most competing definitions agree on a short list of rules for a valid break of structure. These are also the rules used in this guide's own hourly ES and NQ measurements.
- The swing point must be confirmed before the break. A level that was not yet a confirmed swing cannot be broken.
- The bar must close beyond the level. A wick through the level that closes back inside is not a break.
- The break should be in the direction of the existing structure. A close through structure against the trend is a change of character.
- The opposite side should still be intact. A bullish break of structure loses its meaning once price closes below the swing low that preceded it.
Why the close rule matters
The close-versus-wick rule for a break of structure is repeated everywhere and almost never quantified. This guide's own study of 269 hourly ES and NQ breaks (April 2024 to September 2026, two-bar swings, 60-bar hold window) also logged 251 levels that were traded through without a close beyond them. Of those wick-only breaches, 5.18% held, and 94.82% were closed back inside later. Close breaks held 17.10% of the time.
A cross-check this guide ran on Yahoo Finance hourly ES and NQ data found the same split. There, 539 wick-only levels held 6.31% of the time, against 16.65% for close breaks. Waiting for the close does not make a break reliable. It does cut out a group that almost never continued.
Related lesson: Support and resistance
What 269 ES and NQ structure breaks actually did
This is the part most break of structure guides skip: how often does the continuation actually happen?
How the breaks were measured
This guide's primary break of structure study (Study A) used continuous front-month ES and NQ hourly bars from 24 April 2024 to 16 September 2026, 13,779 bars of ES and 13,778 of NQ, with incomplete bars dropped. It used these rules:
- Swing high: a bar whose high is above the two bars on each side, usable two bars later.
- Break of structure: the first bar to close above the most recent unbroken confirmed swing high.
- Held: no later bar closed back below the level within the next 60 hourly bars.
- Failed: a bar closed back below the level inside that window.
- Distances in average true range (ATR) on the same hourly bars, so ES and NQ can be compared.
That produced 269 close breaks, 141 in ES and 128 in NQ. It is an illustrative historical study on two correlated index futures in one market regime, not a forecast.
The hold rate
| Study A result, hourly bars | ES | NQ |
|---|---|---|
| Close breaks | 141 | 128 |
| Median close beyond the level | 2.75 points | 15.75 points |
| Median adverse move against the break | 3.24 ATR | 3.33 ATR |
| Median hourly ATR | 8.68 points | 43.90 points |
In this guide's Study A, 46 of the 269 breaks held across both markets, a 17.10% hold rate. Four breaks in five were closed back inside the level within 60 bars.
The median break closed only a few ticks beyond the level in ES, and the median move against the break was more than three ATR. A trader who bought every break of structure and held would have spent most of the time underwater.
Two notes keep the number honest. The 60-bar window is a definition, and a longer window would count more holds while asking you to sit through more adverse movement. And "held" is not the same as "tradeable", which the worked examples later make concrete.
The extension at the third bar
If four breaks of structure in five fail, the useful question is which one in five belongs to the other group. In this guide's Study A of 269 ES and NQ hourly breaks, the measurement that separated them was how far price had travelled beyond the level three bars after the break, in ATR.
- Breaks still within 0.5 ATR of the level three bars later held 3.57% of the time in ES and 0.00% in NQ.
- Breaks that had reached 2 ATR or more held 37.14% of the time in ES and 39.02% in NQ.
Read that as a filter, not a signal. It removes the group that almost never held, which was most of the population. It does not make a strong break safe, because roughly three in five of the strong-extension group still failed.
A cross-check on a second data series
To test whether these patterns were specific to one dataset, the same rules were rerun on 4 November 2026 on a separately sourced hourly series: Yahoo Finance's continuous ES=F and NQ=F data from 6 November 2024 to 16 September 2026, 10,600 bars each. This run reset the level at every newly confirmed swing high, which counts many more minor breaks, used a 14-bar ATR, and excluded any break whose 60-bar window touched the ten days before a quarterly expiry, because that series splices contracts there.
| Study B cross-check | ES | NQ | Both |
|---|---|---|---|
| Close breaks | 444 | 463 | 907 |
| Held for 60 bars | 16.22% | 17.06% | 16.65% |
| Wick-only levels that held | 5.64% | 6.96% | 6.31% |
| Held when under 0.5 ATR at bar three | 4.07% | 5.20% | 4.64% |
| Held when 2 ATR or more at bar three | 39.22% | 49.15% | 44.55% |
| Level retested within 60 bars | 94.37% | 92.22% | 93.27% |
The counts differ because the level rule differs, but the shape is the same. Roughly one break in six held, wicks held about a third as often as closes, and the third-bar extension sorted the breaks the same way.
Two ES breaks of structure printed bar by bar
Both break of structure examples come from Yahoo Finance's ES=F hourly series (continuous E-mini S&P 500 futures), using a two-bar swing rule, with times in Eastern Time and each bar labelled by its opening hour. The entry is the close of the break bar and the stop sits one tick below the last confirmed swing low. ES is $50 per point, so one tick of 0.25 is $12.50, and Micro E-mini S&P 500 (MES) is $5 per point.
A break of structure that held on 24 October 2025
- The level was the 2:00 AM bar high at 6,798.25.
- The 5:00 AM bar traded to 6,798.75 and closed at 6,794.50. The 7:00 AM bar traded to 6,799.75 and closed at 6,797.50. Two wicks, no break.
- The 8:00 AM bar closed at 6,812.75, 14.50 points beyond the level. With a 14-bar ATR of 8.73 points, that is 1.66 ATR.
- Three bars later, the 11:00 AM bar closed at 6,835.75, 37.50 points beyond the level, or 4.30 ATR.
- Over the next 60 bars the lowest close was 6,823.00 and the lowest low 6,812.50. Price never returned to the level, and the highest high in the window was 6,944.75.
The last confirmed swing low was the 4:00 AM bar low at 6,784.00, so the stop sat at 6,783.75. Risk was 29.00 points, 116 ticks, $1,450 per ES contract or $145 per MES. A 2R target at 6,870.75 was reached inside the window.
The two wicks before the break are the detail to remember. Buying the first poke through 6,798.25 would have meant watching it close back inside twice before the real break printed. Waiting for the close cost a few points of entry and saved two bad starts.
A break of structure that failed on 29 October 2025
This second example uses the same ES=F hourly series, entry at the break close and a stop one tick below the last confirmed swing low.
- The level was the 4:00 AM bar high at 6,947.50.
- The 7:00 AM bar traded to 6,948.50 and closed at 6,943.00, a wick.
- The 9:00 AM bar closed at 6,950.50, only 3.00 points beyond the level. With an ATR of 7.86 points, that is 0.38 ATR.
- The 10:00 AM bar closed at 6,938.00, back inside the level on the very next bar.
- The third bar, at 12:00 PM, closed at 6,940.00, 7.50 points below the level, and traded down to 6,929.75.
The last confirmed swing low was the 5:00 AM low at 6,930.75, so the stop sat at 6,930.50. Risk was 20.00 points, 80 ticks, $1,000 per ES contract or $100 per MES, and the stop was hit on the third bar. Over the next 60 bars price closed as low as 6,853.75, 93.75 points below the level.
This is the break that looks fine on the close and falls apart one bar later. It barely cleared the level, and by bar three it was back below it. Breaks under half an ATR beyond the level at bar three held under 5% of the time in this guide's hourly ES and NQ studies. The third-bar filter would have kept you out. The close rule alone would not.
Break of structure trading strategies
There are three common ways to trade a break of structure. Each answers the same question differently: when is the break real enough to act on?
Entering on the break close
The simplest break of structure entry is buying the close of the bar that closes above the swing high, with a stop below structure and a fixed reward target.
In this guide's study of 269 hourly ES and NQ breaks, that rule (entry at the break close, stop one tick below the break bar low, 2R target, 60-bar horizon) resolved 261 trades. 34.10% reached the 2R target, against the 33.33% a 2R target needs to break even before costs. In other words, the raw break produced roughly a breakeven coin flip before commissions and slippage.
Entering on the retest
The second approach waits for price to come back to the broken level and hold it. The retest is close to automatic. In this guide's study of 269 hourly ES and NQ breaks, about nine breaks in ten came back to touch the level, with a median wait of one bar. In the guide's cross-check on Yahoo Finance hourly data, 93.27% of breaks were retested within 60 bars.
The retest also tends to overshoot. The median retest traded 1.83 ATR past the level in ES and 1.77 ATR in NQ. So a retest entry needs a rule for what counts as holding, usually a close back above the level after the dip, not just a touch.
Related lesson: Pullback trading
Filtering a break of structure by extension
The third approach waits three bars after the break of structure and only trades breaks that have moved decisively away from the level. In practice that means skipping any break still within about half an ATR of the level at bar three, and treating breaks that reach 2 ATR or more as the candidates.
The cost is a later entry and a wider distance to any structural stop. The benefit is avoiding a group that held under 5% of the time in both of this guide's hourly ES and NQ studies (3.57% and 0.00% in Study A, 4.64% in the Yahoo Finance cross-check).
Where the stop goes
Stop placement on a break of structure is a tradeoff between distance and survival:
- In this guide's study of 269 hourly breaks, a stop one tick below the break bar low was touched on 65.96% of ES breaks and 61.72% of NQ breaks.
- In the same study, a stop one tick below the last confirmed swing low was touched on 47.52% of ES breaks and 46.09% of NQ breaks.
The wider stop survived more often but carried about four times the median risk. At the median ATR in that study, one ATR of stop distance was $434 per ES and $43.40 per MES, or $878 per NQ and $87.80 per Micro E-mini Nasdaq-100 (MNQ). Size from that dollar figure, not from the tick count.
Neither stop is "safe". Both are structural, and both get hit a lot. Pick the convention before entry. The worst version is the one most traders slip into: a tight stop on the way in, then a wider one once the trade starts going wrong.
Related lesson: Stop-loss orders and placement
Targets and management
Common targets are a fixed multiple of risk (2R is typical), the next external swing high, or a trailing stop under each new higher low. A trailing approach fits the logic of market structure: the trade stays on while the structure that justified it stays intact, and ends when it does not.
Break of structure vs change of character and MSS
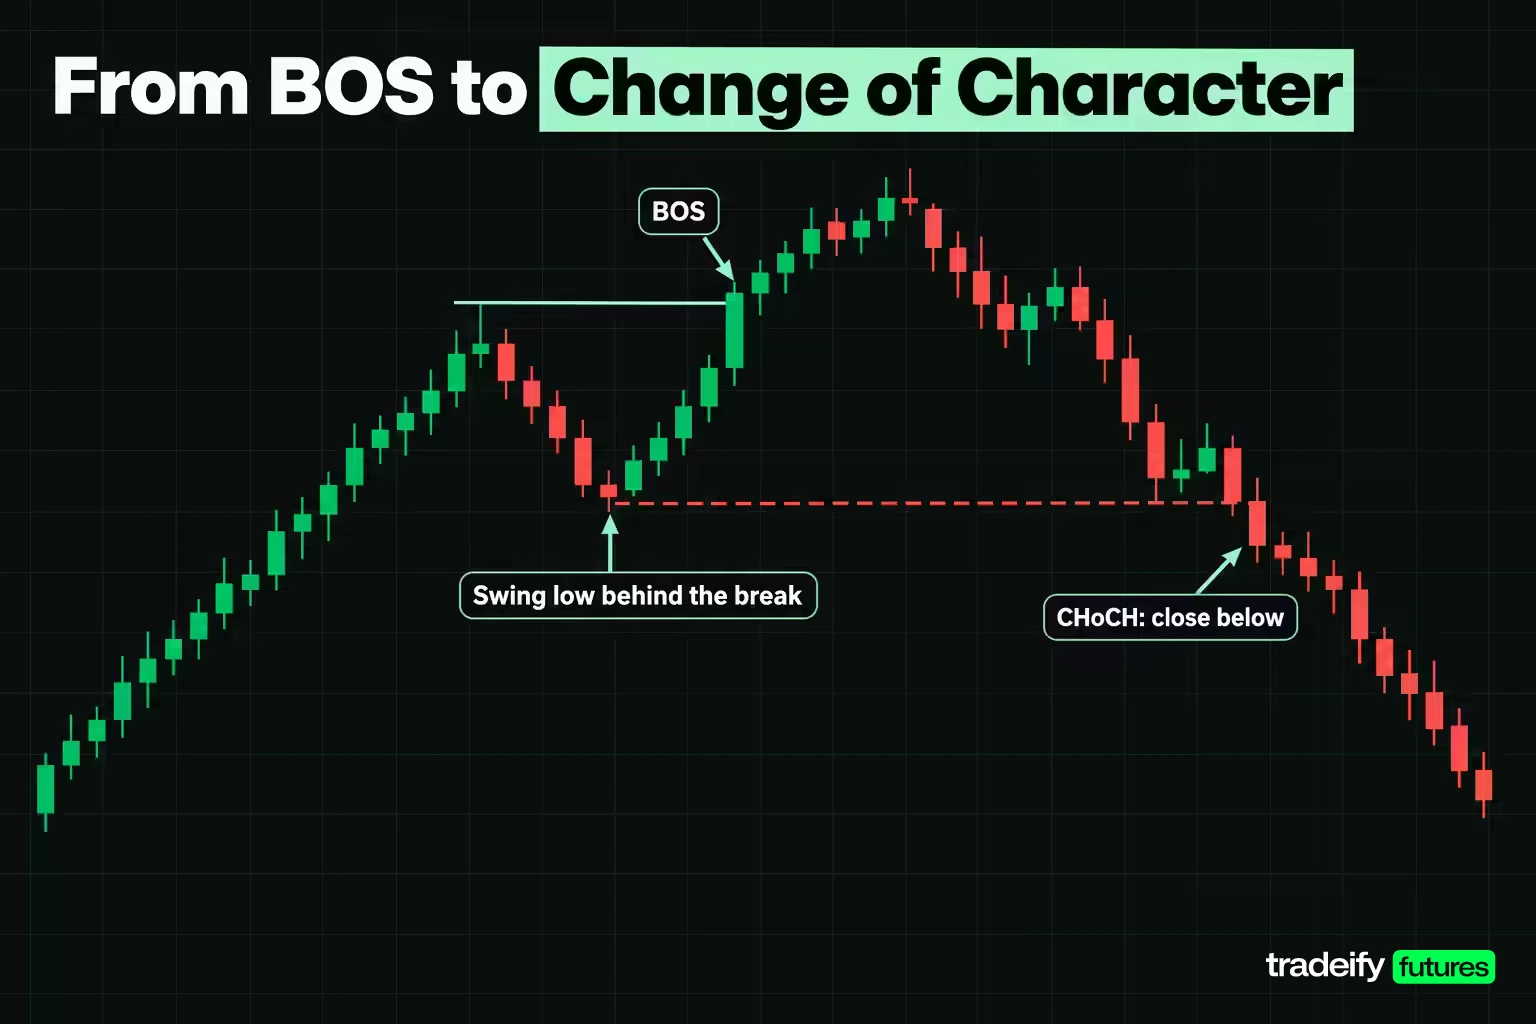
A break of structure, a change of character (CHoCH) and a market structure shift (MSS) are often used as if they were the same thing. They are not.
| Structure event | What happens | What it suggests |
|---|---|---|
| Break of structure (BOS) | Close beyond the last swing point in the trend's direction | The trend is continuing |
| Change of character (CHoCH) | First close through the opposite swing point, against the trend | The trend may be ending |
| Market structure shift (MSS) | A CHoCH-style break, usually after a liquidity sweep and with strong displacement | A reversal is underway, in ICT terms |
Trading break of structure and CHoCH together
A break of structure and a change of character are a sequence. In this guide's study of 269 hourly ES and NQ breaks, 41.84% of ES breaks and 41.41% of NQ breaks were later followed by a close below the swing low that preceded the break, at a median of 18 bars. That opposite close is a change of character. None of the 46 breaks that held saw it inside the 60-bar window.
That gives a clean working rule. A bullish break of structure stays a continuation event only while the swing low behind it holds. Once price closes below that low, the continuation case is over, whatever the chart label says. Many traders use the sequence directly: a CHoCH on a lower timeframe warns that a pullback may be finishing, and a fresh BOS in the higher-timeframe direction is the confirmation.
What an MSS trading strategy is
An MSS strategy looks for a reversal rather than a continuation. The typical sequence is a sweep of liquidity beyond a prior high or low, then a strong move back through the most recent opposite swing point, then an entry on a pullback into the move. The difference from a plain CHoCH is mostly emphasis on the sweep and the strength of the break.
Related lesson: Change of character (CHoCH)
The ICT approach to break of structure
In ICT (Inner Circle Trader) and smart money concepts teaching, a break of structure is read together with liquidity rather than on its own. The usual framing runs like this:
- Resting orders, called liquidity, sit above old highs and below old lows.
- Price often runs one side of that liquidity before moving the other way.
- A break of structure with displacement, meaning a fast, large-bodied move, is treated as stronger than a slow grind through the level.
- Entries are usually taken on a pullback into an imbalance such as a fair value gap or an order block left by the displacement move, rather than at the break close.
There is a testable idea inside that framing. "Displacement" is close to measuring extension three bars after the break. In this guide's hourly ES and NQ studies, breaks that moved two ATR or more away from the level by bar three held far more often than breaks that barely cleared it. What the ICT framing adds is a specific entry location. Whether that entry improves on the numbers here is something to measure on your own data, not to assume.
Related lesson: Liquidity sweeps and stop runs
Best timeframes and markets for break of structure trading
No timeframe is "best" for break of structure trading, and the studies in this guide do not rank them. Both used hourly bars.
What most traders do is stack timeframes:
- A higher timeframe (4-hour or 1-hour) for the direction of external structure.
- A lower timeframe (15-minute or 5-minute) for the entry, often on an internal break in the higher-timeframe direction.
Lower timeframes produce more breaks and more noise. Higher timeframes produce fewer, larger breaks with wider stops. Choose the timeframe whose normal stop distance your account and position size can carry, then measure your own hold rate on it.
Break of structure across markets and sessions
Break of structure analysis works in any liquid market with clean swings. Equity index futures such as ES and NQ trade nearly around the clock, and the overnight session often prints thin, small swings that get broken and reclaimed easily. Many futures traders give more weight to breaks during regular US hours, when volume is highest.
In forex, the concept is identical. The main differences are a 24-hour, five-day market split into Asian, London and New York sessions, and decentralized pricing, so swing points can differ slightly between data feeds.
Common break of structure mistakes
Most break of structure losses come from a short list of habits.
- Treating a wick as a break. In this guide's study of 269 hourly ES and NQ breaks, wick-only breaches held 5.18% of the time. Wait for the close.
- Marking a swing that is not confirmed. A swing high is not a level until the bars on its right exist. Drawing it early moves your break around.
- Putting the stop a tick under the level. In the same study, the median retest traded 1.83 ATR past the level in ES and 1.77 ATR in NQ. A stop inside that noise is likely to be hit.
- Ignoring the opposite side. A bullish break means little once price closes below the swing low before it.
- Trading every break the same way. Breaks still within half an ATR of the level three bars later almost never held. Breaks with clear extension held several times as often.
- Mixing internal and external structure. A small internal break against the main trend is not a trend change.
- Sizing from ticks instead of dollars. The structural stops in the two worked examples were 20.00 and 29.00 points, or $1,000 and $1,450 per ES contract.
Related lesson: Trade setups and confirmation
Break of structure on a funded or evaluation account
On a prop firm evaluation or funded account, a break of structure strategy runs inside rules that a personal account does not have: a daily loss limit, a trailing drawdown, contract limits and session closing times. Those rules change the math more than the chart does.
The biggest factor is how wide a structural stop is relative to the daily loss limit. If a swing-low stop costs $1,450 per ES contract, as it did in this guide's held ES example from 24 October 2025, any daily limit smaller than that cannot absorb a single full-size loss. Micros at $145 for the same stop, or a lower timeframe with tighter structure, are often the only way the strategy fits. Payouts on these accounts usually depend on staying inside those limits for many sessions, so a strategy whose breaks held 17.10% of the time in this guide's 269-break ES and NQ study needs a small, fixed risk per trade to survive its losing streaks. The 60-bar hold windows used in the studies also span several sessions, which a day-trading account may not allow.
On our accounts, every position must be closed by 4:45 PM ET on regular trading days, with no overnight or weekend holds, so a break of structure trade has to resolve inside a single session. Size is capped by contract limits (for example 4 minis or 40 micros on a 50K account), and our funded accounts are simulated.
Break of structure FAQ
What is break of structure in forex?
It is the same event as in any market: a close beyond the most recent swing high in an uptrend, or swing low in a downtrend. Forex traders often check it against the London and New York sessions, when most volume trades.
What is a MSS trading strategy?
A market structure shift strategy trades a reversal. It usually waits for a sweep of a prior high or low, then a strong close through the opposite swing point, then enters on a pullback into that move.
What is market structure trading and how does it work?
Market structure trading reads trend from swing highs and lows. Higher highs and higher lows mean an uptrend, lower highs and lower lows mean a downtrend, and breaks of those swings signal continuation or a possible change.
Is it true that 97% of day traders lose money?
In one market, yes: of 1,551 Brazilian futures day traders who persisted more than 300 days, 97% lost money. That figure comes from a study by Chague, De-Losso and Giovannetti of people who day traded Brazilian equity index futures. It is not a universal statistic, but it is a serious one.
What is a breakaway gap in trading?
A breakaway gap is a price gap that opens beyond a range or a key level and does not fill quickly, often at the start of a new trend. In nearly 24-hour futures, gaps mostly appear after the daily maintenance break or the weekend.
Is a break of structure a buy signal?
Not on its own. In this guide's hourly ES and NQ study only 17.10% of breaks held for 60 bars, so a break of structure is better used as a continuation filter, with the entry decided by a retest rule, an extension filter or another confirmation.
Futures are leveraged, and losses can exceed what you planned to risk when a market gaps or moves fast. The studies in this guide use historical prices, per contract, without commissions or slippage, and they do not predict future results. Evaluation and funded accounts at prop firms are simulated. This guide is educational and is not investment advice.
Related lesson: Risk management for traders


