



TL;DR: Pullback trading means buying a temporary dip inside an uptrend, and the real decision is how deep a dip you wait for. Across 169 ES and NQ pullbacks from 2016 to 2026, the median dip ran 3.38 ATR and lasted 5 sessions. Dips under 3.5 ATR usually made a new high; dips of 5 ATR or more rarely did. Once a pullback trade was 1.5 ATR offside, only 16.7% still reached the prior high.
Pullback trading is the habit of buying strength on sale. A market trends up, gives back part of the move, and you try to get in during that give-back instead of chasing the high.
The idea is simple. The execution is not, because every pullback looks identical to the start of a reversal on the day it begins. The question that decides the trade is not which indicator you use. It is how deep you let the dip run before you buy, and how far against you it can go before you admit it is no longer a pullback.
This guide answers that question about pullback trading with measurement. It uses ten years of daily E-mini S&P 500 (ES) and E-mini Nasdaq-100 (NQ) futures bars, plus crude oil and gold for comparison, to show how deep pullbacks actually run, which entry depths held up, and where the losing trades separated from the winners.
What Pullback Trading Means
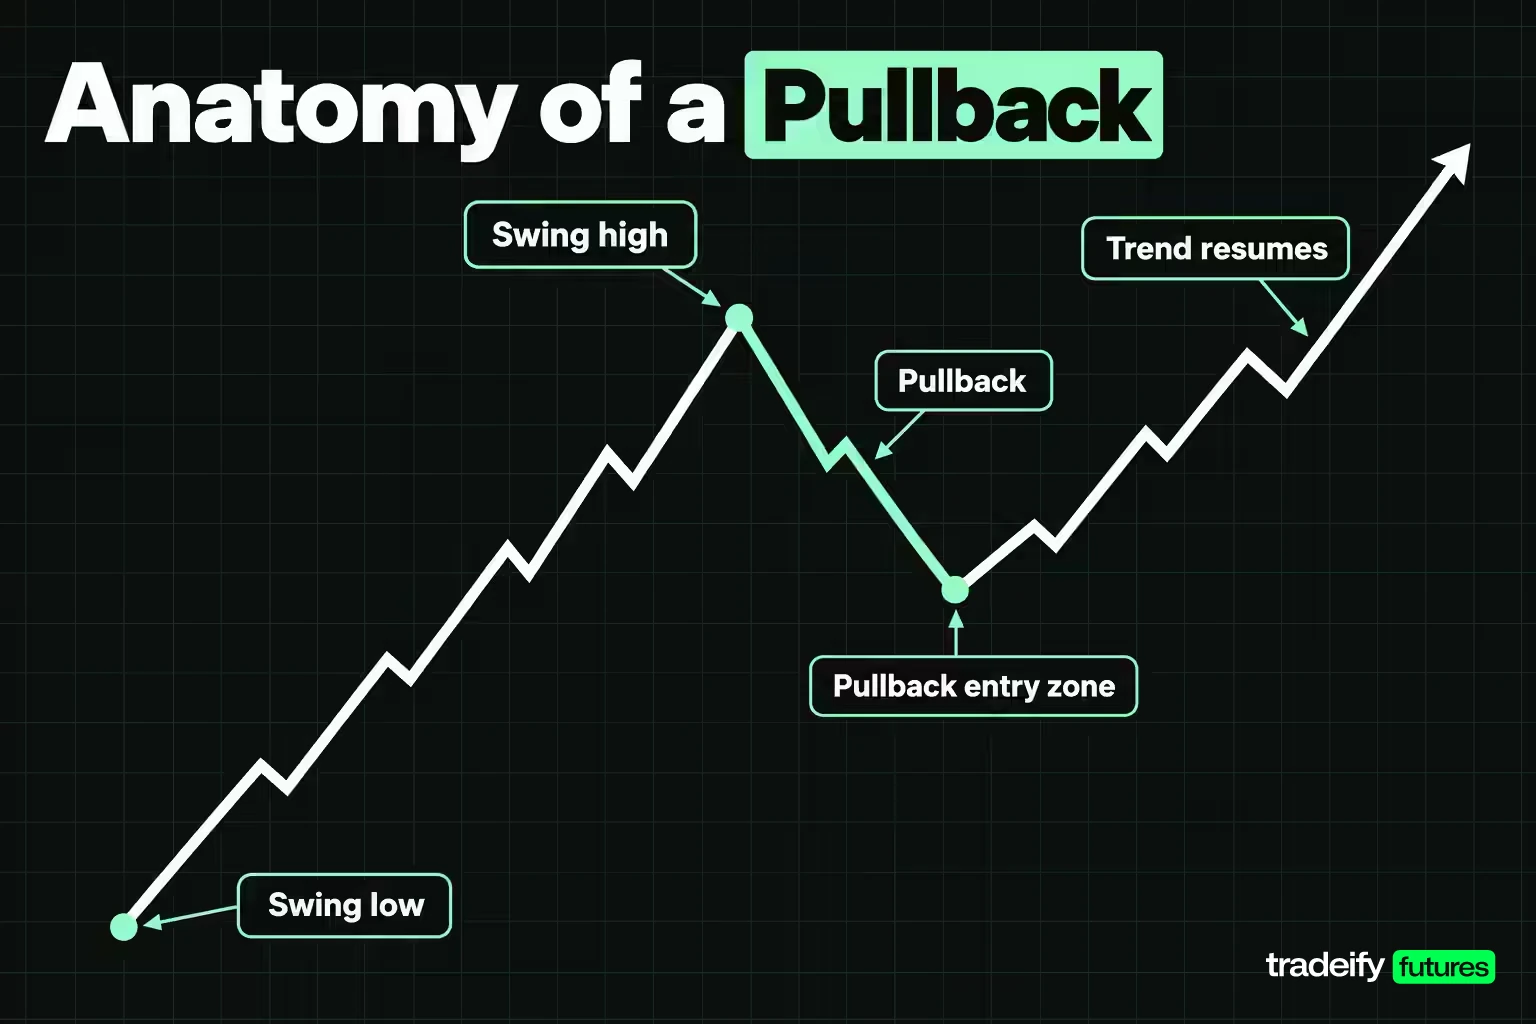
A pullback is a temporary move against the prevailing trend. In an uptrend, price rallies from a swing low to a swing high, then slips back before the trend resumes. Pullback trading is the strategy of entering in the direction of the trend during that slip, on the theory that the trend is still intact and you are buying at a better price than the high.
In a downtrend the logic flips: a pullback is a bounce, and the pullback trader sells it. This guide uses the uptrend version throughout because it is the more common one, but every rule mirrors for shorts.
Four related words get used loosely, and it helps to separate them:
- Pullback. A pause or dip against the trend that ends with the trend continuing.
- Retracement. The same move described as a measurement, usually a share of the prior leg (a 50% retracement gave back half the rally).
- Correction. A larger, slower pullback. In stocks the word is usually defined as a decline of 10% or more from a recent peak, which is a convention rather than a rule.
- Reversal. A change in the direction of the larger trend. On day one a reversal and a pullback look the same.
In the share market, a pullback is usually described as a stock or index slipping a few percent from a recent high while its longer trend stays up. The concept is identical in futures, forex and crypto. What changes is the yardstick. A 3% dip is routine for a volatile stock and a big move for a slow one, which is why this guide measures depth in Average True Range (ATR) as well as in percent.
ATR is J. Welles Wilder's volatility measure: the average of each bar's true range, typically over 14 periods. It says nothing about direction, only how far the market normally travels in a bar. Measuring a pullback in ATR answers the practical question of whether this dip is big for this market right now.
Related lesson: Average true range ATR
How to Identify a Pullback Before Trading It
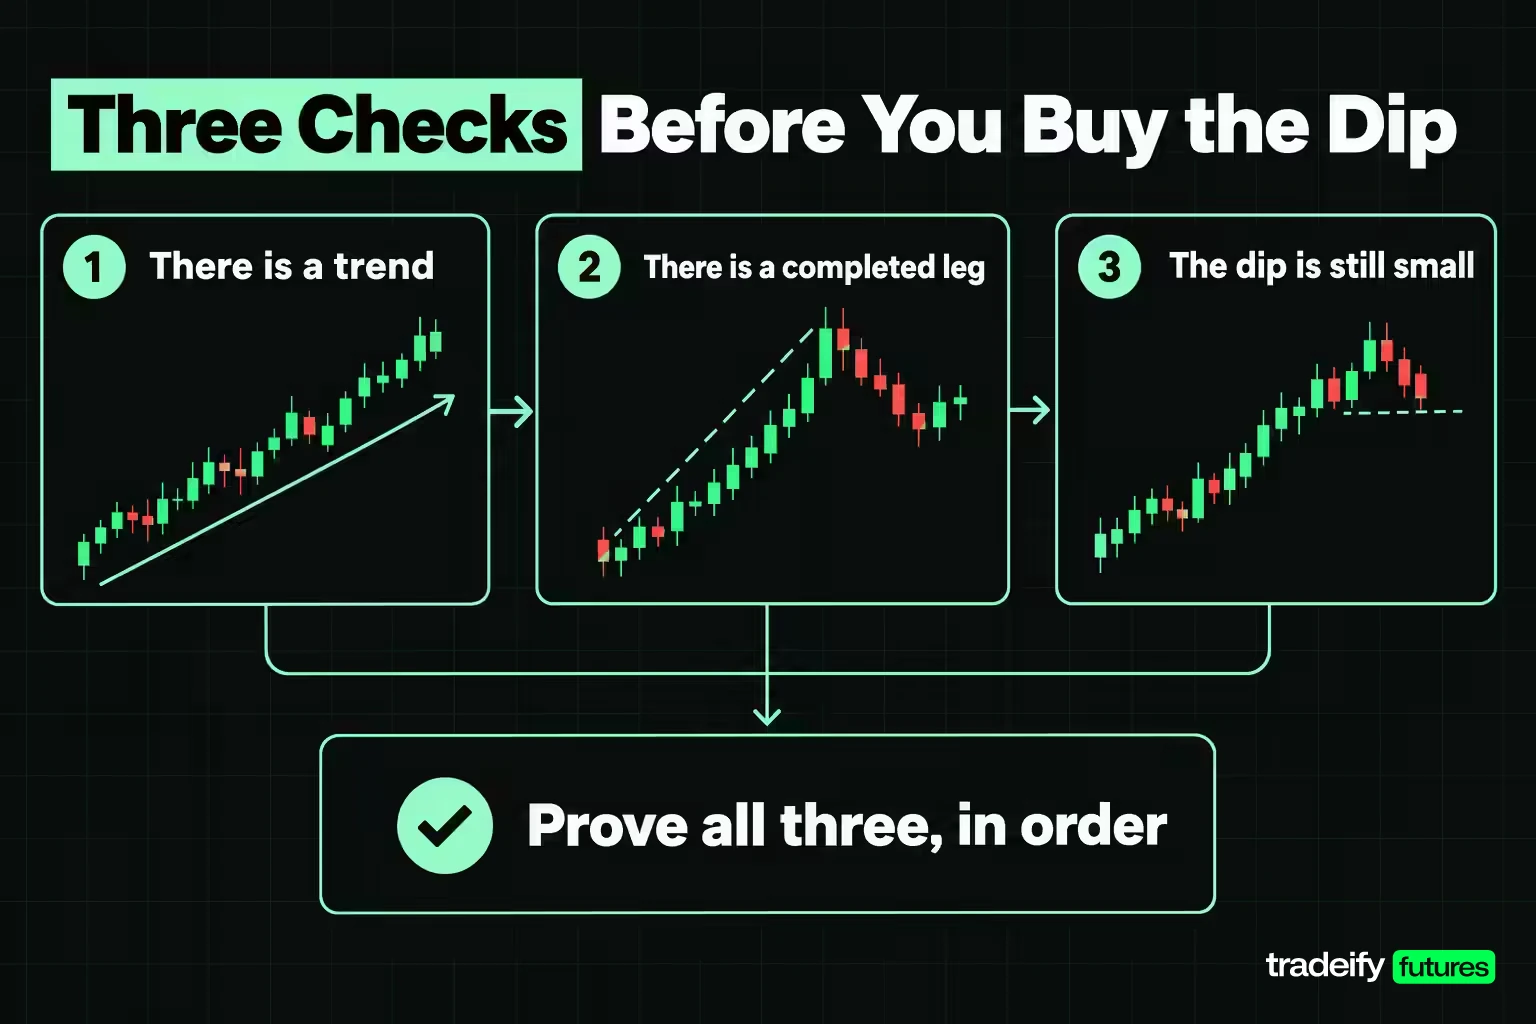
Identifying a pullback means proving three things in order: there is a trend, there is a completed leg, and the current dip is still small enough to belong to that leg.
Confirm the trend before the pullback
A pullback only exists relative to a trend. Without one you are just buying a falling market. Common trend filters include:
- A sequence of higher swing highs and higher swing lows.
- A rising 50-day moving average, or price holding above it.
- A recent new high, such as the highest high of the last 20 sessions.
The 50-day average is a useful dividing line for pullback trading. In this guide's own measurement on Yahoo Finance continuous ES and NQ daily bars, of 168 pullback lows checked from November 2016 to November 2026, the 109 that closed above their 50-day simple moving average went on to make a new high within 20 sessions 88.1% of the time. The 59 that closed below it managed 42.4%. That is hindsight (you only know a low was the low afterward), but it says a pullback that breaks the trend filter deserves a different label.
Mark the leg you are measuring against
Every pullback is measured from the swing low that started the rally to the swing high that ended it. Mark both. If the leg is tiny, the retracement percentages are noise.
One mechanical way to do this is a reversal filter: a swing high only counts once price has fallen at least 2 times the 14-day ATR from it, and a swing low only counts once price has rallied 2 ATR from it. That is the filter used for the pullback counts in this guide.
Measure the dip two ways
Once the leg is marked, measure the current decline from the high:
- As a retracement. Decline divided by the leg. A 40-point dip on a 100-point leg is a 40% retracement.
- In ATR. Decline divided by the ATR at the high. A 40-point dip with a 20-point ATR is 2 ATR deep.
The two can disagree. A 50% retracement of a huge leg can be 6 ATR deep, and of a small leg 1.5 ATR deep. The ATR number tells you how hard the dip is pushing against normal volatility, which matters more once you are placing a stop.
What makes a pullback valid
A valid pullback, in practical terms, has four features:
- The trend filter still holds (higher lows, price above a rising average).
- The prior swing low has not been broken. If price closes below the low that started the leg, the higher-low structure is gone.
- The dip is ordinary in size for the market. In this guide's own measurement on Yahoo Finance continuous ES and NQ daily bars, pullbacks deeper than about 5 ATR made a new high within 20 sessions only 18.4% of the time.
- You can name the level where you would be wrong before you enter.
Related lesson: Market structure, highs and lows
Types of Pullbacks Measured by Depth
Pullbacks are usually sorted by shape (flags, channels, two-legged dips). Sorting them by depth is more useful, because depth is what your order and your stop have to live with. A flag and a two-legged dip of the same depth put the same pressure on your stop.
How the pullback sample was measured
This guide's own pullback measurement covers every completed uptrend pullback in Yahoo Finance's continuous front-month ES and NQ daily futures bars from November 7, 2016 to November 4, 2026, about 2,514 sessions per market. Swings were confirmed with the 2 ATR reversal filter. A pullback was counted when a swing high made a higher high than the previous swing high, and it ran from that high to the next confirmed swing low. That produced 169 pullbacks: 85 in ES and 84 in NQ. The series is not back-adjusted, so a contract roll can add a small price jump.
The median pullback in that sample:
- Followed a rally of 5.33 ATR.
- Was 3.38 ATR deep, with 2.54 ATR at the 25th percentile, 4.70 ATR at the 75th and 6.58 ATR at the 90th.
- Gave back 63.5% of the leg, with 43.3% at the 25th percentile and 94.0% at the 75th.
- Was 4.11% of price. 60.4% stayed within a 5% decline and 89.3% within 10%.
- Lasted 5 sessions from high to low, with 8 sessions at the 75th percentile.
Overall, in this measurement 72.2% made a new high within 20 sessions of their low, and 22.5% had already taken out the swing low that started the leg.
Pullback depth bands and what followed
| Pullback type | Depth reached | Share of pullbacks | Pullbacks | New high within 20 sessions | Median retracement |
|---|---|---|---|---|---|
| Shallow | Under 2.5 ATR | 20.7% | 35 | 100.0% | 39.2% |
| Standard | 2.5 to 3.5 ATR | 32.5% | 55 | 92.7% | 53.1% |
| Deep | 3.5 to 5 ATR | 24.3% | 41 | 70.7% | 75.9% |
| Failing | 5 ATR or more | 22.5% | 38 | 18.4% | 131.0% |
Source: this guide's own calculation on Yahoo Finance continuous ES and NQ daily bars, November 2016 to November 2026.
Read the table as a gradient, not a set of thresholds. Shallow and standard pullbacks almost always resumed. Deep ones mostly did. Past 5 ATR the median pullback had given back 131.0% of the leg, which means it had already broken the low that started the rally. By then it is behaving like a reversal, and the label "pullback" is wishful.
Smaller pullbacks resolve faster
The 2 ATR filter only sees meaningful swings. In this guide's own measurement on Yahoo Finance continuous ES and NQ daily bars, loosening it to 1 ATR shows the everyday dips inside a trend: 207 in ES and 204 in NQ over the same decade, with a median depth of 1.80 ATR in ES and 1.91 ATR in NQ. Most were quick. 74.4% of ES dips and 77.9% of NQ dips ran their course in 3 sessions or fewer.
That speed matters for the decision. A trader who wants time to think during a pullback usually does not get it.
Pullback Entry Techniques
There are five common ways to enter a pullback. Each answers the same question differently: what tells you the dip is over? The trade-off running through all five is price versus proof. The earlier you buy, the better the price and the less evidence you have.
Resting limit at a measured depth
Place a buy limit a fixed distance below the swing high, measured in ATR, and let the market come to you. It is mechanical and removes in-the-moment hesitation. The cost is that you will sometimes buy a dip that keeps falling, because a limit does not wait for proof.
Fibonacci retracement entries
Fibonacci retracement levels are drawn from the swing low to the swing high. The common levels are 23.6%, 38.2%, 50%, 61.8% and 78.6%, and 38.2%, 50% and 61.8% are the most watched. Traders place orders at or near those levels or wait for a reaction there.
In this guide's own measurement on Yahoo Finance continuous ES and NQ daily bars (169 pullbacks, 2016 to 2026), no single level stood out as the place a pullback ends:
| Retracement of the prior leg | Share of pullbacks | Pullbacks | Made a new high | Median depth in ATR |
|---|---|---|---|---|
| Under 38.2% | 20.1% | 34 | 91.2% | 2.52 ATR |
| 38.2% to 50% | 10.7% | 18 | 94.4% | 2.59 ATR |
| 50% to 61.8% | 15.4% | 26 | 88.5% | 2.90 ATR |
| 61.8% to 78.6% | 17.8% | 30 | 70.0% | 3.55 ATR |
| 78.6% to 100% | 13.6% | 23 | 69.6% | 3.64 ATR |
| Over 100% | 22.5% | 38 | 36.8% | 5.44 ATR |
Source: this guide's own calculation on Yahoo Finance continuous ES and NQ daily bars, November 2016 to November 2026.
In that measurement, pullbacks ended all over the grid. The 38.2% to 61.8% zone held only 26.0% of the sample (18 plus 26 of 169). What the table does show is that the outcome tracks depth: the bands up to 61.8% resumed close to 90% of the time, and the odds fell as the retracement got deeper. Use the levels as places to look, not reasons to buy.
Related lesson: Fibonacci retracements and extensions
Moving average pullback entries
Many traders buy when price touches a moving average, most often the 20-period exponential moving average (EMA) or the 50-period simple moving average. The 20 EMA is touched so often in trends that it makes a weak filter on its own: in this guide's own measurement on Yahoo Finance continuous ES and NQ daily bars, 154 of 168 pullback lows traded through it. The 50-day average is more selective and more useful as a trend check than as an entry price.
Support level pullback entries
Prior resistance that the rally broke through often acts as support on the way back down. Buying a pullback into a level the market has already respected gives you a natural stop location just beyond it.
Related lesson: Support and resistance
Confirmation candle entries
Instead of a resting order, wait for the dip to show it is ending: a bullish engulfing bar, a hammer, a close back above the prior bar's high, or a break of a short-term downtrend line. You give up some price for evidence. The trade-off is that in fast markets the confirmation bar often prints most of the bounce, so your entry ends up close to where a breakout trader would have bought.
Indicators for Pullback Trading
Indicators help in pullback trading when they answer one of three questions: is the trend still up, is this dip normal in size, and is selling pressure fading. No indicator tells you the low.
Moving averages for pullback trend and location
The EMA weights recent prices more heavily, using a multiplier of 2 divided by the period plus 1, and like every moving average it lags price. A rising 50-day average and price closing above it is a simple pullback-trend filter. In this guide's own measurement on Yahoo Finance continuous ES and NQ daily bars, pullback lows that closed above the 50-day simple moving average made a new high 88.1% of the time; lows that held entirely above it (the bar's low never touched it) did so 95.0% of the time across 80 cases.
RSI for momentum reset
The Relative Strength Index (RSI) is Wilder's momentum oscillator, running from 0 to 100, with readings above 70 usually called overbought and below 30 oversold. Pullback traders often wait for RSI to cool from above 70 toward 40 to 50 in an uptrend rather than for an oversold reading.
This guide's own measurement on Yahoo Finance continuous ES and NQ daily bars backs that up. The median 14-day RSI at 168 pullback lows from 2016 to 2026 was 47.9. Lows where RSI was 40 or higher made a new high 82.2% of the time (135 cases). The 7 lows that reached RSI under 30 made a new high only 14.3% of the time. In a trend, a deeply oversold RSI was more often a sign of a broken trend than of a bargain.
Related lesson: Relative strength index RSI
ATR for depth and stop distance
ATR turns a pullback from a vague dip into a number you can size against. It is the yardstick for every depth figure in this guide, and the natural unit for the stop.
Volume during a pullback
A common reading is that a healthy pullback comes on lighter volume than the rally before it, and that heavy volume on the decline signals real selling. It is a reasonable heuristic to test on your own market, but continuous futures volume jumps around contract rolls, so compare volume within one contract month rather than across a roll.
Related lesson: What is volume
Pullback Trading Tested at Six Entry Depths
Descriptive statistics about pullback lows use hindsight. A tradable pullback trading rule cannot. So this guide's own entry test placed orders the way a trader would in real time on Yahoo Finance continuous ES and NQ daily bars from November 2016 to November 2026.
How the pullback entry test worked
- Setup. A session prints a new 20-session high while the 50-day simple moving average is above its level 10 sessions earlier. That high is the reference high, and that session's 14-day ATR is the reference ATR.
- Order. A buy limit at the reference high minus a set number of ATRs. New highs move the reference up. The order is cancelled 20 sessions after the reference high if not filled.
- Exits. Stop 2 ATR below the limit. Target at the reference high. If a bar hits both, it counts as a stop. Trades still open after 20 sessions close at that session's close.
- Limits. One position per market at a time, no commissions or slippage, continuous front-month prices.
Pullback entry depth results
| Limit below the high | Trades | Reward if target hit | Win rate | Stopped out | Expectancy per trade | Total | Median heat on winners | Median heat on losers |
|---|---|---|---|---|---|---|---|---|
| 0.5 ATR | 381 | 0.25R | 78.2% | 21.8% | +0.04R | +13.5R | 0.40 ATR | 2.26 ATR |
| 1.0 ATR | 246 | 0.5R | 67.1% | 32.5% | +0.03R | +6.5R | 0.58 ATR | 2.44 ATR |
| 1.5 ATR | 200 | 0.75R | 62.5% | 37.0% | +0.11R | +21.1R | 0.56 ATR | 2.34 ATR |
| 2.0 ATR | 143 | 1R | 54.5% | 42.7% | +0.12R | +16.9R | 0.89 ATR | 2.46 ATR |
| 2.5 ATR | 119 | 1.25R | 52.9% | 42.0% | +0.28R | +32.8R | 0.73 ATR | 2.54 ATR |
| 3.0 ATR | 100 | 1.5R | 50.0% | 45.0% | +0.34R | +33.9R | 0.56 ATR | 2.18 ATR |
Source: this guide's own calculation on Yahoo Finance continuous ES and NQ daily bars, November 2016 to November 2026.
Three things stand out.
First, shallow entries win often and pay almost nothing. A 0.5 ATR limit won 78.2% of the time, but each win paid a quarter of the risk, so expectancy sat at +0.04R. One gap or one bad week erases that kind of edge, and costs are not in these numbers.
Second, expectancy per trade rose with depth, from +0.03R at 1 ATR to +0.34R at 3 ATR, while the trade count fell from 246 to 100. Deeper limits get fewer fills and a better price on each.
Third, a losing trade looked the same wherever you entered. Median heat on losers (the deepest move against the position) stayed between 2.18 and 2.54 ATR across every row. Entry depth changed how often you were in a trade and what you were paid, not what a losing pullback looked like.
These are small samples from two correlated markets in a decade when both rose strongly. Treat the ordering as the finding, not the exact numbers, and expect your own market and timeframe to produce different ones.
Risk Management for Pullback Trades
Risk management for pullback trading comes down to three decisions: where the stop goes, when to give up early, and how many contracts the stop allows.
Stop placement for a pullback entry
The stop belongs where the pullback idea is wrong, not at a round dollar amount. The usual choices:
- Beyond the prior swing low. If price takes out the low that started the leg, the higher-low structure is broken.
- A fixed ATR distance below the entry. The ES and NQ entry test used 2 ATR, which kept the stop proportional to current volatility.
- Beyond the level you bought. If you bought a support level or a moving average, the stop sits a buffer past it.
A stop order becomes a market order once triggered and can fill worse than its price, especially on a gap. In this guide's ES and NQ pullback entry test, 2 of the 143 trades at the 2 ATR depth lost more than 1R because the market opened through the stop. The worst lost 1.12R.
Use pullback heat as an early warning
Heat is how far a pullback trade moves against you before it resolves. In this guide's 2 ATR entry test on Yahoo Finance ES and NQ daily bars, the median winner moved 0.89 ATR against the entry and the median loser 2.46 ATR. Watching heat after the fill gave a clearer signal than any indicator:
- Trades that never went 1 ATR offside: all 44 reached the target. Part of that is mechanical, since every stopped trade travelled 2 ATR.
- Trades that went at least 1 ATR offside: 99 trades, 34.3% reached the target, expectancy -0.27R.
- Trades that went at least 1.5 ATR offside: 78 trades, 16.7% reached the target, expectancy -0.62R.
The practical version is a pre-written rule: if the pullback is 1.5 ATR past your entry without reclaiming it, decide in advance whether you cut early or hold to the stop. Either can be right. Deciding in the moment is the part that goes wrong.
Position sizing for pullback trades
Size comes from the stop distance and your risk budget, never from the target. The arithmetic for an illustrative ES setup, using CME's $50 per point for ES and $5 per point for Micro E-mini S&P 500 (MES):
- Illustrative daily ATR of 80 points, so a 2 ATR stop is 160 points.
- 160 points is $8,000 per ES contract and $800 per MES contract.
- With a $500 risk budget, even one MES is too large. The answer is zero contracts, not one.
The same idea on a 5-minute chart, with an illustrative 5-minute ATR of 6 points: a 2 ATR stop is 12 points, or $60 per MES. A $300 budget allows 5 MES.
That is why many traders who like the daily-bar logic run it on intraday charts. The method is the same; the ATR, and therefore the dollar risk, is smaller.
The 3-5-7 rule as a risk ceiling
The 3-5-7 rule is an informal risk framework, not an exchange or regulatory rule. A common version says risk no more than 3% of the account on one trade, keep total open risk at or under 5%, and aim for winners at least 7% (some versions treat the 7 as a win-to-loss size ratio). On a $50,000 account, 3% is $1,500 per trade and 5% is $2,500 of total open risk. Many traders use far smaller numbers, and a strategy with a long losing streak needs them.
Related lesson: Position sizing futures contracts
Pullback Trading Examples in ES
Two ES trades from this guide's 2 ATR pullback trading entry test on Yahoo Finance daily bars, one winner and one loser, show how the rule plays out session by session. Prices are from the continuous front-month daily series, with dollar values at CME's $50 per point for ES and $5 for MES. A live order would be rounded to the 0.25 tick.
A pullback that worked, September 2025
On September 22, 2025, ES printed a 20-session high of 6,756.75 with the 50-day average rising. The 14-day ATR was 56.47 points.
- Limit at 2 ATR below the high: 6,643.81.
- Stop at 2 ATR below the limit: 6,530.87.
- Target at the high: 6,756.75.
- Risk and reward: 112.94 points each, or $5,647 per ES and $564.70 per MES.
The market drifted lower for three sessions and filled the order on September 25, 2025, when the low reached 6,624.25. That was the worst it got, about 0.35 ATR of heat. It bounced the next day and traded through 6,756.75 on October 1, 2025 for a 1R gain.
The useful detail is the wait. Three sessions of watching a rising market slip is exactly when traders abandon a resting order and buy early, which here would have meant paying more for the same trade.
A pullback that failed, June 2026
On June 1, 2026, ES printed a high of 7,632.25 with an ATR of 78.80 points.
- Limit at 2 ATR below the high: 7,474.65.
- Stop: 7,317.05.
- Risk: 157.60 points, or $7,880 per ES and $788 per MES.
On June 5, 2026, ES fell from 7,591.00 to 7,359.00 in one session and filled the order on the way down. At that session's low the trade was about 1.5 ATR offside. In this guide's 2 ATR entry test on Yahoo Finance ES and NQ daily bars, only 16.7% of trades that reached that much heat went on to the target. On June 9, 2026, the low reached 7,247.25 and the stop filled for a 1R loss.
Nothing about this setup looked different from the winning trades in the same pullback test: same trend filter, same 2 ATR depth, same stop. The difference showed up only after the fill, in how fast and how far price kept going.
Related lesson: Stop-loss orders and placement
Pullback Trading in Different Market Conditions
Pullback trading depends on trends, so the conditions that matter most for pullback trading are trend strength and volatility.
Pullbacks in strong trends versus choppy years
In this guide's 2 ATR pullback entry test on Yahoo Finance ES and NQ daily bars, the best years were steady advances: +5.73R across 17 trades in 2017, +7.02R across 21 trades in 2024 and +5.00R across 15 trades in 2025. Years with sharp reversals and choppy ranges went nowhere: -0.93R across 15 trades in 2020 and exactly 0.00R across 22 trades in 2021.
Pullbacks in bear markets
Pullback trading struggles in bear markets. 2022 was the bear year in this guide's ten-year ES and NQ pullback entry test. The trend filter kept the rule mostly out, with only 6 trades, but those lost -4.12R in total. When a rising average briefly turns up inside a falling market, a pullback rule buys the bounce that fails. The defence is a slower trend filter or a rule that stands aside after the 50-day average turns down.
Pullbacks in high volatility
In this guide's 2 ATR pullback entry test on Yahoo Finance ES and NQ daily bars, setups where the reference ATR was more than 25% above its median for the prior year produced 20 trades with a 45.0% win rate and +0.05R expectancy, against 123 trades at 56.1% and +0.13R in normal volatility. Wider ATR widens the stop and the dollar risk, so the same rule at the same contract count carries much more risk in a volatile tape.
Pullbacks in sideways markets
Pullback trading in a sideways market is a different trade. In a range there is no trend to rejoin, so a "pullback" is just a move toward the bottom of the range. Range traders buy that too, but with a target at the top of the range rather than a new high. If the trend filter is off, the method is different, and so should the rules be.
Related lesson: Trend following
Pullbacks Across Futures Markets
Pullbacks look broadly similar across markets when they are measured in ATR, but the details differ enough to matter for pullback trading. This guide ran the same 2 ATR swing method on four Yahoo Finance continuous futures series from November 2016 to November 2026:
| Market | Pullbacks | Median depth | Median retracement | Median duration | New high within 20 sessions |
|---|---|---|---|---|---|
| E-mini S&P 500 (ES) | 85 | 3.29 ATR | 60.7% | 5 sessions | 72.9% |
| E-mini Nasdaq-100 (NQ) | 84 | 3.43 ATR | 64.0% | 5 sessions | 71.4% |
| Crude oil (CL) | 62 | 3.24 ATR | 79.6% | 6 sessions | 54.8% |
| Gold (GC) | 62 | 3.70 ATR | 67.4% | 6 sessions | 56.5% |
Source: this guide's own calculation on Yahoo Finance continuous ES, NQ, CL and GC daily bars, November 2016 to November 2026.
Depth in ATR was close across all four. What differed was the follow-through. Equity index pullbacks resumed more often, which fits a decade when both indexes trended up hard. Crude oil retraced more of each leg and resumed least often, consistent with a market driven by supply shocks and sharp reversals. Gold sat in between.
Contract size changes the dollar meaning of the same ATR. Crude oil (CL) is 1,000 barrels, so a $1.00 move is $1,000 per contract. Gold (GC) is 100 troy ounces, so a $1.00 move is $100 per contract. Check the multiplier before you translate an ATR stop into dollars.
For forex, the same depth logic applies to currency pairs or currency futures, but quieter pairs produce small ATRs and the session matters more. For individual stocks, overnight gaps and earnings make pullbacks deeper and less predictable, so re-measure on your own instrument rather than borrowing these numbers.
Related lesson: Futures contract specifications
Pullback vs Breakout Trading
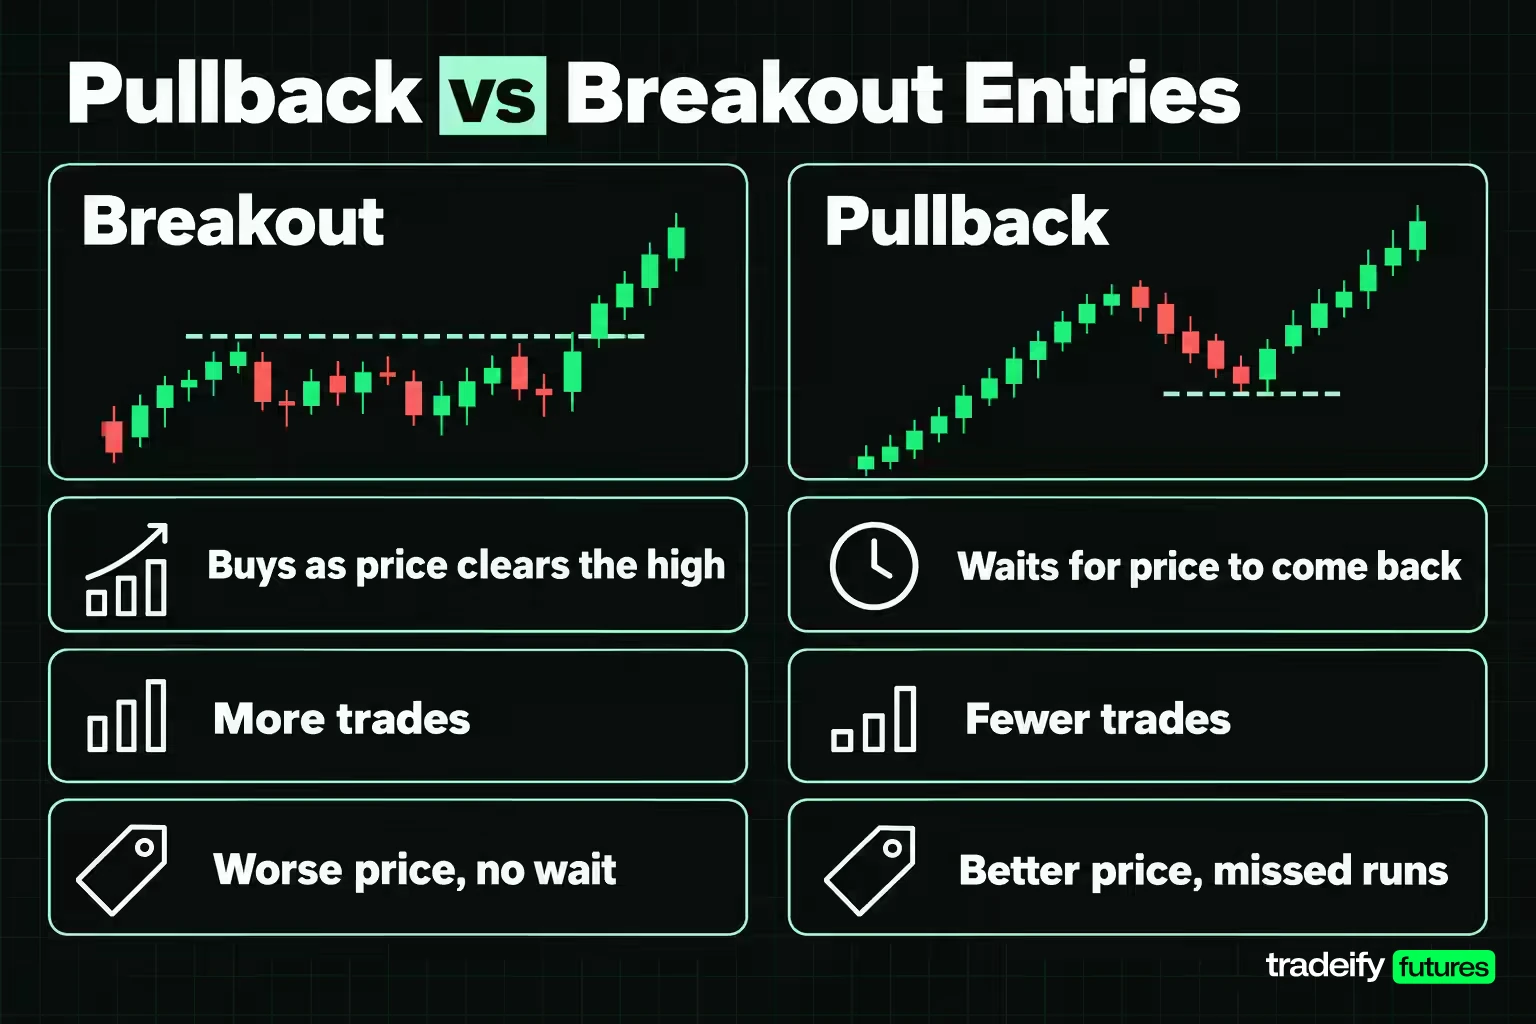
Pullback trading and breakout trading both try to join a trend. A breakout trader buys when price clears the high. A pullback trader waits for the market to come back.
To compare them fairly, this guide tested the same ES and NQ setup on Yahoo Finance daily bars (a new 20-session high with a rising 50-day average) with a breakout entry: buy that session's close, stop 2 ATR below, target 2 ATR above, so 1R either way, with a 20-session time exit. Over the decade the breakout version produced 217 trades, a 52.5% win rate and +0.15R per trade (+33.4R in total). The 2 ATR pullback version produced 143 trades, a 54.5% win rate and +0.12R per trade.
| Approach | Trades | Win rate | Expectancy per trade | What you trade off |
|---|---|---|---|---|
| Breakout at the close | 217 | 52.5% | +0.15R | More trades, worse price, no wait |
| Pullback limit at 2 ATR | 143 | 54.5% | +0.12R | Fewer trades, better price, missed runs |
| Pullback limit at 3 ATR | 100 | 50.0% | +0.34R | Fewest trades, best price, deepest drawdowns before the fill |
At equal risk, the 2 ATR pullback entry did not beat simply buying the breakout. The deeper pullback limits did better per trade but traded far less. The honest conclusion is that pullback trading is not automatically better than breakout trading. Its advantage is a better price and a natural stop location. Its cost is the strong runs it never gets into.
Use pullback trading when the trend is established and the market has a habit of giving back part of each leg. Use breakouts when a market is starting a new trend from a range and may not look back.
Related lesson: Breakout trading
The Psychology Behind Pullback Trading
Pullbacks happen for ordinary reasons. Traders who bought early take profits. Late buyers who chased the high get shaken out by the first dip. Short-term sellers lean against an extended move. None of that changes the bigger reason the trend existed, so when the selling runs out, buyers who missed the first leg step in.
That is the case for pullback trading. The psychology of actually doing pullback trading is harder.
The first trap is the fear of missing out. A rising market feels like it will never come back, so traders buy early, then watch the real pullback happen against them. A resting pullback order on ES can take three sessions or more to fill while a rising market slowly slips. Those sessions are where most people give up on the plan.
The second trap is attachment after the fill. Once you own a pullback, every further dip looks like a better price instead of evidence. That is how a pullback trade turns into averaging down into a reversal.
The third is the opposite: freezing after a loss. A failed pullback feels like proof the method is broken, so the next valid setup gets skipped. In a strategy that wins around half the time, skipping the next trade after a loss is how a positive rule produces negative results.
The fix for all three is the same. Write the entry depth, the stop, the early-exit rule and the target down before the dip begins, and judge the method over dozens of trades, not one.
Related lesson: Patience in trading
Platform Tools for Pullback Trading
Most futures charting and order platforms already include what pullback trading needs. None of these tools makes the decision for you. Their job is to make a decision you already wrote down easy to carry out, and they fall into three groups.
Tools to identify a pullback
- ATR study. Plot a 14-period ATR on the timeframe you trade so you can read depth in ATR rather than guessing.
- Fibonacci retracement tool. Draw from swing low to swing high to see the standard levels and where the current dip sits.
- Moving averages. A 20-period EMA and a 50-period simple moving average cover most trend and location checks.
- Price alerts. An alert at your planned entry depth lets you stop staring at the chart during the wait.
Tools to execute a pullback trade
- Limit orders. A buy limit executes at its price or better, which suits a resting pullback entry.
- Bracket orders. A bracket attaches a stop and a target to the entry as soon as it fills.
- OCO orders. One-cancels-other links the stop and target so that when one executes, the other is cancelled automatically. Without it, a filled target can leave a stray stop working.
Tools to verify a pullback method
- Chart replay. For pullback trading practice, many platforms let you replay historical bars one at a time, which is the closest you can get to practising the wait and the decision without real money.
- Trade journal or performance report. Log the pullback depth, the heat after the fill and the result of each trade. After 30 or 40 trades you can measure how far your own winners and losers went against you instead of trusting someone else's numbers.
Related lesson: How to keep a trading journal
Common Pullback Trading Mistakes
Most pullback trading mistakes come from treating the dip as the signal rather than the setup. The dip only tells you where to look. The trend filter, the depth and the stop decide whether there is a trade.
| Mistake | What it looks like | What this guide's ES and NQ measurement says |
|---|---|---|
| Buying the first wiggle | A limit 0.5 ATR under the high fills almost at once | 78.2% win rate but only +0.04R per trade, before costs |
| Ignoring the trend filter | Buying dips after the 50-day average turns down | Lows that closed below the 50-day average made a new high 42.4% of the time |
| Treating oversold as cheap | Buying because RSI fell under 30 | The 7 pullback lows with RSI under 30 made a new high 14.3% of the time |
| Holding through heavy heat | Staying in a trade 1.5 ATR offside on hope | Only 16.7% of those trades reached the target |
| Calling a reversal a pullback | Buying a dip of 5 ATR or more | Only 18.4% of those dips made a new high within 20 sessions |
| Sizing from the target | Picking contracts by what the win would pay | A 2 ATR daily ES stop can run $7,880 per contract |
Source: this guide's own calculation on Yahoo Finance continuous ES and NQ daily bars, November 2016 to November 2026.
Two more mistakes do not fit a table. One is drawing the leg to suit the trade, moving the swing low until the dip looks like a 50% retracement. The other is judging a pullback trading method on one trade. A 54.5% win rate still produces losing runs: this guide's 2 ATR entry test on Yahoo Finance daily bars had a streak of 5 straight losses in ES and another in NQ.
Pullback Trading on an Intraday Schedule
Pullback trading on daily bars usually means holding for days. In this guide's ES and NQ daily-bar entry test, the median trade at the 2 ATR depth took 4 sessions from fill to exit. Many traders cannot or do not want to hold positions overnight, and the method still translates.
The translation is to keep the logic and change the timeframe. Mark the trend and swing points on an intraday chart, such as 5-minute or 15-minute bars, measure ATR on that chart, and set the entry depth, stop and heat rule in that ATR. The numbers will differ from the daily study, so measure them on your own instrument and timeframe before trusting them. Higher-timeframe trend still helps as a filter: an intraday pullback in the direction of the daily trend is a different trade from one against it.
On our accounts, every position is closed by 4:45 PM ET on regular trading days and nothing is held overnight or over the weekend, so a multi-session daily-bar pullback method cannot be run as written on a Tradeify account. Size is set by contract limits rather than a margin figure; a 50K account, for example, allows up to 4 minis or 40 micros.
Related lesson: Trade setups and confirmation
Pullback Trading FAQ
What is a pullback in the share market?
A pullback in the share market is a short decline in a stock or index that is otherwise trending up, usually a few percent from a recent high. It ends when the uptrend resumes. If the decline keeps going and breaks the trend's prior swing low, it is more likely a correction or reversal.
What is the 5-3-1 rule in trading?
The 5-3-1 rule is an informal forex framework. It suggests trading no more than five currency pairs, using three predefined strategies, and focusing on one main trading session. It is a way to limit distraction, not a technical rule, and it cannot ensure profit.
What is the 3-5-7 rule in trading?
The 3-5-7 rule is an informal risk guideline. A common version says risk at most 3% of the account per trade, keep total open risk at or under 5%, and aim for winners of at least 7%. Versions differ, and many traders use much smaller numbers.
What makes a valid pullback in trading?
A valid pullback happens inside an established trend, holds above the swing low that started the leg, and stays within normal depth for the market. In this guide's ten-year measurement of ES and NQ daily bars, pullbacks under 3.5 ATR made a new high far more often than deeper ones. You should also be able to name your stop before entering.
How long does a pullback usually last?
In this guide's measurement of ES and NQ daily bars from 2016 to 2026, the median meaningful pullback lasted 5 sessions from high to low. Smaller everyday dips were faster, with about three quarters finished in 3 sessions or fewer.
Is pullback trading profitable?
Pullback trading can have a positive expectancy, but it is not automatically profitable. In the ES and NQ entry test, results depended heavily on entry depth, market conditions and costs, and 2022 lost money. Test any pullback rule on your own market and include commissions and slippage.
Pullback Trading Risk Note
Futures trading involves substantial risk, and leverage can produce losses larger than you expect, including losses beyond the initial deposit in a personal brokerage account. The measurements in this guide are arithmetic on historical continuous front-month daily bars; they exclude commissions, slippage and contract-roll effects, do not represent any account's results, and do not predict future performance. Funded prop-firm accounts are simulated. This guide is educational and is not investment advice.


