



TL;DR: Commodity trading strategies work only when the method fits the market state and the contract you trade. Trend and breakout trades need direction; range trades need boundaries tested at least twice. Seasonal, spread and hedging methods depend on storage, harvest and delivery cycles. A $1.00 crude move is $1,000 on CL and $100 on MCL, so size from stop distance times point value.
Commodity trading strategies are repeatable rules for deciding which commodity to trade, when to enter, where the idea is wrong and how to get out. Finding one is easy. Every chart shows a trend, a range or a breakout if you look long enough. The hard part is matching the strategy to the market in front of you and to the contract you are actually trading, before the trade, not after it.
That matching problem is sharper in commodities than in stocks. Crude oil reacts to inventories, OPEC decisions and refinery demand. Natural gas can swing on a cold forecast. Corn trades on planting, weather and harvest. Gold responds to the dollar, interest rates and fear. The chart patterns can look the same across all four while the forces behind them are completely different. A breakout in natural gas the day before a storage report is not the same trade as a breakout in gold on a quiet afternoon.
This guide covers the main commodity strategies (trend following, breakouts, range trading, seasonal trades, spreads and hedging), the fundamental and technical analysis behind them, worked contract math with illustrative prices, and a decision table for choosing between them.
Commodity Futures Contracts Behind the Strategies
Commodity trading strategies are built on an instrument, and the instrument changes the trade. Most active commodity traders use futures, but there are several ways to get exposure:
- Futures. Standardized exchange contracts for a fixed quantity, with set contract months, a tick value and either physical delivery or cash settlement at expiration.
- Micro futures. Smaller versions of some contracts, such as Micro WTI Crude Oil (MCL) at one tenth of standard crude oil (CL) and Micro Gold (MGC) at one tenth of standard gold (GC).
- Options on futures. The right, not the obligation, to buy or sell a futures contract at a set price, with their own decay and volatility risks.
- Exchange-traded products. Funds that hold futures or physical metal; they trade like stocks but can drift from spot prices because of roll costs and fees.
- Physical commodities. Bullion or physical goods, which involve storage, insurance and dealer spreads.
This guide uses futures for its examples because the contract details drive the risk.
Commodity contract sizes compared
Here is what a one-unit price change means on common commodity contracts, using round prices that are illustrative only, not quotes.
| Contract | Contract unit | Minimum tick | Illustrative price | Notional value at that price | Settlement |
|---|---|---|---|---|---|
| Crude oil (CL) | 1,000 barrels | $0.01 = $10.00 | $70.00 | $70,000 | Physical delivery |
| Micro WTI crude (MCL) | 100 barrels | $0.01 = $1.00 | $70.00 | $7,000 | Financially settled |
| Natural gas (NG) | 10,000 MMBtu | $0.001 = $10.00 | $3.500 | $35,000 | Physical delivery |
| Gold (GC) | 100 troy ounces | $0.10 = $10.00 | $4,000 | $400,000 | Physical delivery |
| Micro gold (MGC) | 10 troy ounces | $0.10 = $1.00 | $4,000 | $40,000 | Physical delivery |
| Silver (SI) | 5,000 troy ounces | $0.005 = $25.00 | $50.00 | $250,000 | Physical delivery |
| Copper (HG) | 25,000 pounds | $0.0005 = $12.50 | $5.00 | $125,000 | Physical delivery |
| Corn (ZC) | 5,000 bushels | $0.0025 = $12.50 | $4.50 | $22,500 | Physical delivery |
Contract specifications are from CME Group's published specs. The notional column is the illustrative price times the contract unit.
Two lessons sit in that table. First, a $1.00 move in crude oil is $1,000 on CL and $100 on MCL, so the same chart idea can be a reasonable trade on one contract and an oversized one on the other. Second, most of these contracts are physically deliverable, so a commodity futures position has an end date that a stock position does not.
Related lesson: Futures contract specifications
What Moves Commodity Prices
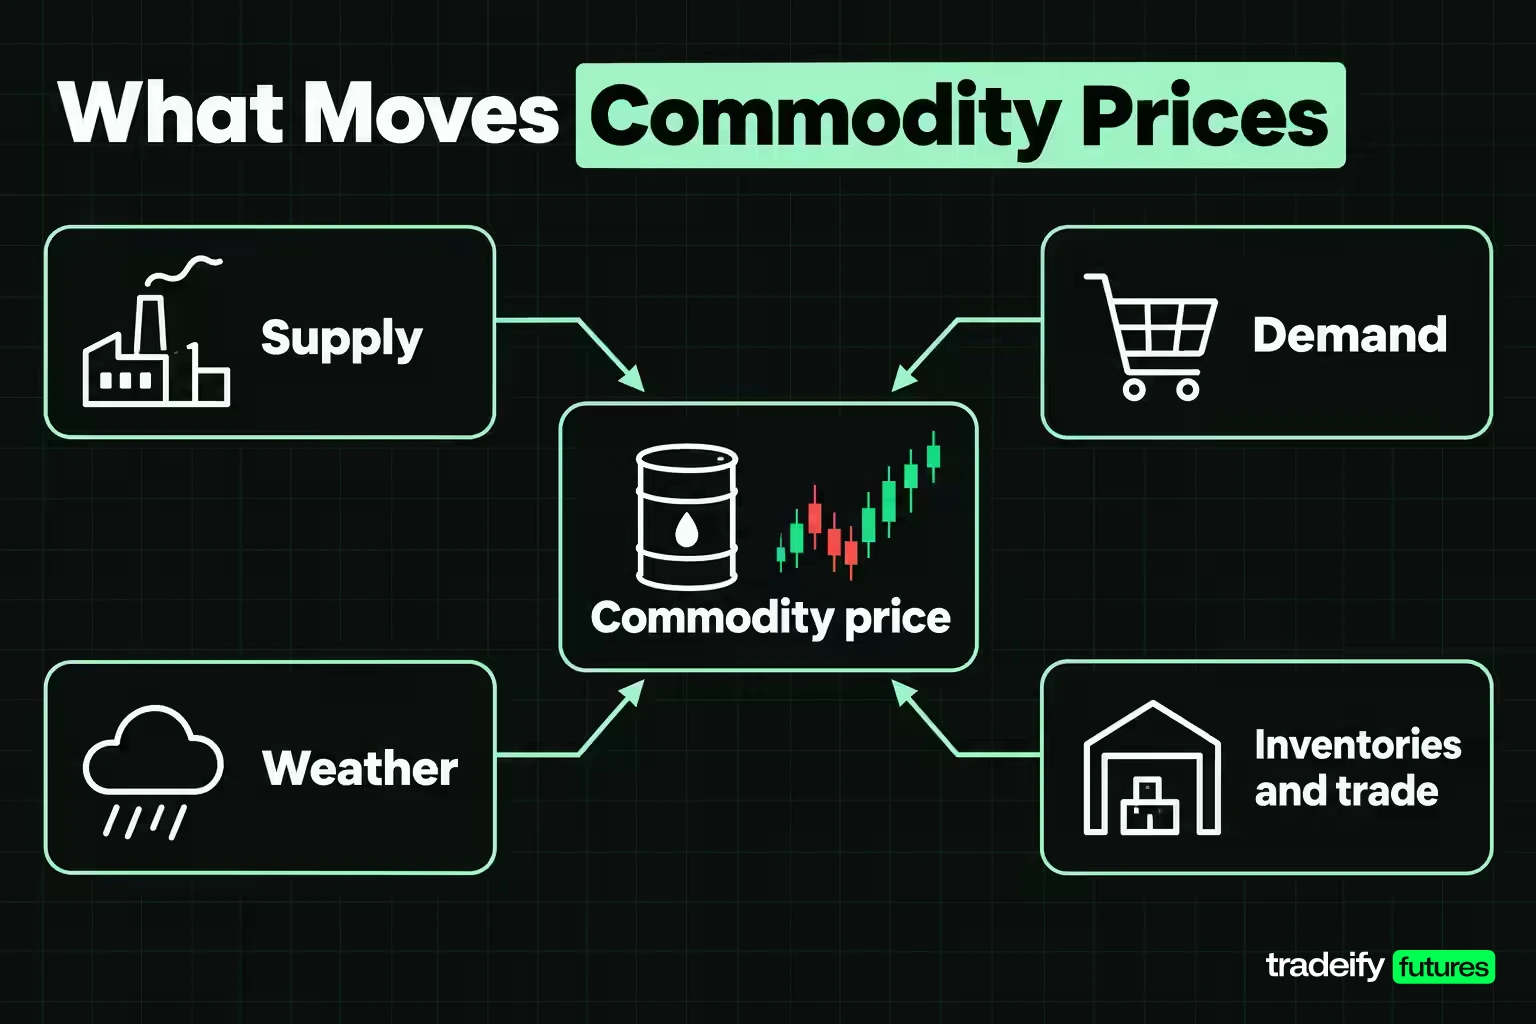
Commodity prices move on supply and demand for a physical good, and every commodity group has its own version of those forces. Knowing which drivers matter for your market tells you which news can move it and which news is noise.
- Supply. Production, inventories, imports and exports. The U.S. Energy Information Administration (EIA) lists production, storage volumes and trade as the main supply-side factors for natural gas prices, and notes that OPEC can influence oil prices by setting production targets for its members.
- Demand. Economic growth drives fuel and industrial metal demand. The EIA names economic growth as one of the biggest factors in petroleum demand.
- Weather. Winter cold raises heating demand for natural gas, and the EIA notes that severe weather such as hurricanes can disrupt supply. Growing-season weather shapes crop yields for corn, soybeans and wheat.
- Macro and currency. Benchmark contracts such as CME crude oil, gold and corn futures are quoted in U.S. dollars, so dollar strength, interest rates and inflation expectations feed into prices, especially for gold.
- Geopolitics and policy. Conflicts, sanctions, export bans and trade disputes can cut supply or reroute it quickly.
- Substitutes. The EIA lists the availability and prices of other fuels as a demand-side factor for natural gas. Silver trades partly as a precious metal and partly as an industrial one, so it can follow gold one week and copper the next.
How commodity drivers differ by market
| Commodity group | Main price drivers | Scheduled data traders watch |
|---|---|---|
| Crude oil | OPEC supply decisions, economic growth, refinery demand, inventories, geopolitics | EIA Weekly Petroleum Status Report |
| Natural gas | Weather, storage levels, production, exports | EIA Weekly Natural Gas Storage Report |
| Gold and silver | Real interest rates, U.S. dollar, risk sentiment, industrial demand for silver | Inflation and central bank releases |
| Copper | Industrial and construction demand, mine supply | Manufacturing and growth data |
| Grains | Planting, crop weather, yields, exports | USDA World Agricultural Supply and Demand Estimates (WASDE) |
The same headline can hit these markets in opposite ways. A strong economic report may lift copper and crude on demand hopes while pressuring gold if it pushes rate expectations higher. That is why a commodity strategy should name the drivers it depends on before the trade, not after.
Fundamental Analysis for Commodities
Fundamental analysis for commodities asks whether supply is tightening or loosening relative to demand, and whether the price already reflects it. Its raw material is public data, and much of it arrives on a fixed schedule.
- EIA Weekly Petroleum Status Report. U.S. crude and product inventories, production and refinery activity. The standard release is Wednesday at 10:30 AM Eastern, with holiday weeks shifted.
- EIA Weekly Natural Gas Storage Report. Working gas in underground storage, normally released Thursday at 10:30 AM Eastern.
- USDA WASDE. Monthly supply and use forecasts for U.S. and world wheat, rice, coarse grains, oilseeds and cotton, released at 12:00 PM ET.
- CFTC Commitments of Traders (COT). A breakdown of open interest by trader category, using data from Tuesday and generally published Friday at 3:30 PM Eastern.
Reading a commodity report against expectations
The number on its own rarely moves the market. The surprise does. If traders expect a crude inventory draw and the report shows a build, the market has to reprice for looser supply, even if the build is small by historical standards. The useful questions are what was expected, what printed, and whether the surprise came from a one-off (a delayed tanker, a refinery outage) or a trend.
Treat the first move after a release as information, not as a signal by itself. Prices often swing both ways in the first minutes while orders fill against thin liquidity. Reading the number correctly and getting a good entry are two different decisions, and the second one usually needs patience.
What the forward curve says about supply
The futures curve is fundamental data you can read every day. CME Group describes contango as a forward futures price above the spot price, often reflecting storage, financing and insurance costs, and backwardation as forward prices below spot. In backwardation there is a benefit to holding the physical commodity now, which CME calls the convenience yield, and it rises when warehouse stocks are low.
Reading commodity inventories against normal levels
Inventory data means little without a baseline. The EIA storage report compares working gas in storage with the year-ago level and the five-year average, so a trader can see whether supply is tight or loose for the time of year rather than in absolute terms. A storage level that looks large in October can still be below normal for October. The same logic applies to crude stocks and grain carryout: compare against the seasonal norm, then ask whether the gap is widening or closing.
In practice, a curve flipping from contango toward backwardation can be an early sign that nearby supply is tightening. It is evidence to combine with inventory data, not a trade trigger.
Technical Analysis for Commodity Charts
Technical analysis for commodities uses price, volume and volatility to time entries and exits once you know what kind of market you are in. The core tools are the same as in any futures market:
- Market structure. Higher highs and higher lows define an uptrend; lower highs and lower lows define a downtrend.
- Moving averages. A rising longer average with price above it describes trend direction. A flat average with price crossing it repeatedly describes a range.
- Average true range (ATR). The typical size of a bar, used to set stops and position size in proportion to current volatility.
- Volume and open interest. Rising participation can confirm a move; fading participation can warn that a breakout lacks support.
- Support and resistance. Levels where price has repeatedly turned, which become the boundaries for range and breakout strategies.
Commodity chart traps to check first
Commodity charts carry traps that stock charts do not.
The first is the continuous chart. Futures contracts expire, so a continuous chart stitches contract months together. When a chart rolls from one month to the next, the price difference between them can show up as a gap that never traded. In a market in steep contango or backwardation, an unadjusted continuous chart can show trends and gaps that are really just roll effects. Before testing any commodity strategy, know whether your chart is back-adjusted and when it rolls.
The second is liquidity moving between months. Crude oil lists monthly contracts, while corn trades March, May, July, September and December. Volume concentrates in the active month and shifts as expiration approaches, so the contract that showed clean price action last week may be thin this week.
The third is volatility that changes with the season and the news cycle. A stop that was two ATR wide in a quiet month can be inside the noise during a weather scare or around a report. Recalculate ATR before each trade rather than reusing last month's stop distance.
Related lesson: Continuous futures contracts
Trend Following Commodity Strategy
Trend following in commodities means trading in the direction of a sustained price move, entering after the trend is visible rather than predicting the turn. It fits commodities well when a supply or demand imbalance takes months to resolve, such as a drought, a production cut or a long rebuild of inventories.
A rules-based version needs five parts:
- Trend filter. For example, price above a rising 100-day moving average for longs.
- Entry. A pullback that holds above a prior swing low, or a new 20-day high.
- Initial stop. A multiple of ATR beyond the entry, so the stop respects current volatility.
- Trailing exit. Move the stop behind new swing lows or by an ATR multiple as the trend extends.
- Trend-ending condition. A close below the moving average, or a lower low, ends the setup.
Worked trend-following example in gold
Imagine gold futures at an illustrative $4,000 with a 20-day ATR of $60. A trend follower who uses a stop three ATR wide needs $180 of room. On GC, at $100 per $1.00, that is $18,000 of risk per contract. On MGC, at $10 per $1.00, it is $1,800.
If the trader's preset loss limit for the trade is $1,000, neither contract fits at three ATR. Cutting the stop to 1.5 ATR ($90) brings MGC to $900, which fits for one contract, but a tighter stop also means more trades stopped out by normal noise. That is the real tradeoff in trend following: wide stops keep you in the move, and they cost more per contract.
The failure mode is the choppy market. When price crosses the moving average back and forth, a trend follower takes a series of small losses waiting for the one move that pays for them. A trend-following record usually has a low win rate and depends on a few large winners. If you cannot sit through that pattern, the strategy will not survive contact with your own discipline.
Position trading commodities over months
Position trading is the slow version of trend following. It holds a commodity view for weeks or months based on a macro or supply theme, such as a multi-season shift in crop stocks. Because it spans several contract months, it requires a plan for rolling the position before each expiration and an account that can absorb wide daily swings. It also requires holding overnight and through weekends, which some accounts do not allow.
Breakout Strategy for Commodity Futures
A breakout strategy for commodities enters when price moves decisively beyond a level it has respected, such as the top of a multi-week range. It fits when a market has been compressed and a new piece of information (a report, a weather change, a supply disruption) forces a re-pricing.
Decide in advance what counts as a breakout:
- Intraday break. A trade beyond the level, often with a stop order. Fastest entry, most false signals.
- Close beyond the level. Fewer false signals, but a later and often worse price.
- Retest. Wait for price to come back to the broken level and hold. Better location, but some breakouts never retest.
Worked breakout example in crude oil
Imagine crude oil has traded between $68.00 and $72.40 for 20 sessions (illustrative prices). The plan places a buy stop at $72.50, just above the range high, with a protective stop at $71.50, back inside the range.
The risk is $1.00 per barrel. On CL that is $1,000 per contract. On MCL it is $100. With a preset $400 loss limit, four MCL would use the full $400 before commissions and slippage, so costs push it over the limit. Three MCL ($300 of price risk) leaves room for them. CL does not fit at all.
The breakout fails if price closes back below $72.40. That is the signal the range still holds. Do not move the stop lower hoping the breakout will "come back". A failed breakout often snaps back hard, because everyone who bought the break is now trapped.
The other temptation runs the opposite way. If price rips through $72.50 without you, chasing it at $73.20 is not the same trade. The stop is now $1.70 away, the size math changes, and the location is worse. Missing the entry does not make the next price a good entry.
Related lesson: Breakout trading
Range Trading Commodity Futures
Range trading in commodity futures buys near support and sells near resistance while a market moves sideways. It fits a balanced market, often between major reports, when no new information is strong enough to push price out of its recent boundaries.
A tradeable range needs three things: both boundaries tested at least twice, enough distance between them to cover the stop and costs with room to spare, and no scheduled catalyst that is likely to break it before the trade completes.
Worked range example in gold
Imagine gold has turned lower near $4,050 and higher near $3,950 several times (illustrative prices). A range trader buys near support at $3,960 with a stop at $3,935, below the boundary. The target is $4,035, just under resistance.
Risk is $25 per ounce, or $250 per MGC ($2,500 per GC). The target is $75 away, or $750 per MGC. That is a three-to-one reward to risk, which only exists because the entry is near the edge. A buy at $4,000, the middle of the range, has the same target with roughly half the reward and no clear stop. Range traders skip the middle.
The range is over when price closes beyond either boundary or volatility expands sharply. When that happens, the range trader's job is to stop fading the move, not to add to the losing side.
Related lesson: Range trading
Seasonal Commodity Trading Strategies
Seasonal commodity trading strategies study price tendencies that recur with the calendar, because many commodities have annual physical cycles. Natural gas demand rises with winter heating. Grain supply follows planting, the growing season and harvest.
A seasonal pattern is a historical tendency, not a forecast. The way to use it:
- Explain the cause. A seasonal window is only worth testing when there is a physical reason for it, such as heating demand or harvest supply.
- Check this year's conditions. If natural gas storage is already well above normal heading into winter, the usual seasonal support may not show up. Current inventories, crop reports and weather can contradict the calendar.
- Wait for price to agree. Use the seasonal tilt to choose which side to look for, then require a trend, breakout or range signal before entering.
- Respect the contract months. Corn's December contract carries new-crop supply while July carries old-crop, so seasonal studies must compare the same contract month across years.
Seasonal strategies also have a testing problem. Search enough calendar windows and some will look strong by chance. A seasonal edge with no physical reason and only a few years of data deserves suspicion.
Related lesson: Commodity seasonality
Commodity Spread and Arbitrage Strategies
Commodity spread strategies trade the price difference between two related contracts instead of the outright direction. The main types:
- Calendar spreads. Long one contract month and short another in the same commodity, trading changes in the curve.
- Intercommodity spreads. Two related markets, such as crude oil against refined products (the crack spread), soybeans against meal and oil (the crush spread), or gold against silver.
- Arbitrage. Buying and selling the same or equivalent exposure in two places to capture a price difference. True arbitrage is rare and usually belongs to firms with physical infrastructure, storage or very fast execution. CME Group notes that futures prices converge with spot prices as the contract approaches maturity, because otherwise an arbitrage opportunity would exist.
Worked calendar spread example in crude oil
Imagine a trader expects nearby crude supply to tighten. They buy the nearer CL contract at $70.00 and sell the next month at $69.60 (illustrative prices). The spread is $0.40, with the nearer month at a premium, which is backwardation.
A week later, both months have fallen. The nearer month is at $67.00 and the next month at $66.30. The long leg lost $3.00 per barrel, or $3,000. The short leg gained $3.30, or $3,300. The net is a gain of $300, because the spread widened from $0.40 to $0.70, a $0.30 change on 1,000 barrels.
That is the point of a spread: the outright direction mattered less than the relationship. Spreads are not low-risk by default, though. Curves can move sharply in both directions near expiration, the two legs can be priced in different units, and a spread needs a defined exit just like any outright trade.
Hedging Strategy With Commodity Futures
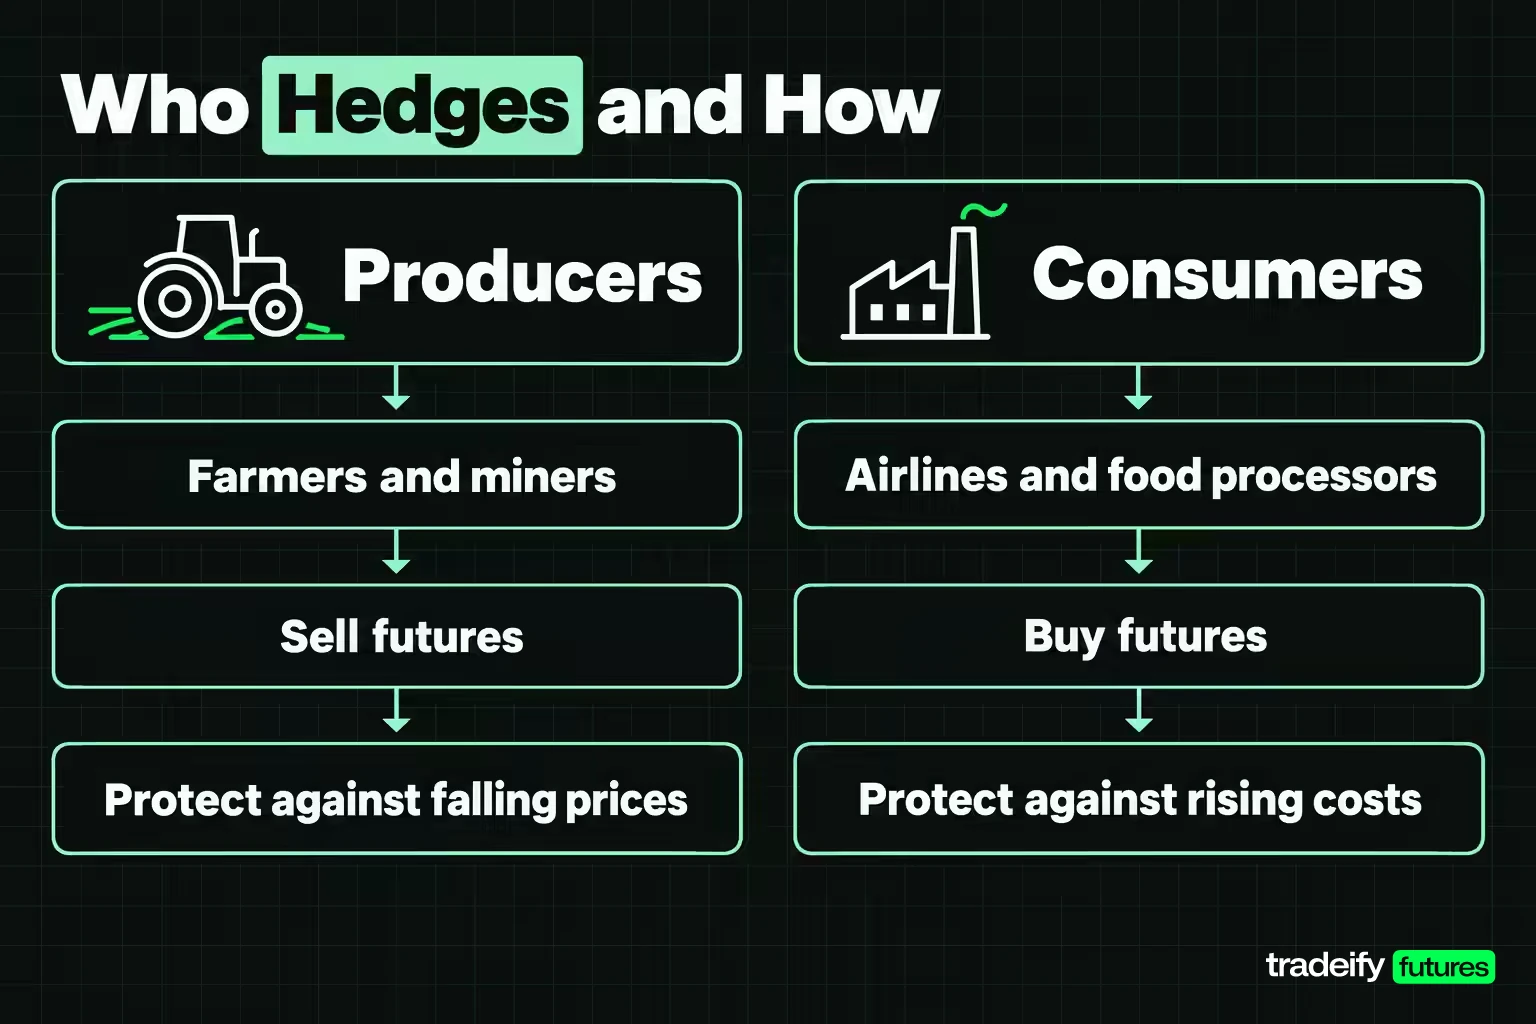
A hedging strategy with commodity futures uses a futures position to offset price risk in a physical business. Producers, such as farmers and miners, sell futures to protect against falling prices. Consumers, such as airlines, food processors and manufacturers, buy futures to protect against rising costs. Commercial hedgers are a core part of commodity futures markets, and speculators often take the other side of their trades.
Worked corn hedge example
Imagine a farmer expects to harvest 50,000 bushels of corn, which is 10 ZC contracts at 5,000 bushels each. In spring, December corn futures trade at $4.80 (illustrative). The local cash price usually runs $0.30 below futures, so the farmer expects about $4.50 a bushel and sells 10 December contracts.
By harvest, December futures have fallen to $4.30. The futures position gains $0.50 per bushel, or $25,000 across 10 contracts. With the usual $0.30 basis, the cash price is $4.00, and selling 50,000 bushels brings $200,000. Add the $25,000 futures gain and the total is $225,000, or $4.50 a bushel, the price the farmer planned around.
The hedge is not perfect. If the local basis weakens to $0.40 under futures, the cash price is $3.90, cash sales bring $195,000 and the total is $220,000, or $4.40 a bushel. That gap is basis risk. A hedge also gives up the upside: if prices had risen, the futures loss would have offset the higher cash price.
For a speculator, the lesson is that hedgers trade for reasons unrelated to short-term chart signals. Their selling or buying around harvest or contract rolls can push prices in ways a pure chart reader does not expect.
Related lesson: Hedging risk
How to Choose Commodity Trading Strategies by Market State
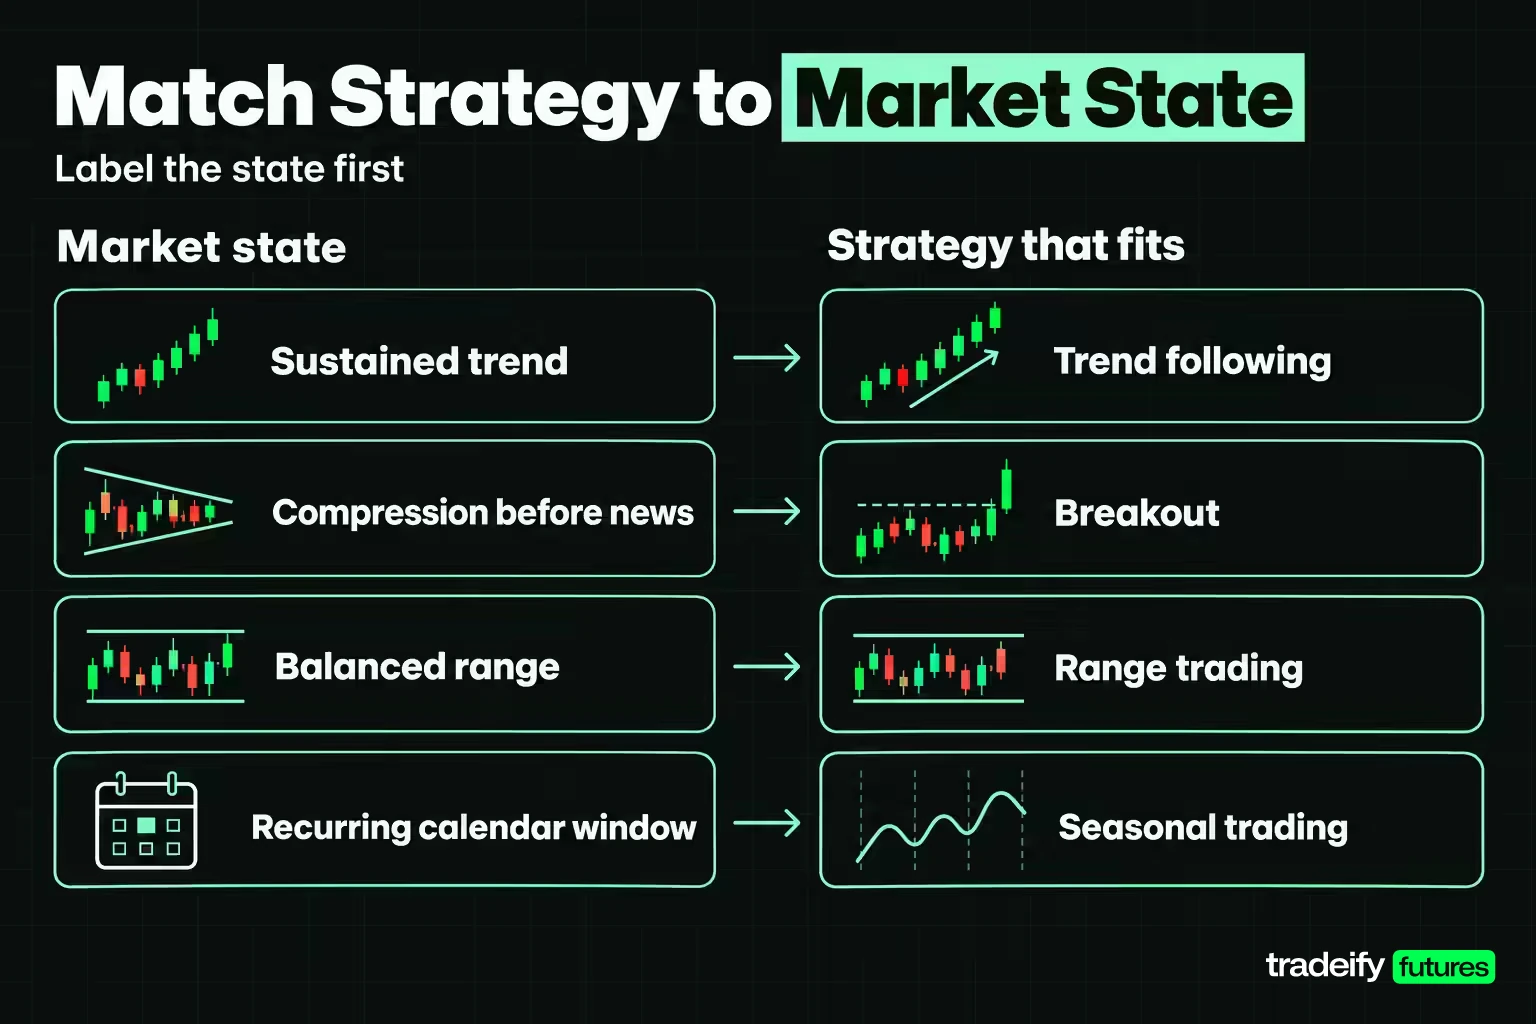
The way to choose between commodity trading strategies is to label the market state first, then pick the method built for that state. Start from the evidence, not from the trade you want.
| Market state | Evidence to look for | Strategy that fits | What cancels it |
|---|---|---|---|
| Sustained trend | Higher highs and higher lows, or the reverse, with price on one side of a rising or falling average | Trend following or position trading | Close back through the average or a broken swing point |
| Compression before news | Narrowing range near a tested boundary, a catalyst on the calendar | Breakout | Close back inside the old range |
| Balanced range | Both boundaries tested twice, room for stop and costs | Range trading | Close beyond either boundary or a volatility spike |
| Recurring calendar window | Physical reason, current data supports the pattern | Seasonal tilt plus a price trigger | Inventories or weather contradict the pattern |
| Curve relationship | Spread between months or related markets out of line with storage or supply | Calendar or intercommodity spread | Spread keeps moving against the thesis past its stop |
| No clear state | Mixed signals, thin liquidity, a report minutes away | No trade | Not applicable |
The last row is the one traders skip. A chart can always offer a reason to act after the fact, and a slow session makes it tempting to invent activity. "No fit" is a valid answer, and it is often the right one in the hour before a major report.
Testing a Commodity Strategy Before Trading It
A commodity strategy is testable only when another person could apply your rules to the same data and reach the same decisions. Write down:
- Market and contract. Commodity, exchange, contract month and the session your data covers.
- Setup. The market state that must exist before you look for an entry.
- Trigger. The exact price event and when it is measured.
- Entry. Market, limit or stop order, and the timing.
- Invalidation. The price or condition that proves the idea wrong.
- Size. Based on stop distance, point value, costs and a preset loss limit.
- Exit. Target, trailing, time-based and expiration rules.
- Event filter. Whether you trade through EIA, USDA or other scheduled reports.
Backtest checks for commodity strategies
A profitable backtest can still be a bad strategy. Before trusting one, check that the commodity strategy test:
- Uses roll-adjusted data, or handles each contract month separately, so roll gaps do not create fake trades.
- Enters only on information available at the time, such as the next session's open after a closing signal.
- Fills stops at the first tradable price after a gap, not at the stop level.
- Includes commissions, exchange fees and realistic slippage, especially around reports.
- Shows results by year and by market state, not only as one total.
- Survives nearby settings. If a 20-day breakout works and the 15-day and 25-day versions fail, the result is probably fragile.
- Reports how much of the profit came from the few largest trades.
- Keeps losing and skipped signals in the record.
A small sample can look convincing by chance, and one rough week is not a verdict on a strategy either. Treat testing as an attempt to break the rule, not a search for the settings that look best.
Related lesson: Backtesting a trading strategy
Position Sizing and Risk Management for Commodity Trades
Risk management for commodity trades starts with the contract math. Every commodity strategy should answer the same question before entry: how many dollars do I lose on one contract if the stop is hit, and how many contracts does my loss limit allow?
The calculation:
- Stop distance in price units, multiplied by the contract unit, gives the dollar risk for one contract.
- Add expected commissions, fees and slippage.
- Divide your preset loss limit by that total and round down to a whole contract.
- If one contract exceeds the limit, the answer is zero. Use a smaller contract or skip the trade.
For example, a $0.40 stop in crude oil is $400 on CL and $40 on MCL. With a $250 loss limit, CL is zero contracts and MCL is six ($240 of price risk), leaving $10 for costs. If costs run higher than that, the answer drops to five.
Commodity risks a stop does not cover
- Gaps. Commodity futures trade nearly around the clock, but reports and weekend news can still gap price through a stop. A stop becomes a market order when triggered and can fill well beyond the stop price.
- Report spikes. Inventory and crop reports can produce fast two-way moves with thin liquidity in the first minutes.
- Leverage. Exchange margin is a deposit, not the maximum loss, and exchanges change margin levels as volatility changes. Losses in a brokerage account can exceed the money deposited.
- Expiration and delivery. CL trading terminates three business days before the 25th calendar day of the month before the contract month. GC terminates at 12:30 PM CT on the third last business day of the contract month. Corn terminates on the business day before the 15th of the contract month. Brokers can also set their own earlier deadlines for closing physically settled positions, often around first notice day, so check yours.
- Settlement type. CL is physically delivered, while MCL is financially settled and terminates one business day before the matching CL contract. Check which one you trade.
- Concentration. Crude oil, natural gas and refined products often move together, as do gold and silver. Two "different" trades in one group can be one bet.
Account-level limits for commodity traders
Set limits at three levels: per trade (maximum loss including costs), per market group (maximum exposure to energy, metals or grains at once) and per day or week (a loss that ends trading until the next session). The account limit is what keeps a bad week in one commodity from becoming a bad month.
Related lesson: First notice day and last trading day
Benefits and Challenges of Commodity Trading
Commodity trading gives you markets that move on their own physical drivers, and it charges for that with leverage, expiration dates and report risk. Which side of that trade-off matters most depends on the strategy you plan to run.
Benefits
- Diversification. Commodity prices often respond to different drivers than stock prices, so they can behave differently from an equity-heavy portfolio, though the relationship changes over time.
- Inflation-linked exposure. Commodity prices are part of what inflation measures, so commodities can respond when inflation rises, although not reliably and not on a predictable schedule.
- Two-way trading. Futures make going short as simple as going long.
- Liquidity and hours. Major energy and metals futures trade 23 hours a day on CME Globex, Sunday to Friday, with a 60-minute daily break.
- Transparent fundamentals. Inventory, production and crop data are published on schedules anyone can follow.
Challenges
- Leverage and volatility. Small price changes produce large dollar swings, and commodities can move sharply on weather or supply shocks.
- Contract complexity. Expiration, rolling, delivery and contract months add steps that stock traders never face.
- Event risk. Geopolitical news and reports can move prices before you can react.
- Information depth. Understanding crude oil, natural gas and corn well takes separate study for each.
Who Regulates Commodity Futures Trading
Commodity futures trading in the United States is overseen by the Commodity Futures Trading Commission (CFTC). Congress created the CFTC in 1974 through the Commodity Futures Trading Commission Act, at a time when most futures trading was agricultural. Its stated mission is to promote the integrity, resilience and vibrancy of the U.S. derivatives markets through sound regulation.
The National Futures Association (NFA) is the industrywide self-regulatory organization for the U.S. derivatives industry. The CFTC designated it a registered futures association in 1981, and it began regulatory operations in 1982. NFA also provides regulatory services to exchanges, which have their own self-regulatory duties to monitor trading on their platforms.
Exchanges such as CME Group set contract specifications, trading hours and settlement procedures in their rulebooks. Before opening a commodity futures account, a trader can check a firm's registration status and disciplinary history using the NFA's investor resources. The CFTC also publishes customer advisories warning that unfamiliar products, short-term speculation and leverage can lead to large losses.
Commodity Strategies on an Intraday Funded Account
Commodity strategies change shape when every position must close within one session. Most of the classic commodity methods (position trading, seasonal windows, hedges and multi-week trends) assume you can hold for days or months. An intraday-only account keeps the tools but shortens the clock: the trend or seasonal view becomes a filter for which side to trade today, and the entries come from intraday breakouts, ranges and reactions to the day's reports. The EIA petroleum report on Wednesday mornings and the storage report on Thursday mornings both land inside the regular U.S. trading day, so report risk is part of the plan rather than an overnight surprise.
On our accounts, every position must be closed by 4:45 PM ET and there are no overnight, weekend or swing holds, so position trading, seasonal holds and hedges that span days are not something you can run with us. Our hedging rule also prohibits opposing positions on the same instrument or on two products in the same Product Group, which rules out a crude oil calendar spread or a long gold, short silver trade. The commodity contracts we support include CL, MCL, QM, NG, QG, GC, MGC, SI, HG, PL, PA, QO, ZC, ZW, ZS, ZL, ZM, HE, LE and GF, and one CL or GC uses the same contract limit as one ES.
Commodity Trading Strategies FAQ
What is the best commodity trading strategy?
The best commodity trading strategy is the one whose rules fit the current market state, because no single method works in every market. Trend following suits sustained supply imbalances, range trading suits balanced markets, and breakouts suit compressed markets meeting new information. Whichever you pick, it should survive a test with realistic costs.
Is commodity trading good for beginners?
Commodity trading is harder for beginners than it looks, because of leverage, contract expiration and fast report-driven moves. A beginner can reduce the dollar risk by starting with micro contracts such as MCL or MGC and one market. Learning one commodity's drivers and contract details well is more useful than trading several at once.
Can seasonality predict commodity prices?
Seasonality can point to a recurring window, but it cannot predict direction in a given year. Current inventories, weather, production and policy can override the historical pattern. Use it as context and require a price trigger before entering.
How much should you risk on a commodity trade?
Risk only what a preset dollar loss limit allows, worked out per contract rather than as a universal percentage. Start with that limit, calculate one contract's risk from entry to stop using its point value, add costs, and trade zero contracts if one is too large. This is a risk-control process, not individual advice.
What happens if you hold a commodity future to expiration?
A physically settled contract such as CL, GC or ZC can lead to delivery obligations, while a financially settled contract such as MCL closes against a final settlement price. Brokers often set their own close-out deadlines for physically settled contracts. Check the exchange calendar and your broker's deadlines before entering.
Commodity futures are leveraged, and losses can be larger and faster than expected; in a personal brokerage account they can exceed the money deposited. Stops do not guarantee a fill at the stop price, especially around reports and gaps. All prices and examples in this guide are illustrative, not forecasts or recommendations. Funded and evaluation accounts are simulated, and simulated results can differ from live trading. This article is educational and is not individualized financial or trading advice.


